| Param | Original file | Final file |
|---|---|---|
| Filename | modeM0/AS1A13_003T01_9000006002_44563cztM0_level2.fits | modeM0/AS1A13_003T01_9000006002_44563cztM0_level2_quad_clean.evt |
| Size (bytes) | 556,130,880 | 108,195,840 |
| Size | 530.4 MB | 103.2 MB |
| Events in quadrant A | 5,428,281 | 733,244 |
| Events in quadrant B | 5,062,695 | 706,808 |
| Events in quadrant C | 3,887,761 | 734,699 |
| Events in quadrant D | 5,695,597 | 641,085 |
| Mode M9 | |||
|---|---|---|---|
| Quadrant | BADHDUFLAG | Total packets | Discarded packets |
| A | 0 | 10 | 0 |
| B | 0 | 10 | 0 |
| C | 0 | 10 | 0 |
| D | 0 | 10 | 0 |
| Mode SS | |||
|---|---|---|---|
| Quadrant | BADHDUFLAG | Total packets | Discarded packets |
| A | 0 | 134 | 0 |
| B | 0 | 134 | 0 |
| C | 0 | 134 | 0 |
| D | 0 | 134 | 0 |
| Mode M0 | |||
|---|---|---|---|
| Quadrant | BADHDUFLAG | Total packets | Discarded packets |
| A | 0 | 21574 | 2 |
| B | 0 | 19462 | 2 |
| C | 0 | 16007 | 2 |
| D | 0 | 21449 | 2 |
| Quadrant | Total seconds | Saturated seconds | Saturation percentage |
|---|---|---|---|
| A | 6603 | 275 | 4.164774% |
| B | 6603 | 750 | 11.358473% |
| C | 6602 | 143 | 2.166010% |
| D | 6602 | 477 | 7.225083% |
Noise dominated data is calculated using 1-second bins in cleaned event files. If a bin has >2000 counts, and if more than 50% of those come from <1% of pixels, then it is considered to be noise-dominated and hence unusable.
| Quadrant | # 1 sec bins | Bins with >0 counts | Bins with >2000 counts | High rate bins dominated by noise | Noise dominated (total time) | Noise dominated (detector-on time) | Marked lightcurve |
|---|---|---|---|---|---|---|---|
| A | 7568 | 6603 | 71 | 71 | 0.94% | 1.08% | 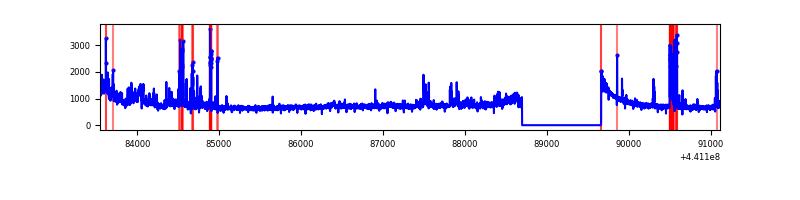 |
| B | 7568 | 6603 | 468 | 468 | 6.18% | 7.09% | 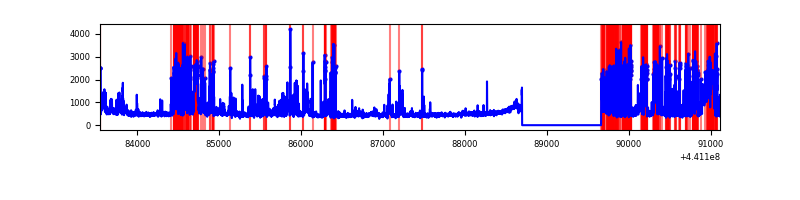 |
| C | 7567 | 6602 | 54 | 54 | 0.71% | 0.82% | 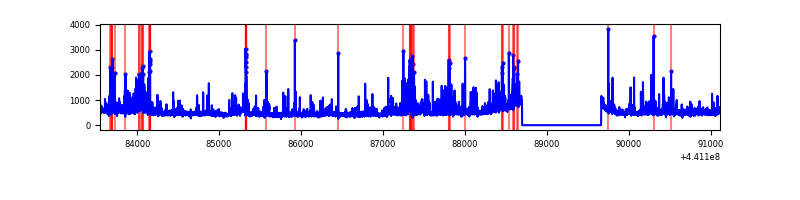 |
| D | 7566 | 6601 | 356 | 356 | 4.71% | 5.39% | 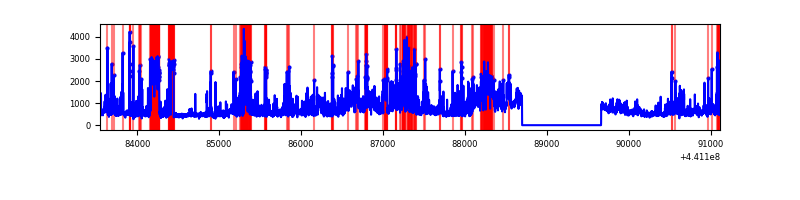 |
Top three noisy pixels from each quadrant. If the there are fewer than three noisy pixels in the level2.evt file, extra rows are filled as -1
| Pixel properties | Quadrant properties | ||||||
|---|---|---|---|---|---|---|---|
| Quadrant | DetID | PixID | Counts | Sigma | Mean | Median | Sigma |
| A | 10 | 83 | 1816629 | 11409.8 | 768 | 749 | 159.2 |
| A | 15 | 223 | 450376 | 2825.16 | 768 | 749 | 159.2 |
| A | 13 | 248 | 189328 | 1184.91 | 768 | 749 | 159.2 |
| B | 5 | 235 | 1149527 | 7856.56 | 742 | 720 | 146.2 |
| B | 5 | 172 | 861495 | 5886.74 | 742 | 720 | 146.2 |
| B | 4 | 171 | 41550 | 279.23 | 742 | 720 | 146.2 |
| C | 15 | 208 | 553057 | 3148.12 | 752 | 758 | 175.4 |
| C | 14 | 254 | 244776 | 1390.91 | 752 | 758 | 175.4 |
| C | 3 | 233 | 143988 | 816.42 | 752 | 758 | 175.4 |
| D | 13 | 174 | 1247417 | 6755.76 | 739 | 717 | 184.5 |
| D | 1 | 52 | 633595 | 3429.51 | 739 | 717 | 184.5 |
| D | 7 | 38 | 357805 | 1935.03 | 739 | 717 | 184.5 |
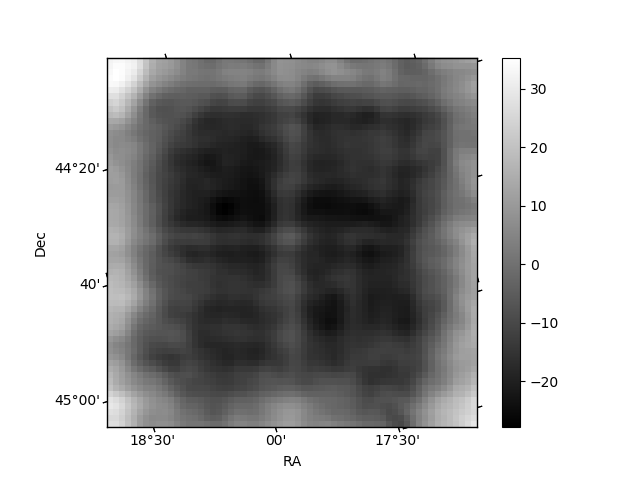
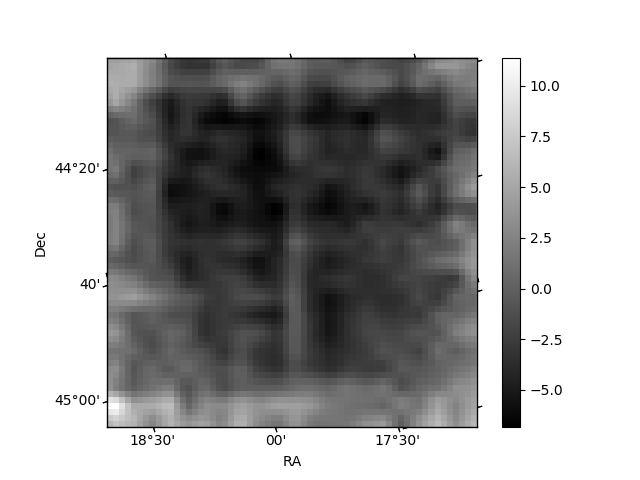
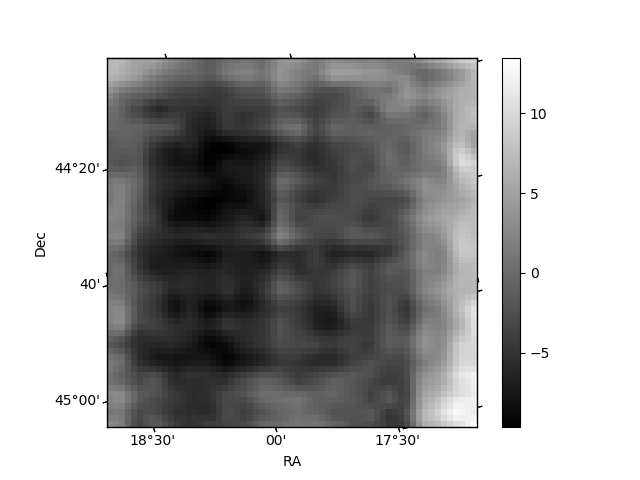
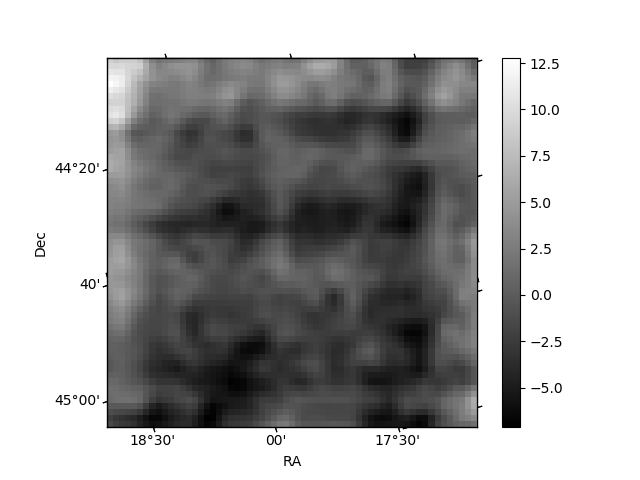
Histogram calculated using DETX and DETY for each event in the final _common_clean file
| Quadrant A | 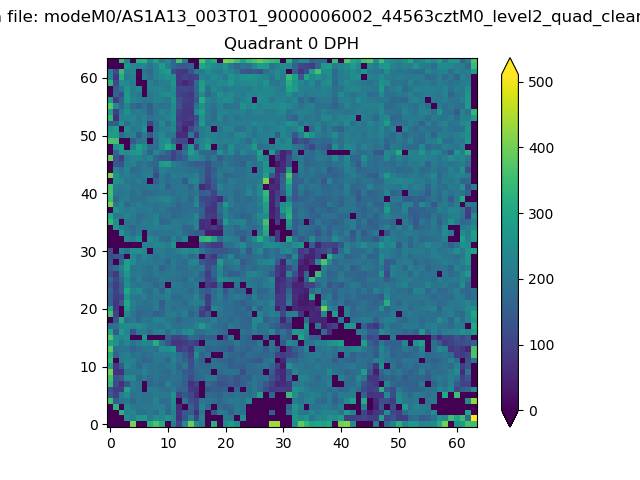 |
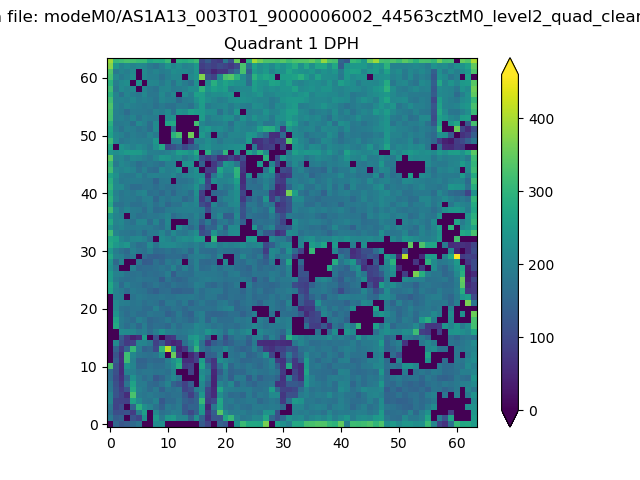 |
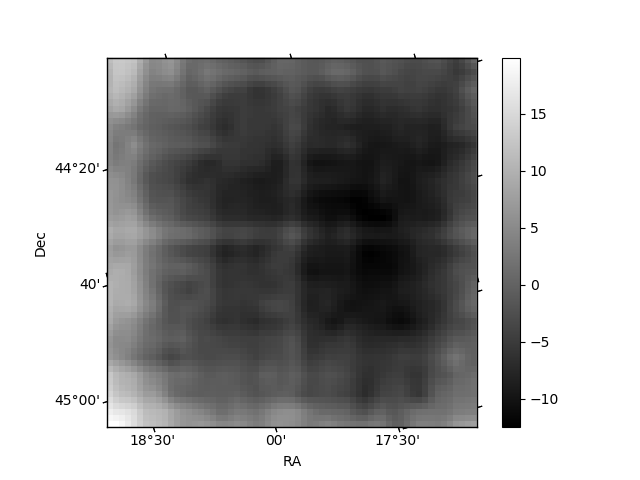
Quadrant B |
|---|---|---|---|
| Quadrant D | 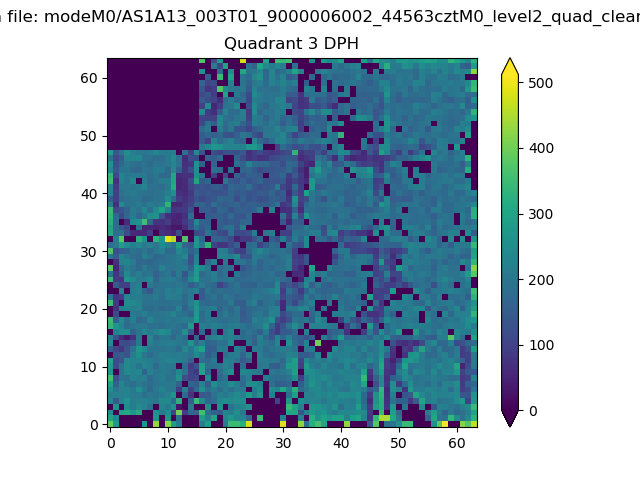 |
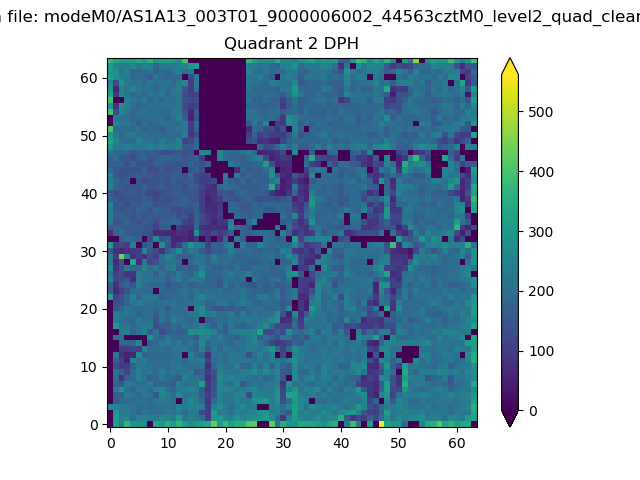 |
Quadrant C |
| Plot type | Count rate plots | Images |
|---|---|---|
| Comparison with Poisson distribution Blue bars denote a histogram of data divided into 1 sec bins. Red curve is a Poisson curve with rate = median count rate of data. |
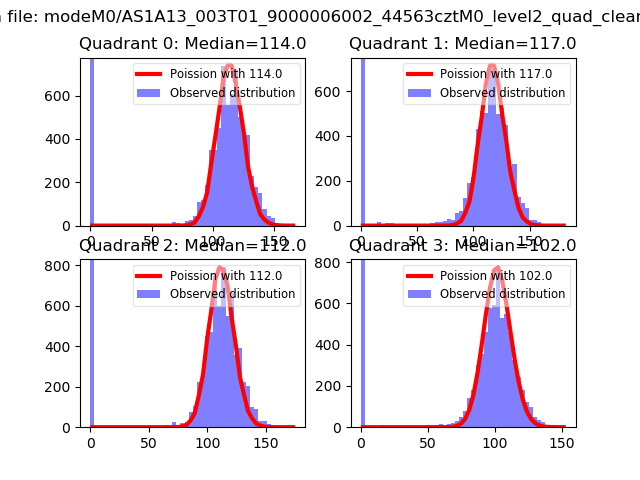 |
 |
| Quadrant-wise count rates Data is divided into 100 sec bins |
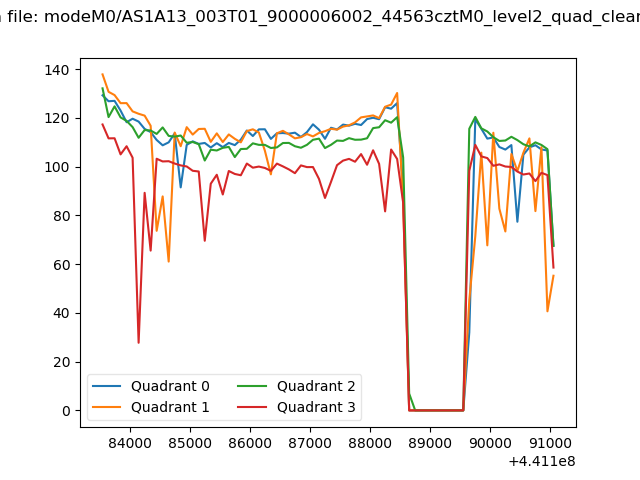 |
|
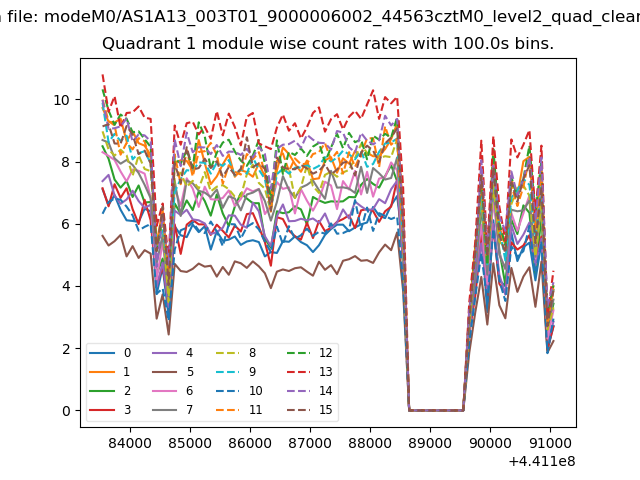
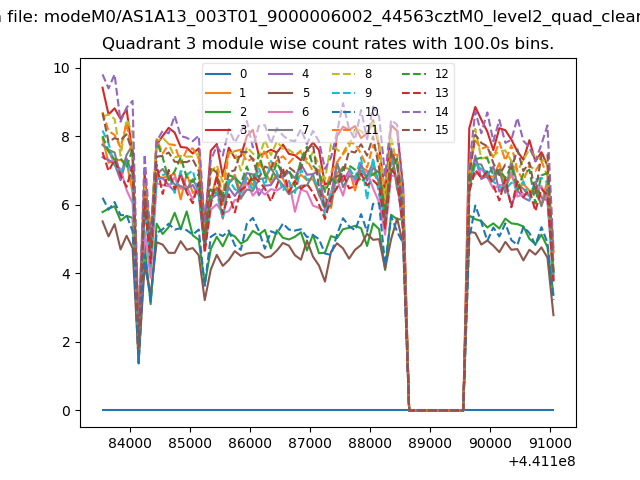
| Module-wise count rates for Quadrant A Data is divided into 100 sec bins |
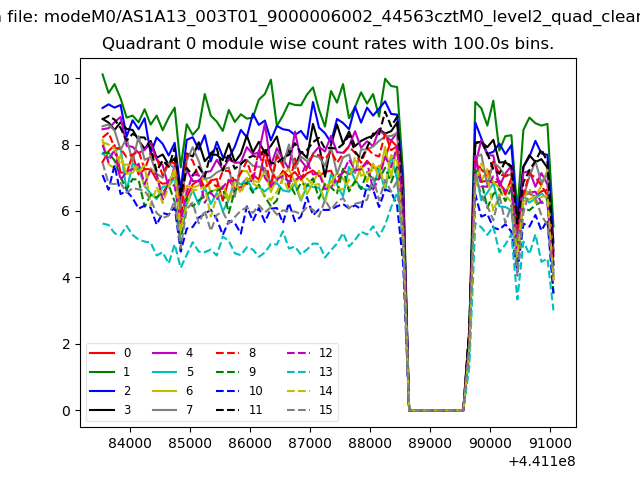 |
 |
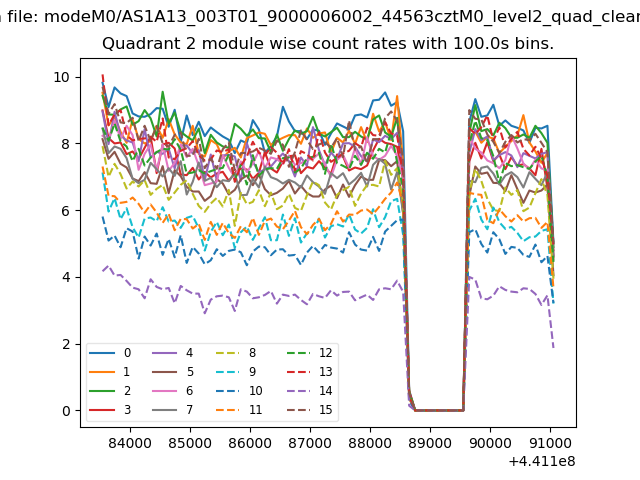
| Module-wise count rates for Quadrant B Data is divided into 100 sec bins |
 |
 |
| Module-wise count rates for Quadrant C Data is divided into 100 sec bins |
 |
 |
| Module-wise count rates for Quadrant D Data is divided into 100 sec bins |
 |
 |
| Parameter | Plot |
|---|---|
| CZT HV Monitor | 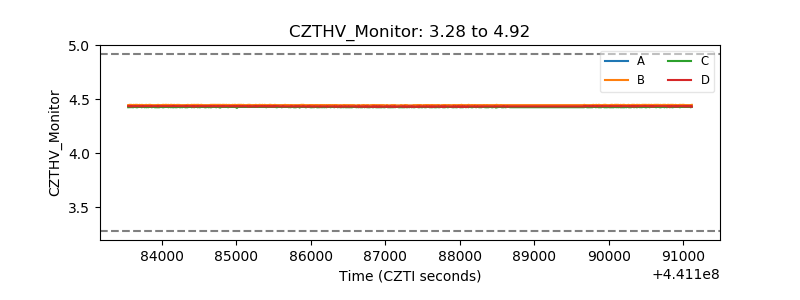 |
| D_VDD | 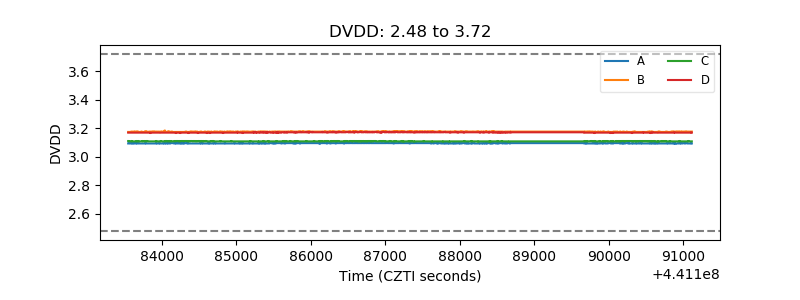 |
| Temperature 1 | 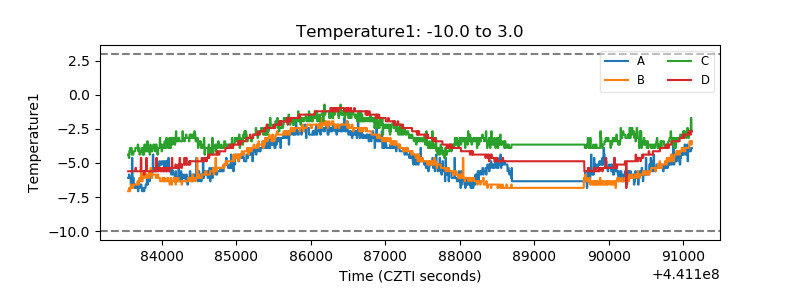 |
| Veto HV Monitor |  |
| Veto LLD | 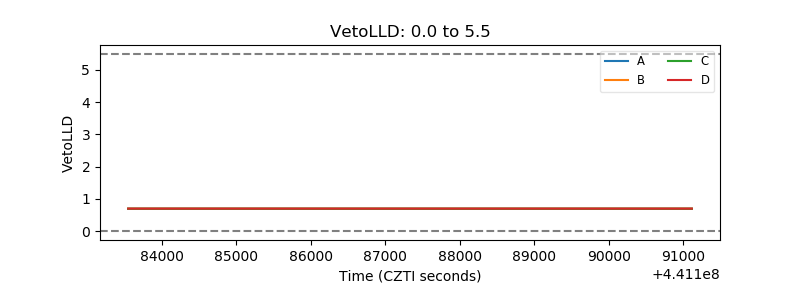 |
| Alpha Counter | 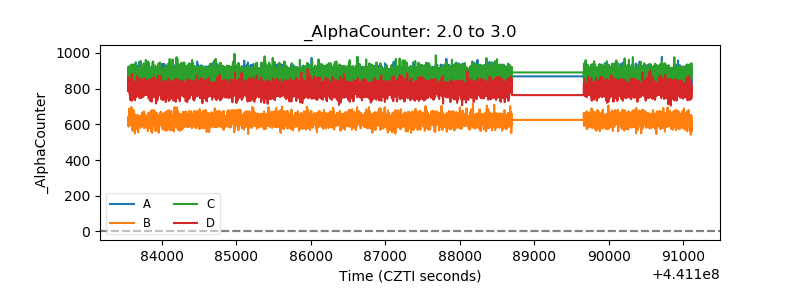 |
| _CPM_Rate | 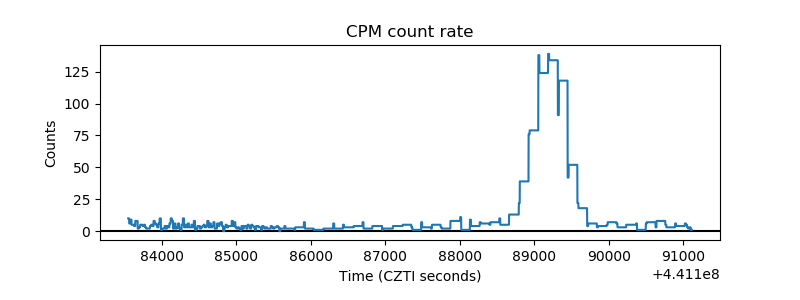 |
| CZT Counter | 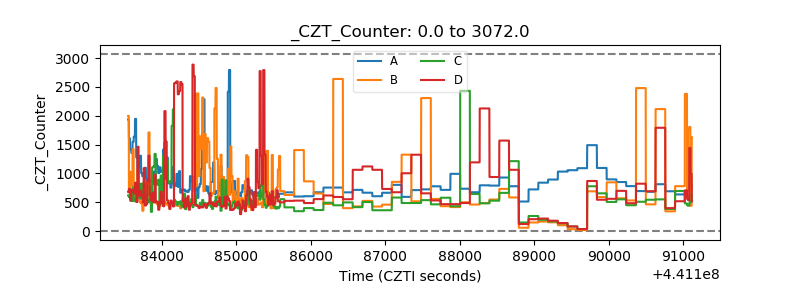 |
| +2.5 Volts monitor | 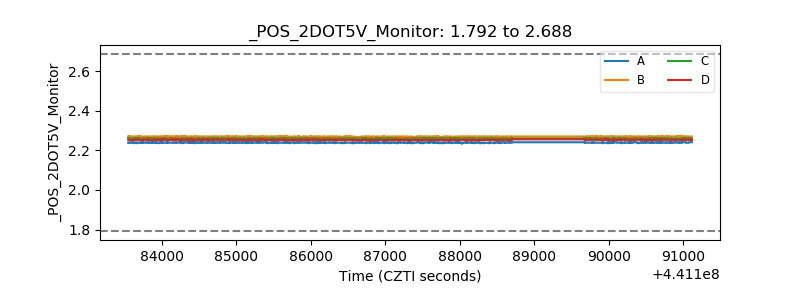 |
| +5 Volts monitor | 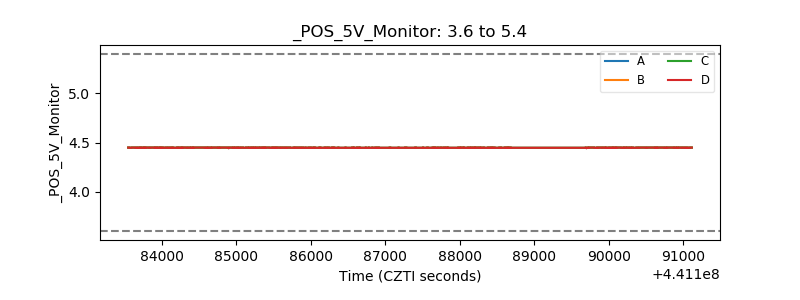 |
| _ROLL_ROT | 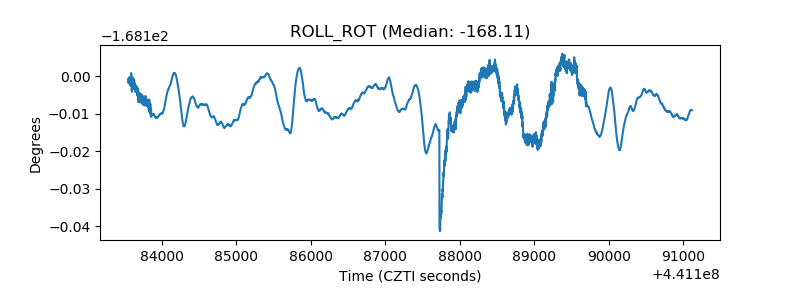 |
| _Roll_DEC | 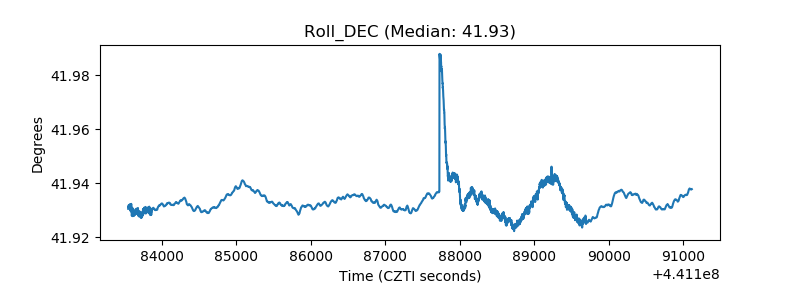 |
| _Roll_RA | 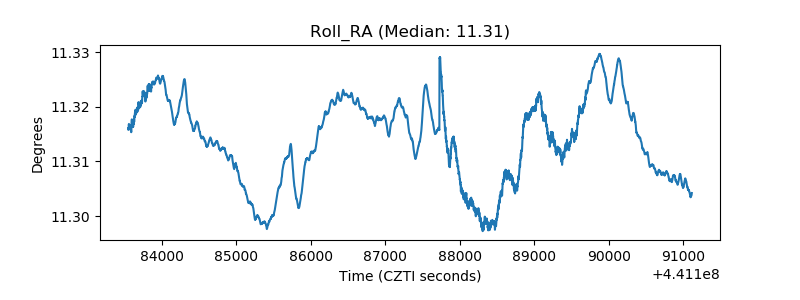 |
| Veto Counter | 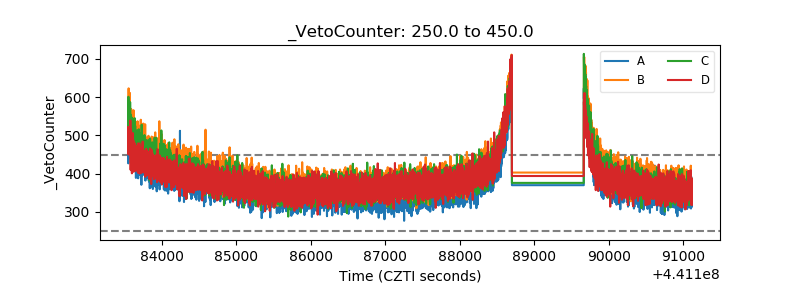 |