| Param | Original file | Final file |
|---|---|---|
| Filename | modeM0/AS1A13_003T01_9000006002_44565cztM0_level2.fits | modeM0/AS1A13_003T01_9000006002_44565cztM0_level2_quad_clean.evt |
| Size (bytes) | 524,733,120 | 119,476,800 |
| Size | 500.4 MB | 113.9 MB |
| Events in quadrant A | 5,383,202 | 790,604 |
| Events in quadrant B | 3,645,107 | 815,154 |
| Events in quadrant C | 3,988,261 | 788,075 |
| Events in quadrant D | 5,837,062 | 711,526 |
| Mode SS | |||
|---|---|---|---|
| Quadrant | BADHDUFLAG | Total packets | Discarded packets |
| A | 0 | 148 | 0 |
| B | 0 | 148 | 0 |
| C | 0 | 148 | 0 |
| D | 0 | 148 | 0 |
| Mode M0 | |||
|---|---|---|---|
| Quadrant | BADHDUFLAG | Total packets | Discarded packets |
| A | 0 | 22703 | 0 |
| B | 0 | 16024 | 0 |
| C | 0 | 16819 | 1 |
| D | 0 | 22571 | 0 |
| Quadrant | Total seconds | Saturated seconds | Saturation percentage |
|---|---|---|---|
| A | 7354 | 195 | 2.651618% |
| B | 7355 | 131 | 1.781101% |
| C | 7354 | 46 | 0.625510% |
| D | 7354 | 177 | 2.406853% |
Noise dominated data is calculated using 1-second bins in cleaned event files. If a bin has >2000 counts, and if more than 50% of those come from <1% of pixels, then it is considered to be noise-dominated and hence unusable.
| Quadrant | # 1 sec bins | Bins with >0 counts | Bins with >2000 counts | High rate bins dominated by noise | Noise dominated (total time) | Noise dominated (detector-on time) | Marked lightcurve |
|---|---|---|---|---|---|---|---|
| A | 7354 | 7354 | 85 | 85 | 1.16% | 1.16% | 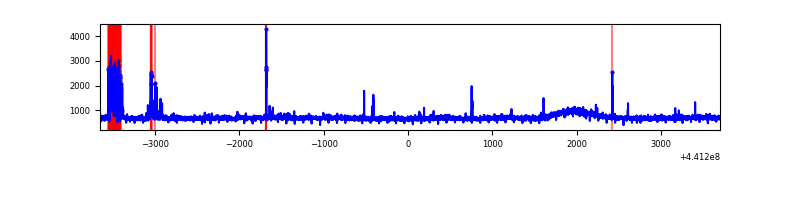 |
| B | 7355 | 7355 | 52 | 52 | 0.71% | 0.71% | 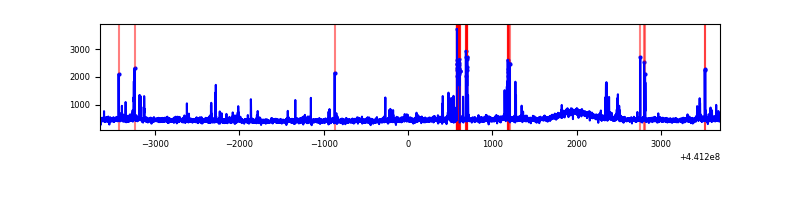 |
| C | 7354 | 7354 | 23 | 23 | 0.31% | 0.31% | 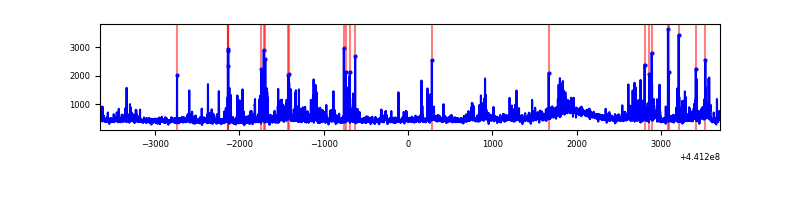 |
| D | 7354 | 7354 | 169 | 169 | 2.30% | 2.30% | 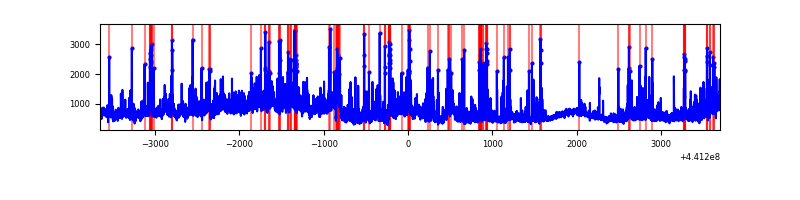 |
Top three noisy pixels from each quadrant. If the there are fewer than three noisy pixels in the level2.evt file, extra rows are filled as -1
| Pixel properties | Quadrant properties | ||||||
|---|---|---|---|---|---|---|---|
| Quadrant | DetID | PixID | Counts | Sigma | Mean | Median | Sigma |
| A | 10 | 83 | 1814129 | 10400.15 | 838 | 818 | 174.4 |
| A | 13 | 248 | 229913 | 1313.96 | 838 | 818 | 174.4 |
| A | 15 | 223 | 73771 | 418.42 | 838 | 818 | 174.4 |
| B | 5 | 172 | 241725 | 1469.71 | 830 | 804 | 163.9 |
| B | 0 | 186 | 45543 | 272.93 | 830 | 804 | 163.9 |
| B | 0 | 168 | 30193 | 179.28 | 830 | 804 | 163.9 |
| C | 14 | 254 | 395910 | 2038.16 | 818 | 826 | 193.8 |
| C | 15 | 208 | 190810 | 980.09 | 818 | 826 | 193.8 |
| C | 3 | 233 | 187662 | 963.85 | 818 | 826 | 193.8 |
| D | 13 | 174 | 1282268 | 6279.13 | 815 | 791 | 204.1 |
| D | 1 | 52 | 646255 | 3162.72 | 815 | 791 | 204.1 |
| D | 2 | 249 | 447384 | 2188.27 | 815 | 791 | 204.1 |
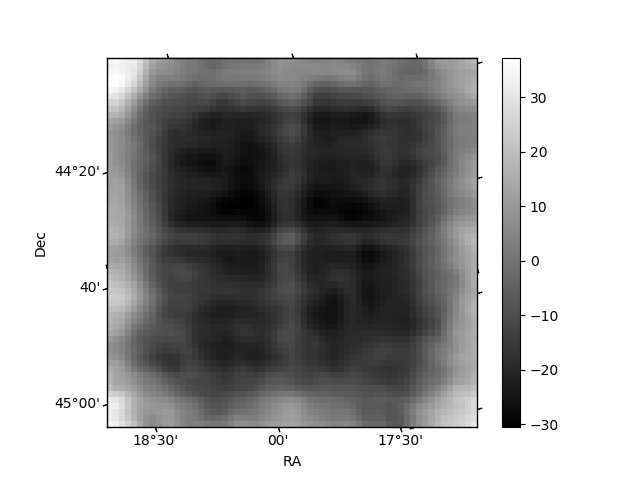
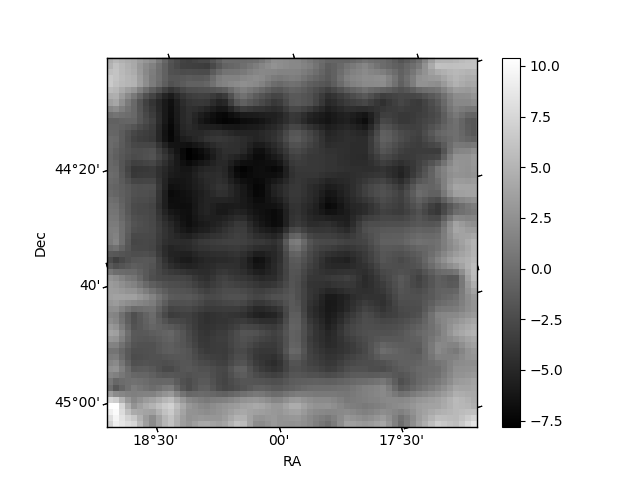
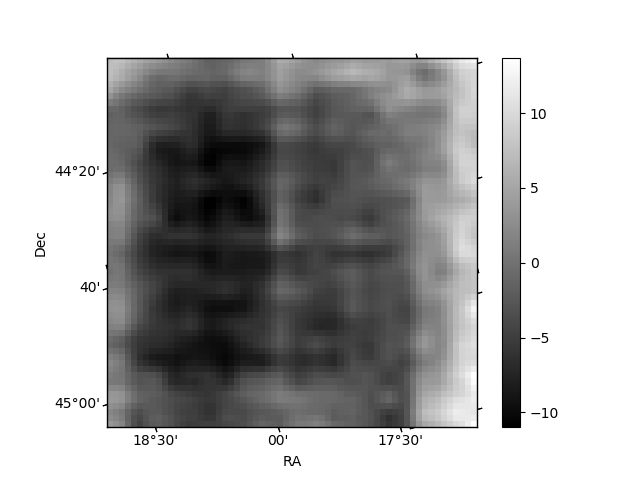
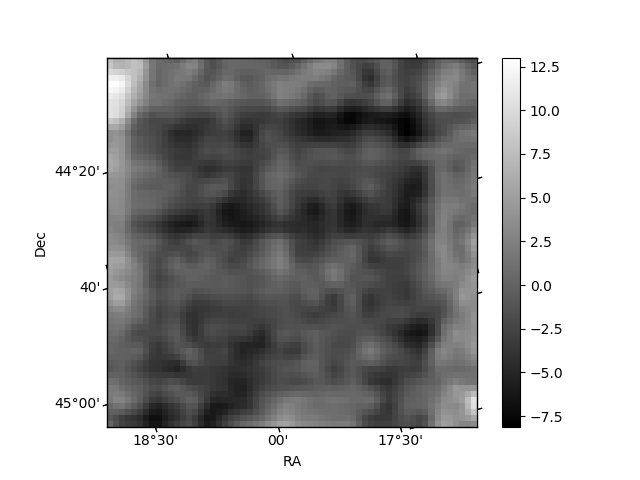
Histogram calculated using DETX and DETY for each event in the final _common_clean file
| Quadrant A | 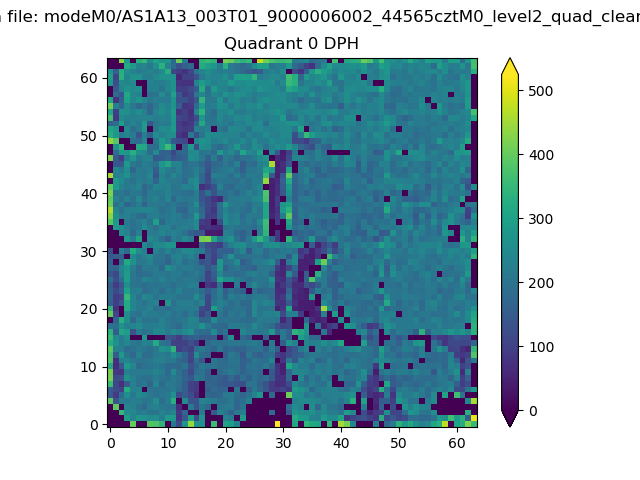 |
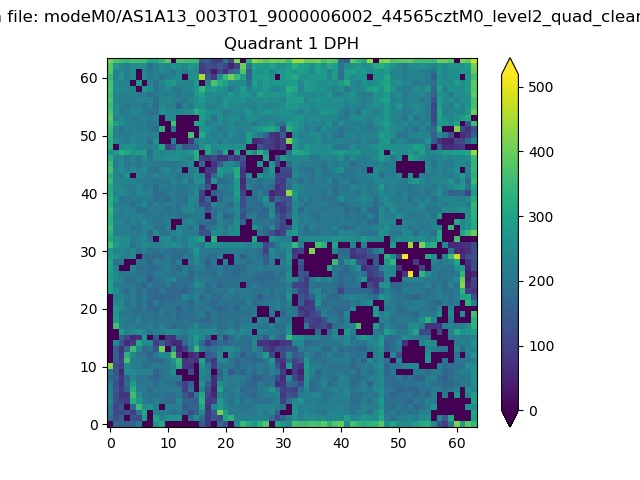 |
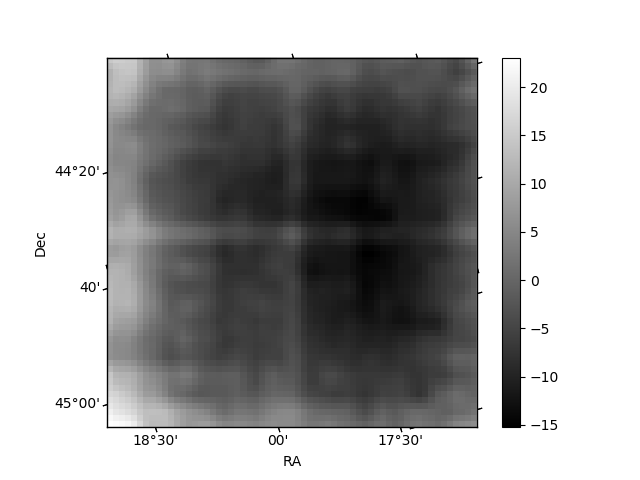
Quadrant B |
|---|---|---|---|
| Quadrant D | 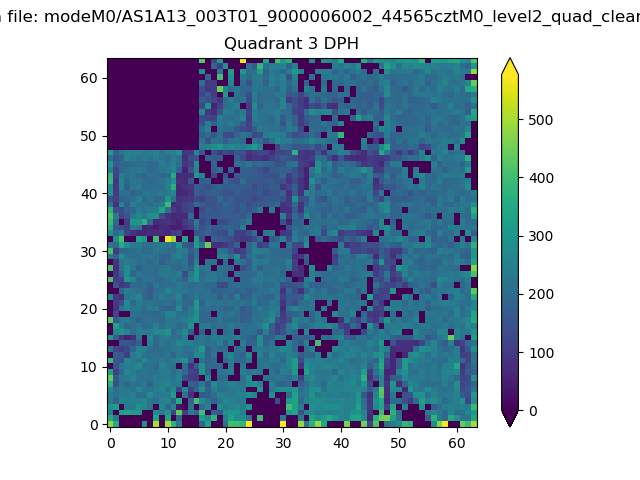 |
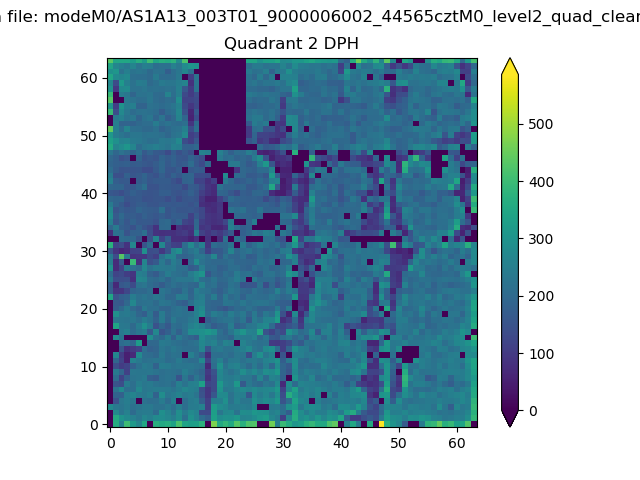 |
Quadrant C |
| Plot type | Count rate plots | Images |
|---|---|---|
| Comparison with Poisson distribution Blue bars denote a histogram of data divided into 1 sec bins. Red curve is a Poisson curve with rate = median count rate of data. |
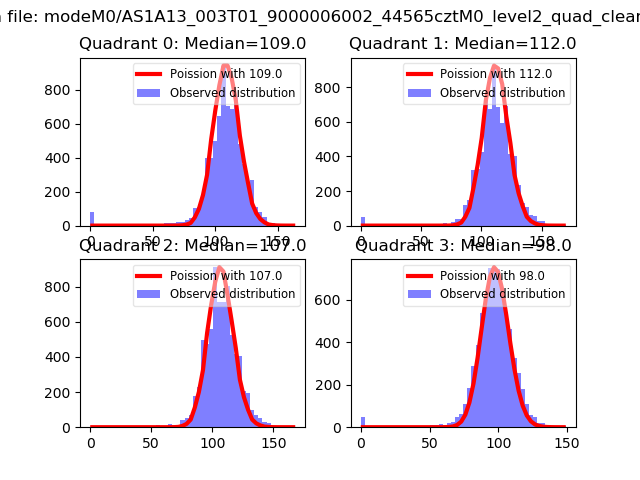 |
 |
| Quadrant-wise count rates Data is divided into 100 sec bins |
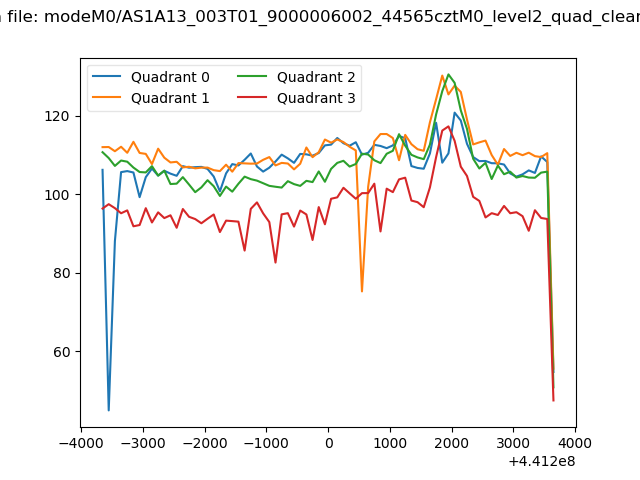 |
|
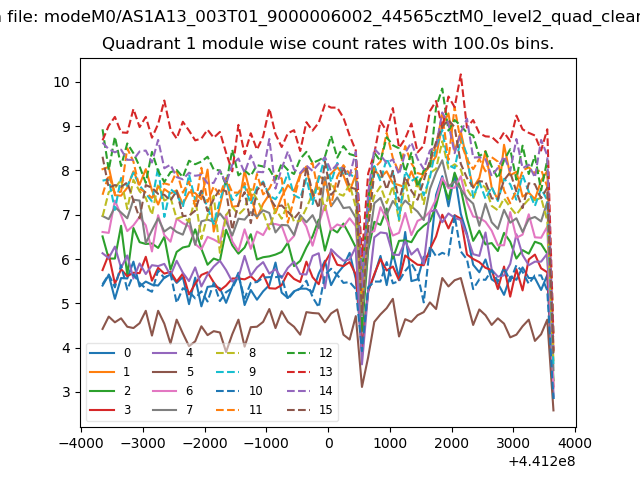
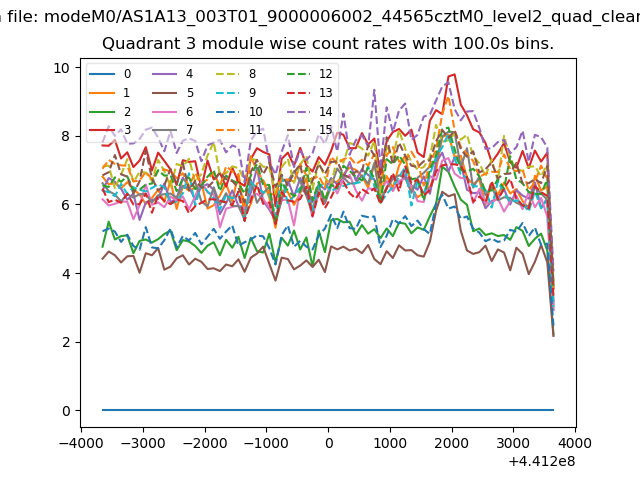
| Module-wise count rates for Quadrant A Data is divided into 100 sec bins |
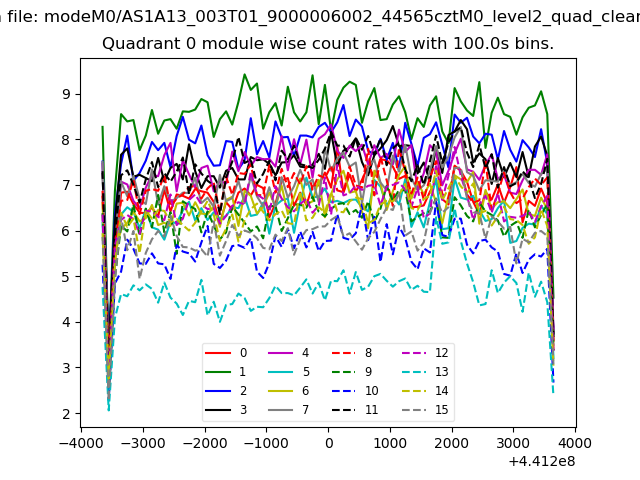 |
 |
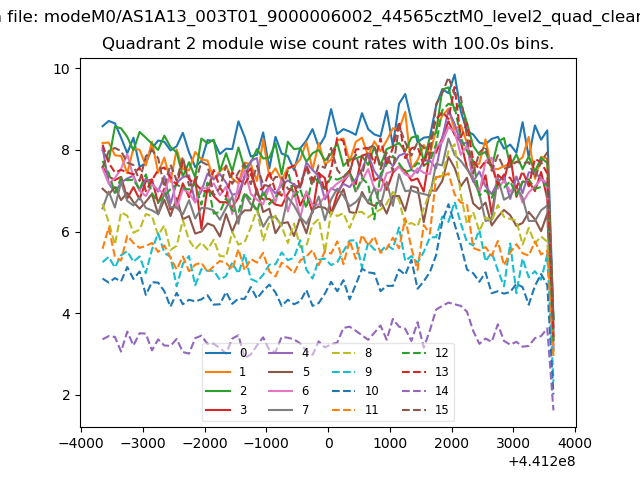
| Module-wise count rates for Quadrant B Data is divided into 100 sec bins |
 |
 |
| Module-wise count rates for Quadrant C Data is divided into 100 sec bins |
 |
 |
| Module-wise count rates for Quadrant D Data is divided into 100 sec bins |
 |
 |
| Parameter | Plot |
|---|---|
| CZT HV Monitor |  |
| D_VDD | 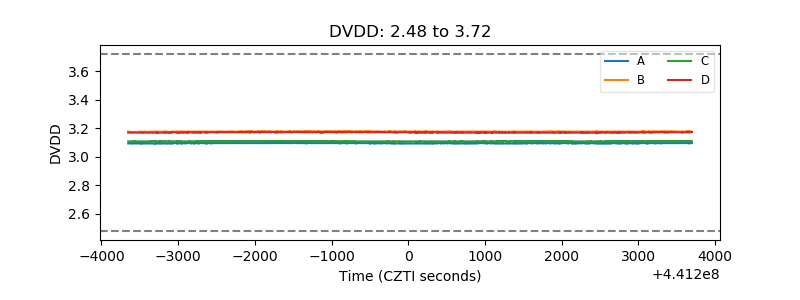 |
| Temperature 1 | 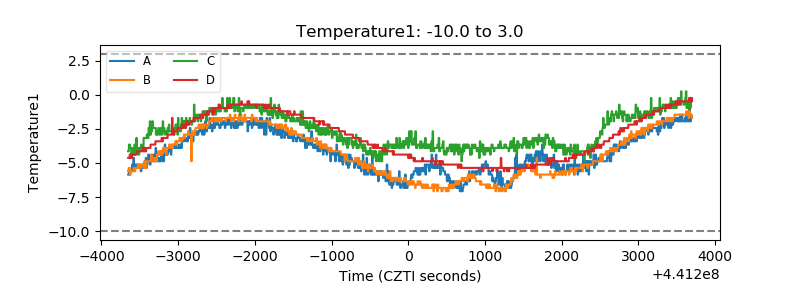 |
| Veto HV Monitor | 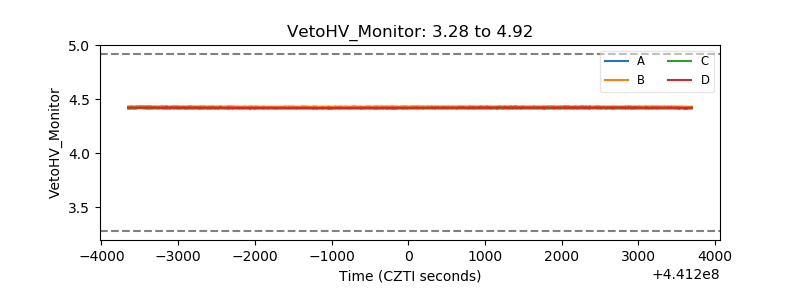 |
| Veto LLD | 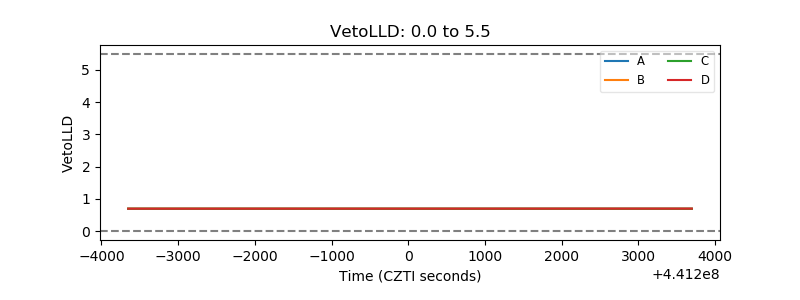 |
| Alpha Counter | 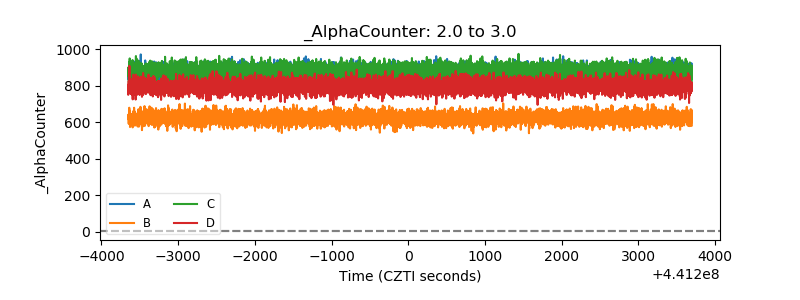 |
| _CPM_Rate | 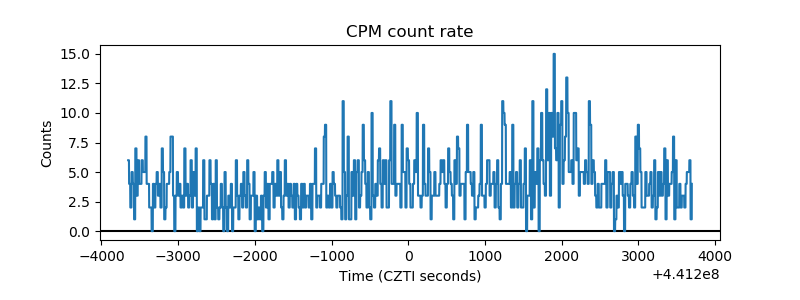 |
| CZT Counter | 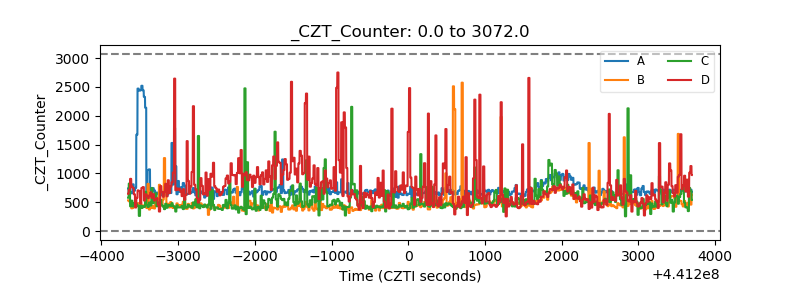 |
| +2.5 Volts monitor | 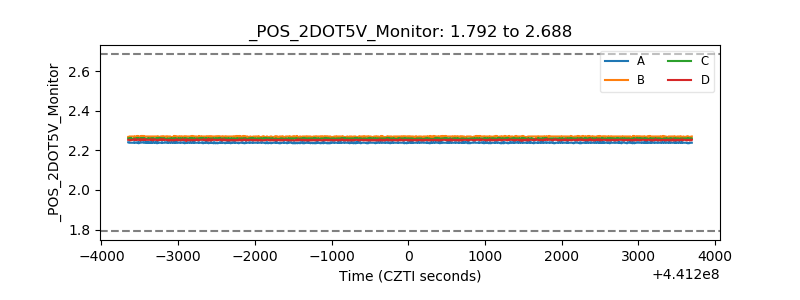 |
| +5 Volts monitor | 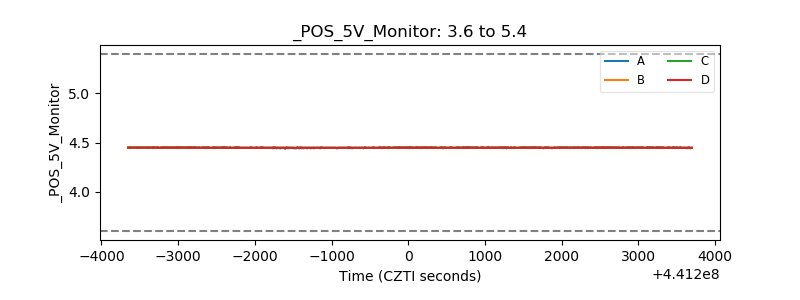 |
| _ROLL_ROT | 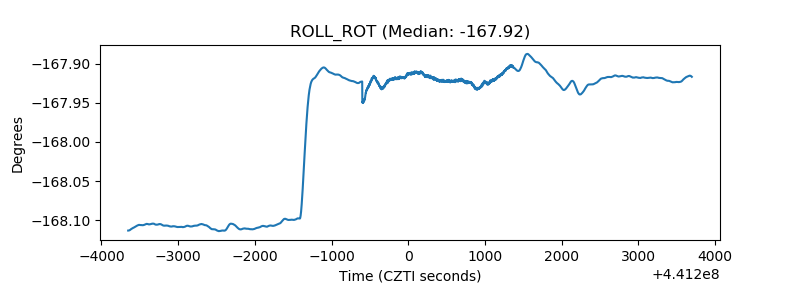 |
| _Roll_DEC | 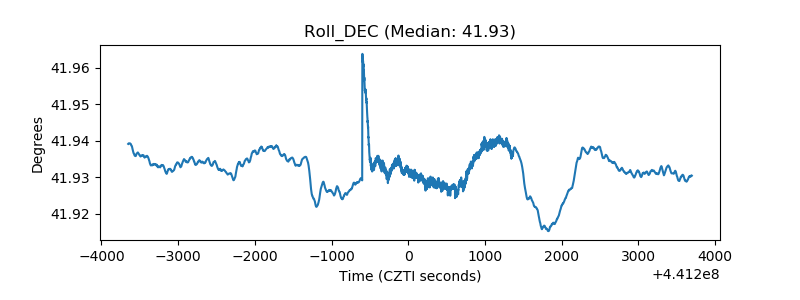 |
| _Roll_RA | 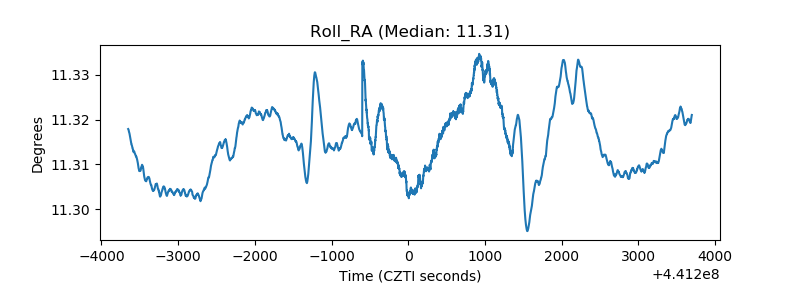 |
| Veto Counter | 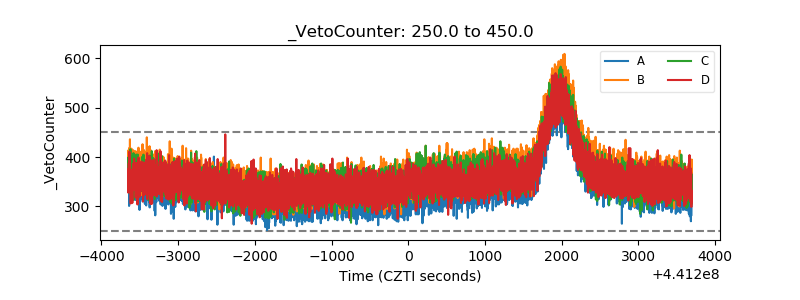 |