| Param | Original file | Final file |
|---|---|---|
| Filename | modeM0/AS1A13_003T01_9000006002_44570cztM0_level2.fits | modeM0/AS1A13_003T01_9000006002_44570cztM0_level2_quad_clean.evt |
| Size (bytes) | 537,756,480 | 108,120,960 |
| Size | 512.8 MB | 103.1 MB |
| Events in quadrant A | 5,032,893 | 742,805 |
| Events in quadrant B | 3,248,970 | 762,970 |
| Events in quadrant C | 5,054,882 | 697,492 |
| Events in quadrant D | 6,029,477 | 585,669 |
| Mode M9 | |||
|---|---|---|---|
| Quadrant | BADHDUFLAG | Total packets | Discarded packets |
| A | 0 | 8 | 0 |
| B | 0 | 8 | 0 |
| C | 0 | 8 | 0 |
| D | 0 | 8 | 0 |
| Mode SS | |||
|---|---|---|---|
| Quadrant | BADHDUFLAG | Total packets | Discarded packets |
| A | 0 | 142 | 0 |
| B | 0 | 142 | 0 |
| C | 0 | 142 | 0 |
| D | 0 | 142 | 0 |
| Mode M0 | |||
|---|---|---|---|
| Quadrant | BADHDUFLAG | Total packets | Discarded packets |
| A | 0 | 20730 | 2 |
| B | 0 | 14558 | 2 |
| C | 0 | 19695 | 2 |
| D | 0 | 22619 | 3 |
| Quadrant | Total seconds | Saturated seconds | Saturation percentage |
|---|---|---|---|
| A | 6951 | 97 | 1.395483% |
| B | 6952 | 45 | 0.647296% |
| C | 6952 | 454 | 6.530495% |
| D | 6951 | 1065 | 15.321536% |
Noise dominated data is calculated using 1-second bins in cleaned event files. If a bin has >2000 counts, and if more than 50% of those come from <1% of pixels, then it is considered to be noise-dominated and hence unusable.
| Quadrant | # 1 sec bins | Bins with >0 counts | Bins with >2000 counts | High rate bins dominated by noise | Noise dominated (total time) | Noise dominated (detector-on time) | Marked lightcurve |
|---|---|---|---|---|---|---|---|
| A | 7816 | 6952 | 22 | 22 | 0.28% | 0.32% | 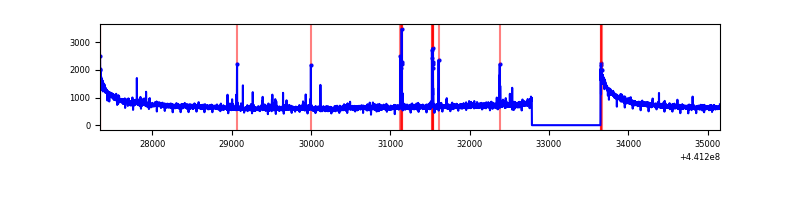 |
| B | 7817 | 6953 | 20 | 20 | 0.26% | 0.29% | 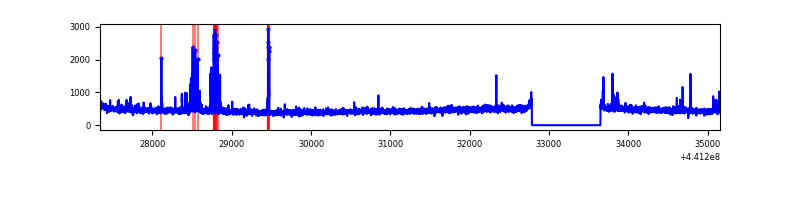 |
| C | 7817 | 6953 | 415 | 415 | 5.31% | 5.97% | 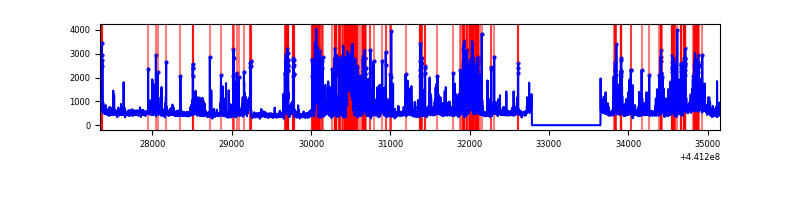 |
| D | 7816 | 6952 | 719 | 719 | 9.20% | 10.34% | 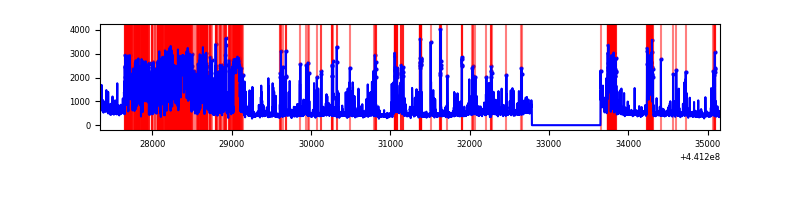 |
Top three noisy pixels from each quadrant. If the there are fewer than three noisy pixels in the level2.evt file, extra rows are filled as -1
| Pixel properties | Quadrant properties | ||||||
|---|---|---|---|---|---|---|---|
| Quadrant | DetID | PixID | Counts | Sigma | Mean | Median | Sigma |
| A | 10 | 83 | 1968878 | 12248.55 | 770 | 754 | 160.7 |
| A | 13 | 248 | 76119 | 469.03 | 770 | 754 | 160.7 |
| A | 7 | 3 | 10526 | 60.82 | 770 | 754 | 160.7 |
| B | 5 | 235 | 172890 | 1130.71 | 766 | 741 | 152.2 |
| B | 5 | 172 | 23802 | 151.47 | 766 | 741 | 152.2 |
| B | 12 | 111 | 19356 | 122.26 | 766 | 741 | 152.2 |
| C | 15 | 208 | 1459898 | 8388.37 | 739 | 743 | 173.9 |
| C | 14 | 254 | 504461 | 2895.77 | 739 | 743 | 173.9 |
| C | 2 | 14 | 100438 | 573.13 | 739 | 743 | 173.9 |
| D | 1 | 52 | 1348853 | 7578.52 | 698 | 676 | 177.9 |
| D | 2 | 249 | 958747 | 5385.61 | 698 | 676 | 177.9 |
| D | 13 | 249 | 431704 | 2422.94 | 698 | 676 | 177.9 |
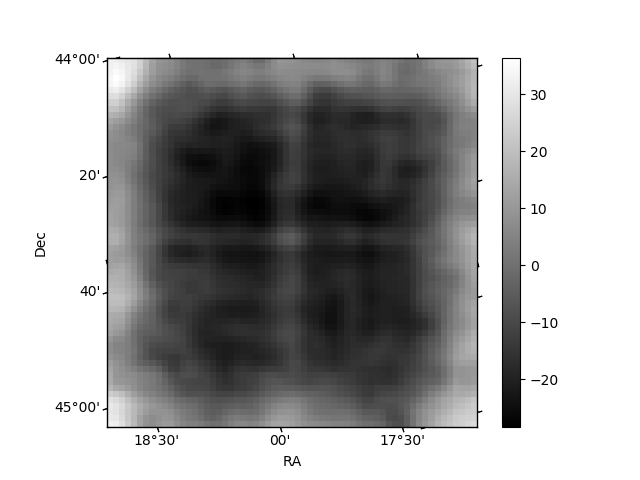
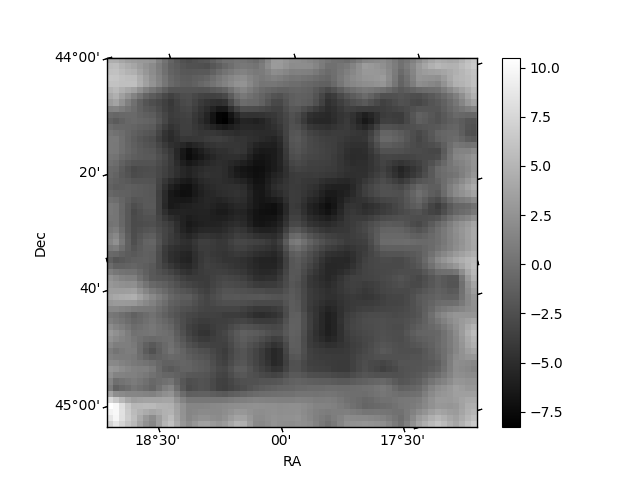
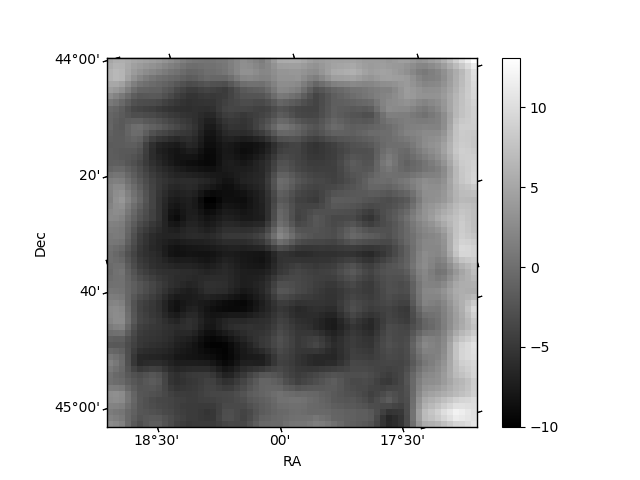
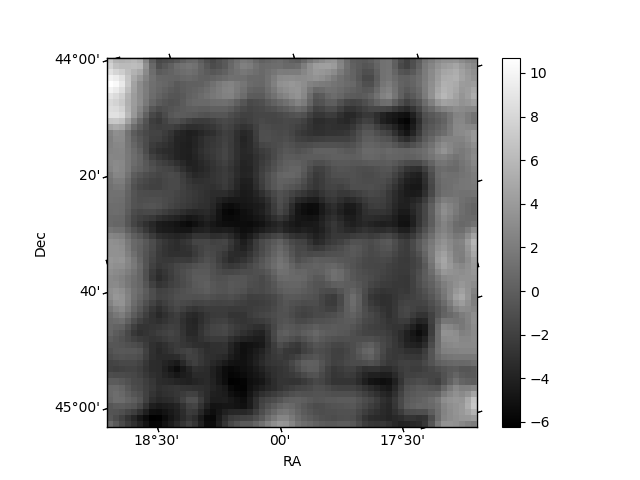
Histogram calculated using DETX and DETY for each event in the final _common_clean file
| Quadrant A | 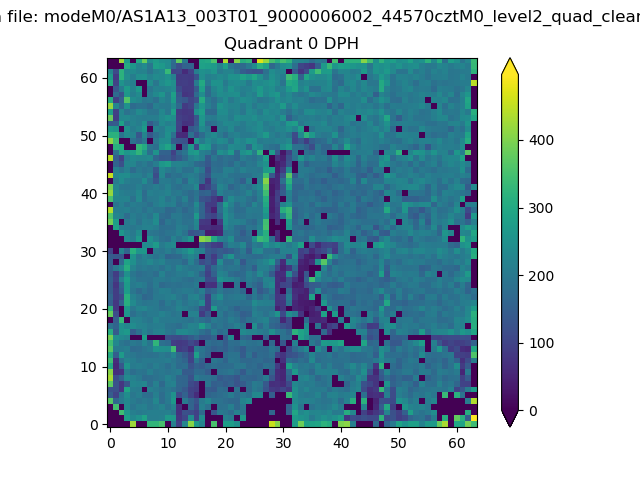 |
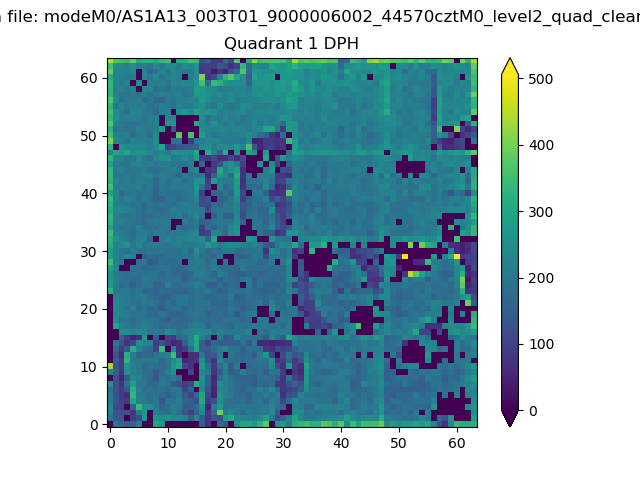 |
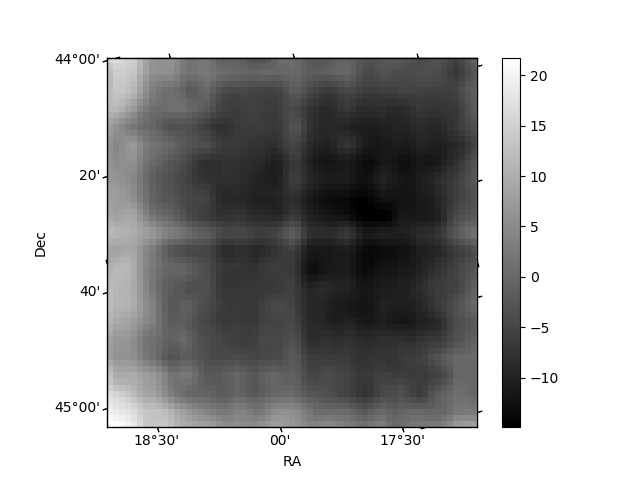
Quadrant B |
|---|---|---|---|
| Quadrant D | 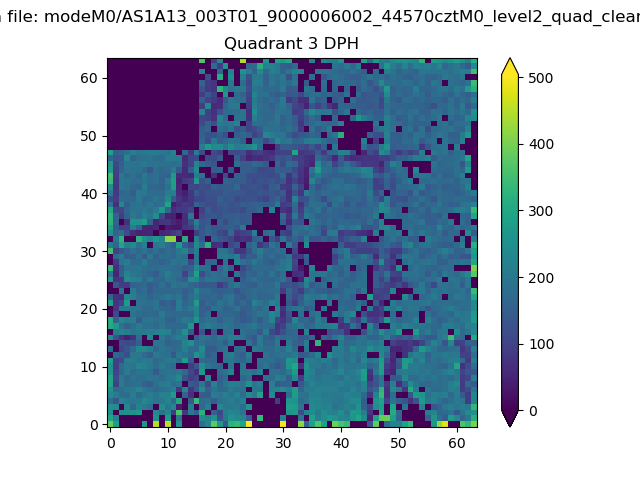 |
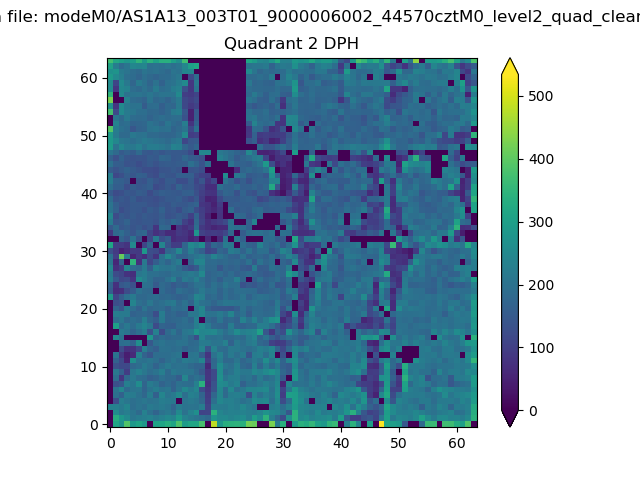 |
Quadrant C |
| Plot type | Count rate plots | Images |
|---|---|---|
| Comparison with Poisson distribution Blue bars denote a histogram of data divided into 1 sec bins. Red curve is a Poisson curve with rate = median count rate of data. |
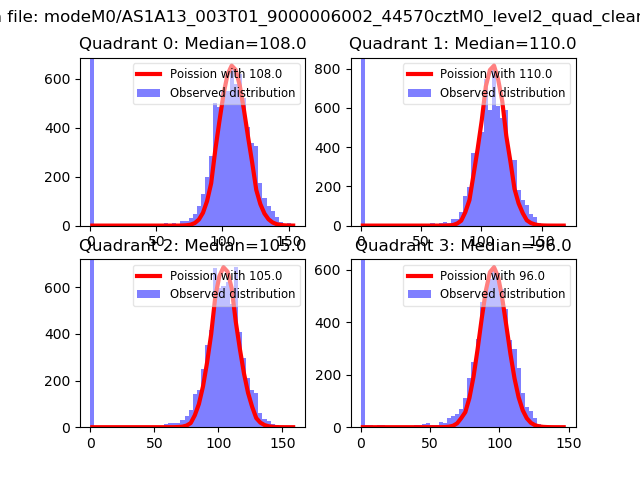 |
 |
| Quadrant-wise count rates Data is divided into 100 sec bins |
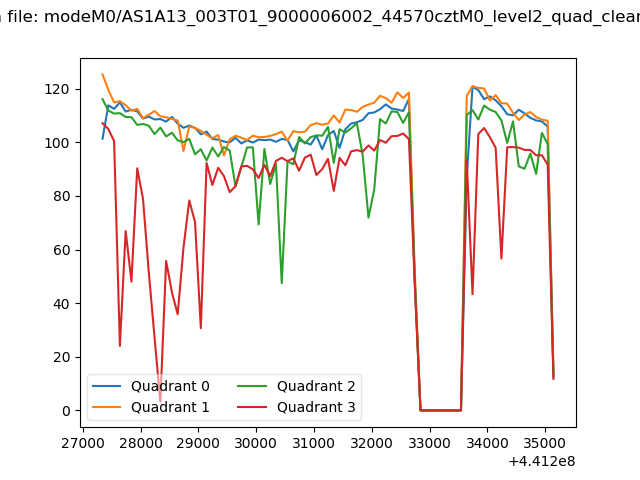 |
|
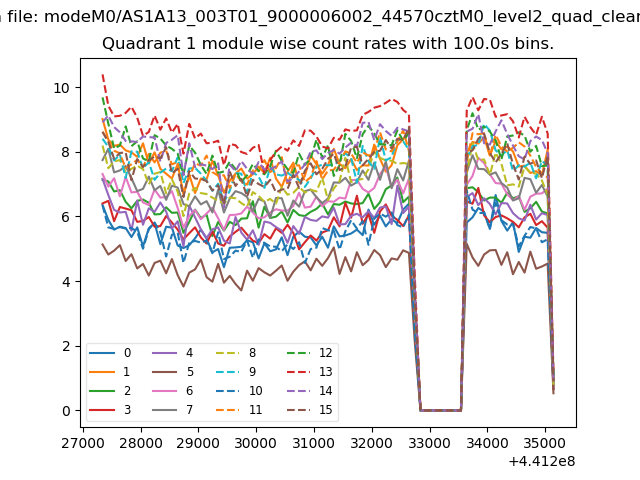
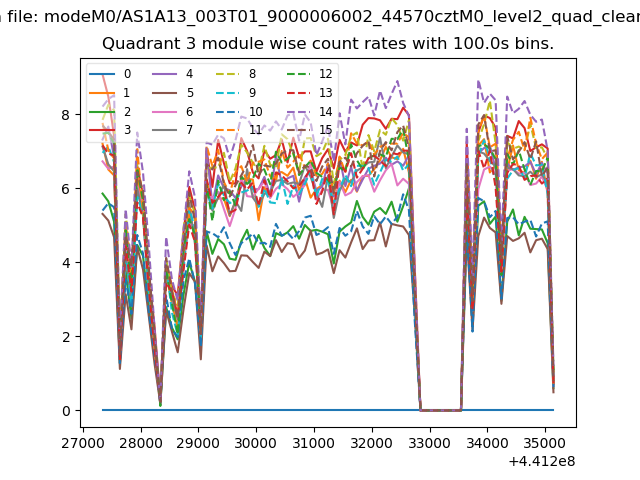
| Module-wise count rates for Quadrant A Data is divided into 100 sec bins |
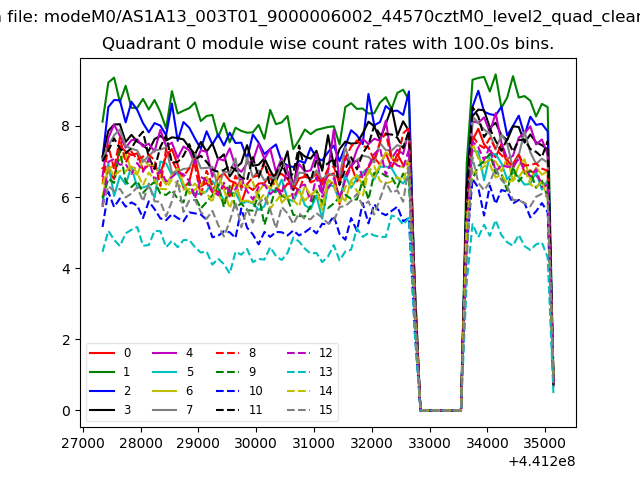 |
 |
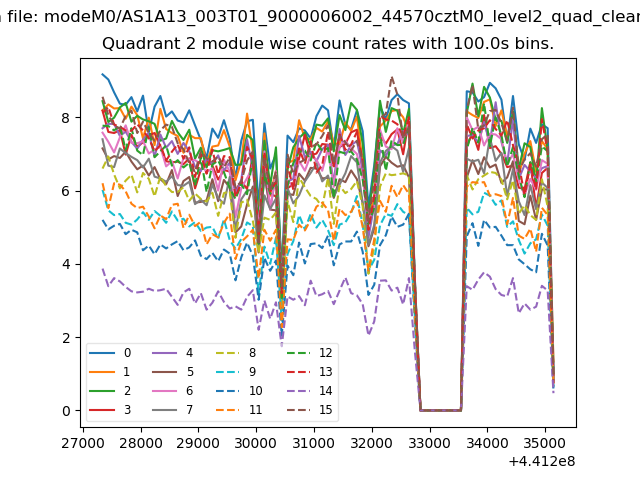
| Module-wise count rates for Quadrant B Data is divided into 100 sec bins |
 |
 |
| Module-wise count rates for Quadrant C Data is divided into 100 sec bins |
 |
 |
| Module-wise count rates for Quadrant D Data is divided into 100 sec bins |
 |
 |
| Parameter | Plot |
|---|---|
| CZT HV Monitor | 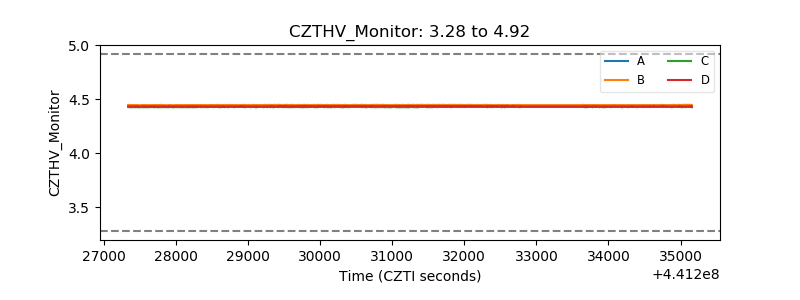 |
| D_VDD | 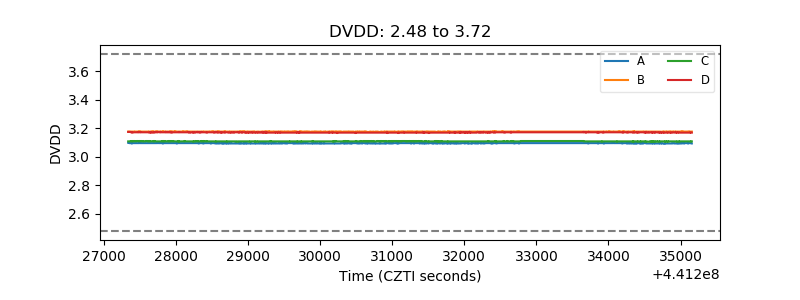 |
| Temperature 1 | 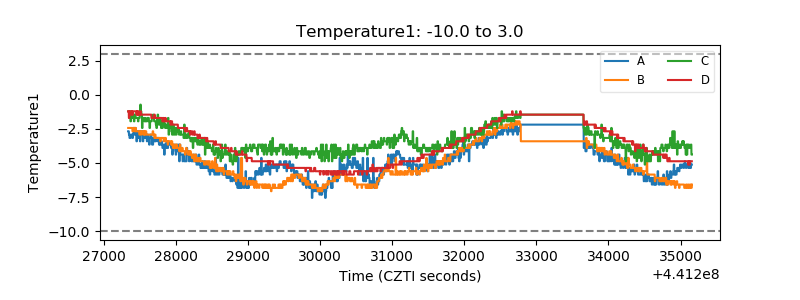 |
| Veto HV Monitor | 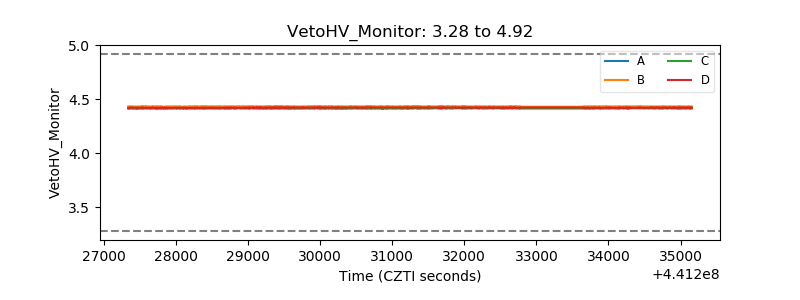 |
| Veto LLD | 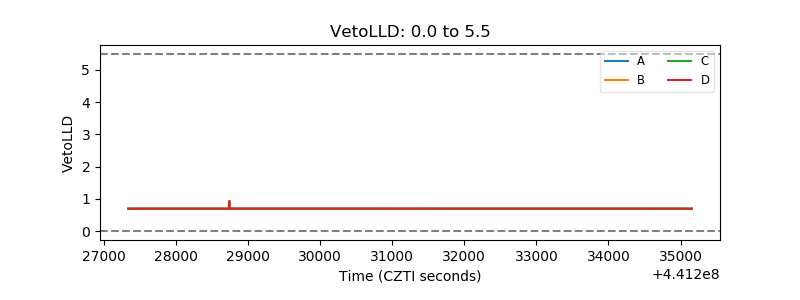 |
| Alpha Counter | 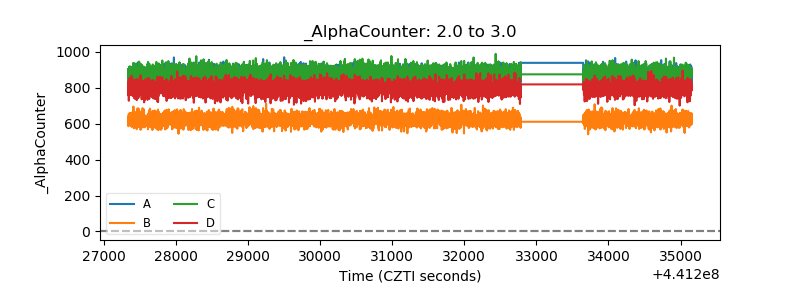 |
| _CPM_Rate | 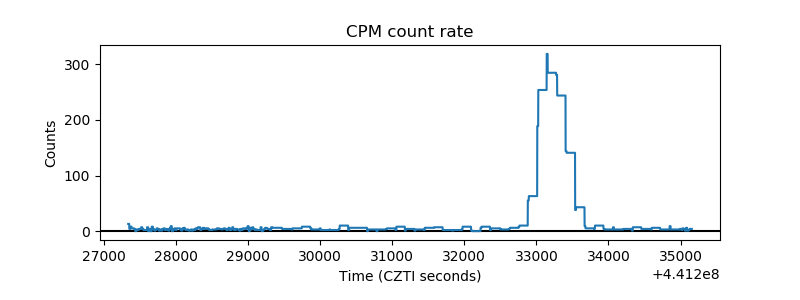 |
| CZT Counter | 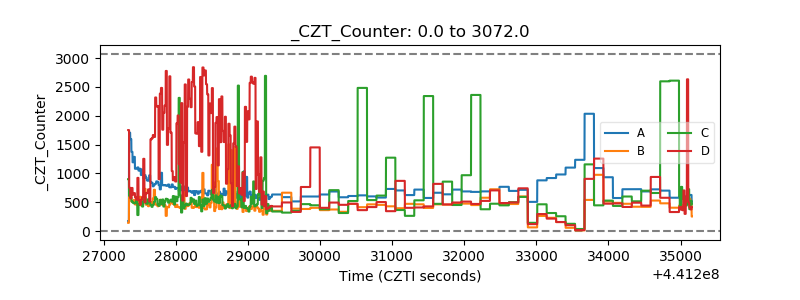 |
| +2.5 Volts monitor | 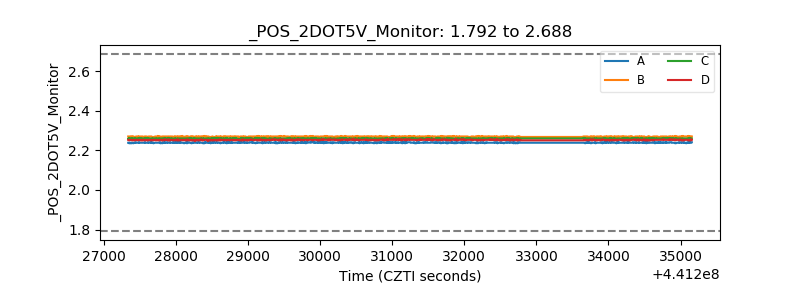 |
| +5 Volts monitor | 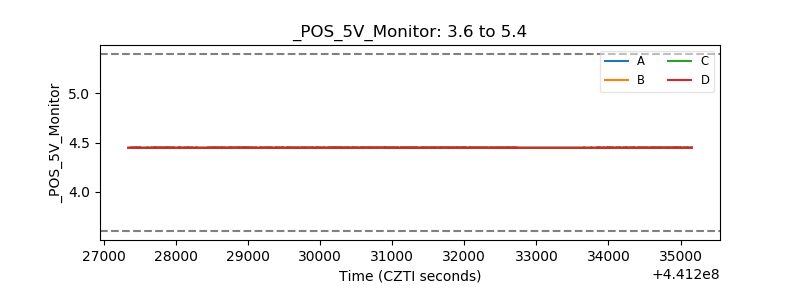 |
| _ROLL_ROT | 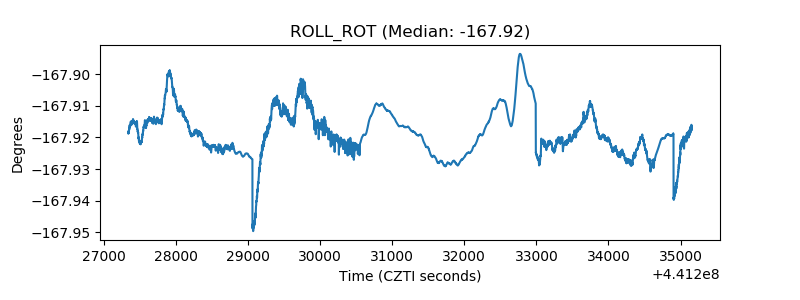 |
| _Roll_DEC | 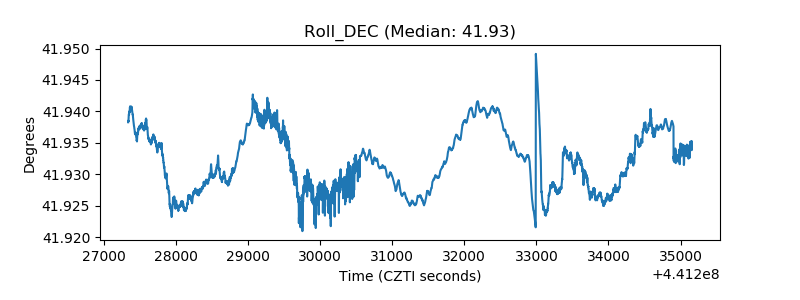 |
| _Roll_RA | 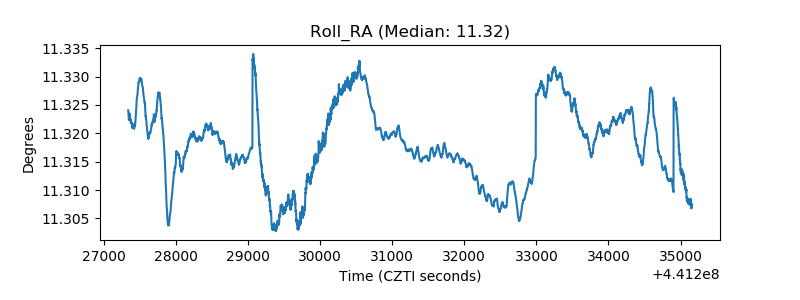 |
| Veto Counter |  |