| Param | Original file | Final file |
|---|---|---|
| Filename | modeM0/AS1A13_003T01_9000006002_44571cztM0_level2.fits | modeM0/AS1A13_003T01_9000006002_44571cztM0_level2_quad_clean.evt |
| Size (bytes) | 461,678,400 | 110,727,360 |
| Size | 440.3 MB | 105.6 MB |
| Events in quadrant A | 5,166,754 | 736,985 |
| Events in quadrant B | 3,182,145 | 763,888 |
| Events in quadrant C | 4,175,539 | 721,384 |
| Events in quadrant D | 4,035,640 | 654,825 |
| Mode M9 | |||
|---|---|---|---|
| Quadrant | BADHDUFLAG | Total packets | Discarded packets |
| A | 0 | 18 | 0 |
| B | 0 | 18 | 0 |
| C | 0 | 18 | 0 |
| D | 0 | 18 | 0 |
| Mode SS | |||
|---|---|---|---|
| Quadrant | BADHDUFLAG | Total packets | Discarded packets |
| A | 0 | 142 | 0 |
| B | 0 | 142 | 0 |
| C | 0 | 142 | 0 |
| D | 0 | 142 | 0 |
| Mode M0 | |||
|---|---|---|---|
| Quadrant | BADHDUFLAG | Total packets | Discarded packets |
| A | 0 | 21032 | 2 |
| B | 0 | 14166 | 8 |
| C | 0 | 17146 | 2 |
| D | 0 | 16918 | 2 |
| Quadrant | Total seconds | Saturated seconds | Saturation percentage |
|---|---|---|---|
| A | 6819 | 153 | 2.243731% |
| B | 6819 | 24 | 0.351958% |
| C | 6819 | 174 | 2.551694% |
| D | 6819 | 238 | 3.490248% |
Noise dominated data is calculated using 1-second bins in cleaned event files. If a bin has >2000 counts, and if more than 50% of those come from <1% of pixels, then it is considered to be noise-dominated and hence unusable.
| Quadrant | # 1 sec bins | Bins with >0 counts | Bins with >2000 counts | High rate bins dominated by noise | Noise dominated (total time) | Noise dominated (detector-on time) | Marked lightcurve |
|---|---|---|---|---|---|---|---|
| A | 8719 | 6821 | 65 | 65 | 0.75% | 0.95% | 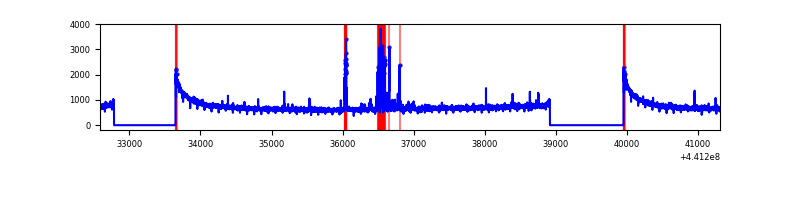 |
| B | 8719 | 6821 | 2 | 2 | 0.02% | 0.03% | 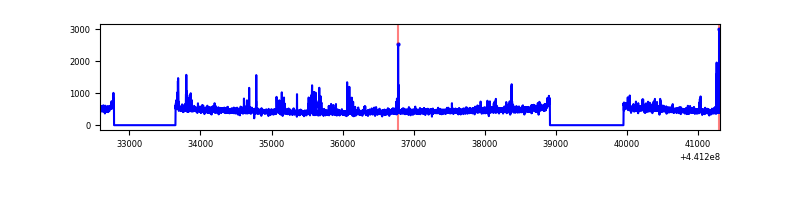 |
| C | 8719 | 6821 | 142 | 142 | 1.63% | 2.08% | 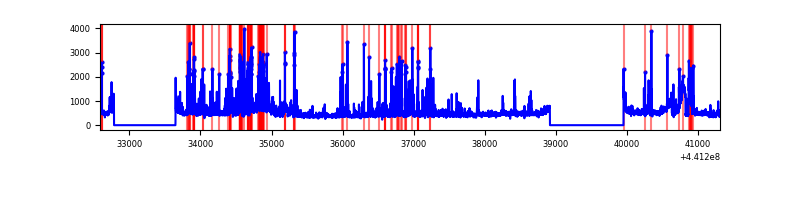 |
| D | 8719 | 6821 | 187 | 187 | 2.14% | 2.74% | 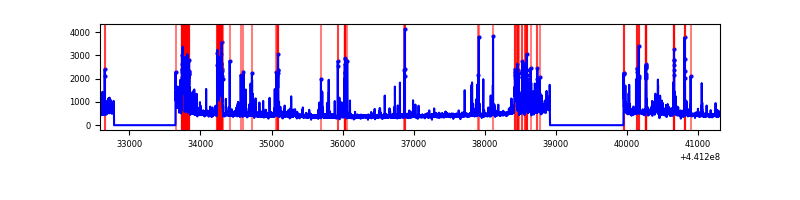 |
Top three noisy pixels from each quadrant. If the there are fewer than three noisy pixels in the level2.evt file, extra rows are filled as -1
| Pixel properties | Quadrant properties | ||||||
|---|---|---|---|---|---|---|---|
| Quadrant | DetID | PixID | Counts | Sigma | Mean | Median | Sigma |
| A | 10 | 83 | 1973514 | 12356.72 | 763 | 749 | 159.7 |
| A | 13 | 248 | 225434 | 1407.35 | 763 | 749 | 159.7 |
| A | 8 | 205 | 11879 | 69.71 | 763 | 749 | 159.7 |
| B | 5 | 235 | 124505 | 818.06 | 763 | 738 | 151.3 |
| B | 5 | 172 | 19569 | 124.47 | 763 | 738 | 151.3 |
| B | 12 | 111 | 19149 | 121.69 | 763 | 738 | 151.3 |
| C | 14 | 254 | 582599 | 3305.56 | 749 | 753 | 176.0 |
| C | 15 | 208 | 484929 | 2750.68 | 749 | 753 | 176.0 |
| C | 2 | 14 | 101419 | 571.9 | 749 | 753 | 176.0 |
| D | 13 | 174 | 384905 | 2058.48 | 743 | 719 | 186.6 |
| D | 2 | 249 | 378224 | 2022.68 | 743 | 719 | 186.6 |
| D | 1 | 52 | 182944 | 976.36 | 743 | 719 | 186.6 |
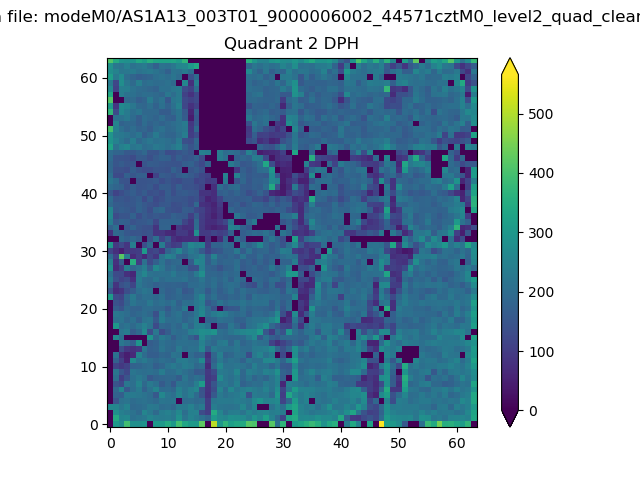
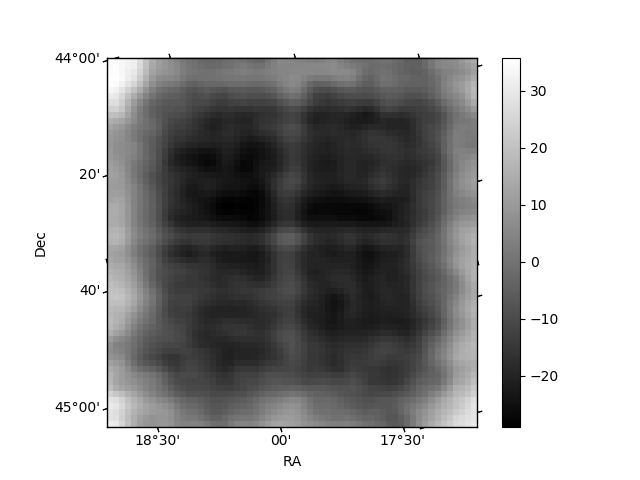
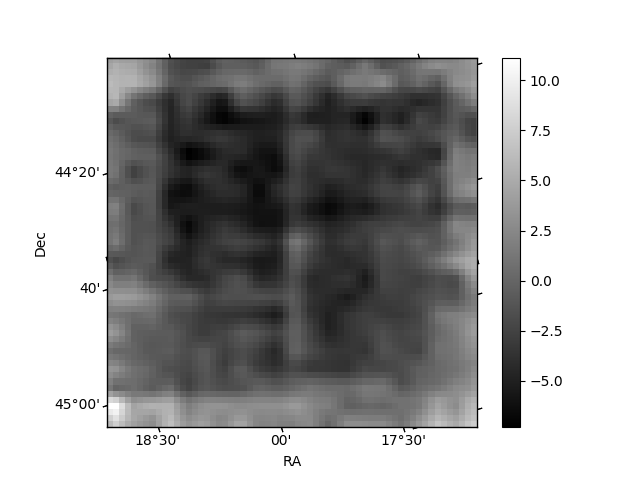
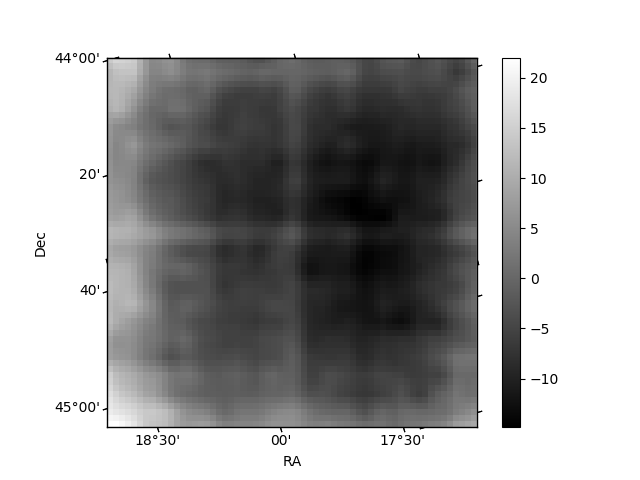
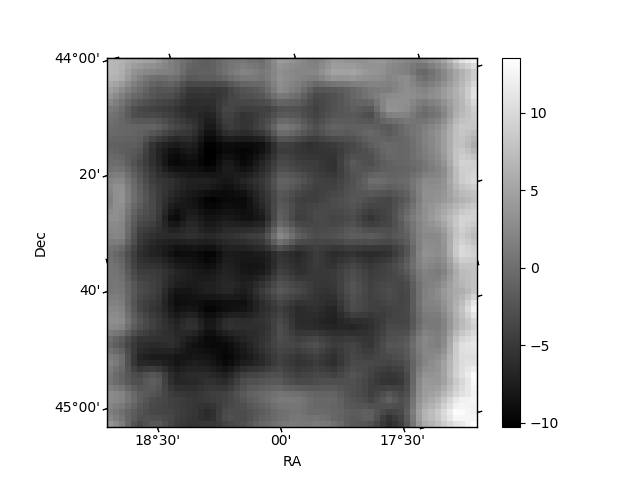
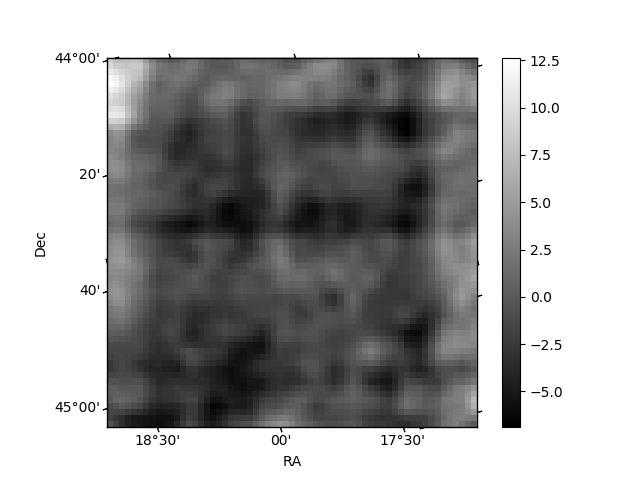
Histogram calculated using DETX and DETY for each event in the final _common_clean file
| Quadrant A | 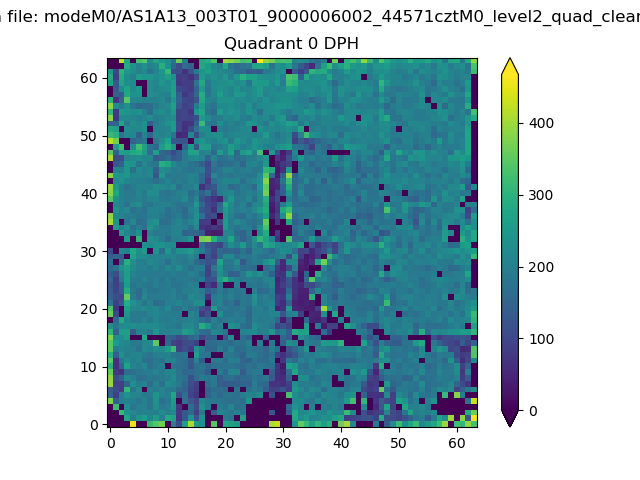 |
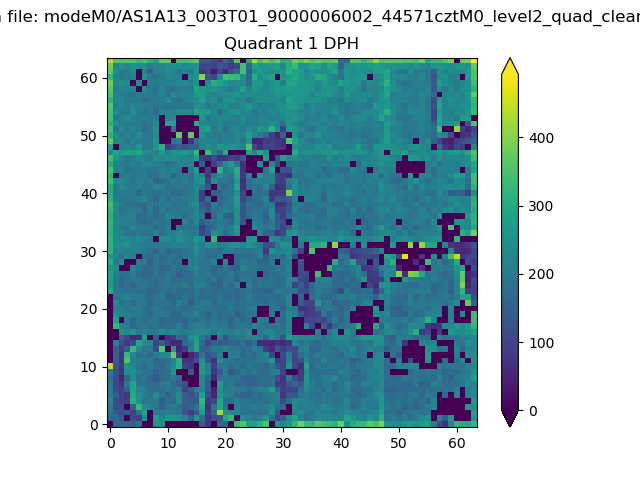 |
Quadrant B |
|---|---|---|---|
| Quadrant D | 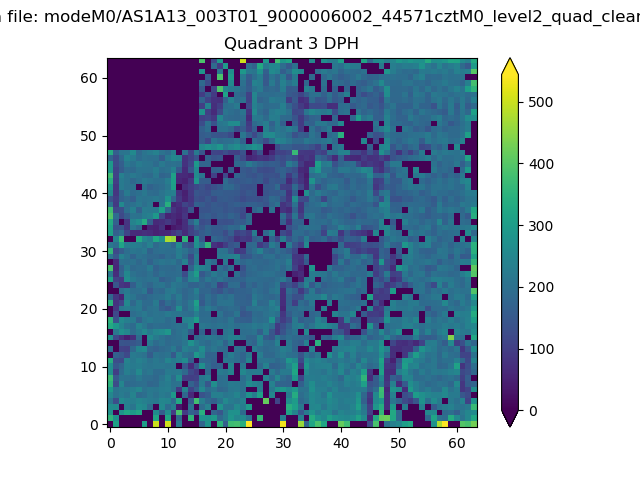 |
 |
Quadrant C |
| Plot type | Count rate plots | Images |
|---|---|---|
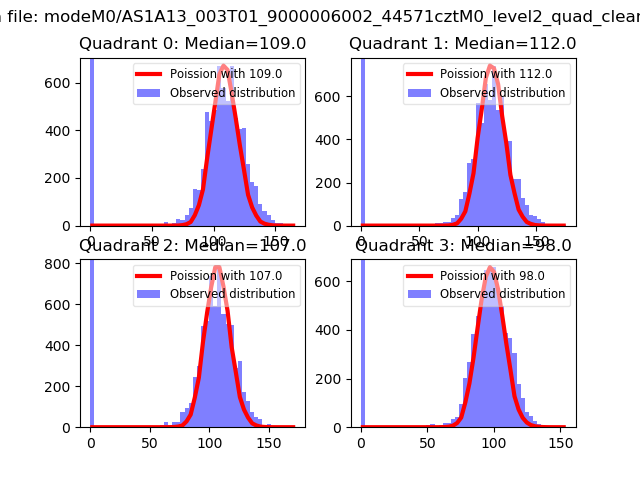
| Comparison with Poisson distribution Blue bars denote a histogram of data divided into 1 sec bins. Red curve is a Poisson curve with rate = median count rate of data. |
 |
 |
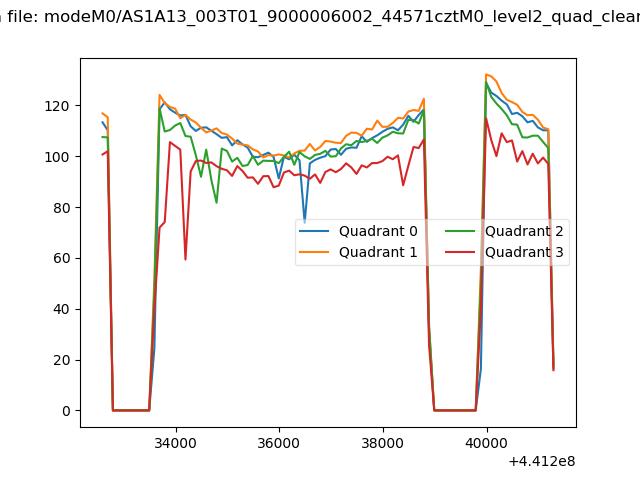
| Quadrant-wise count rates Data is divided into 100 sec bins |
 |
|
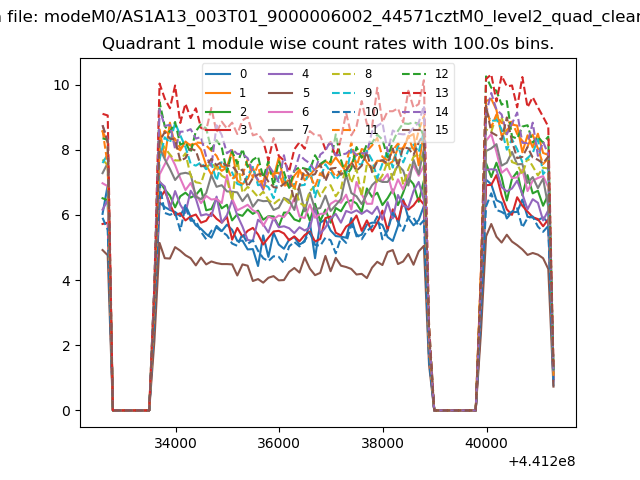
| Module-wise count rates for Quadrant A Data is divided into 100 sec bins |
 |
 |
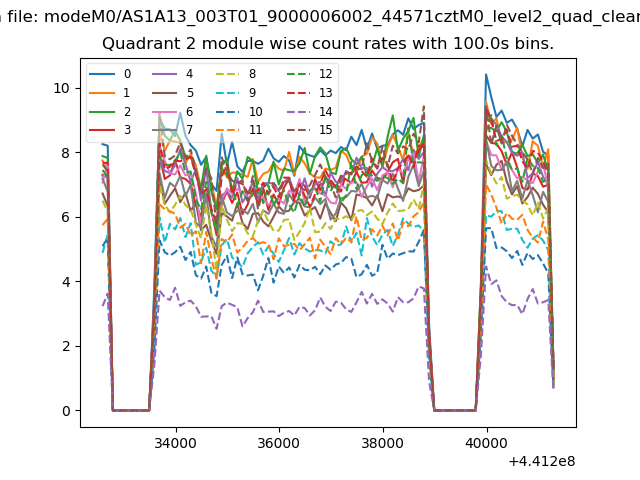
| Module-wise count rates for Quadrant B Data is divided into 100 sec bins |
 |
 |
| Module-wise count rates for Quadrant C Data is divided into 100 sec bins |
 |
 |
| Module-wise count rates for Quadrant D Data is divided into 100 sec bins |
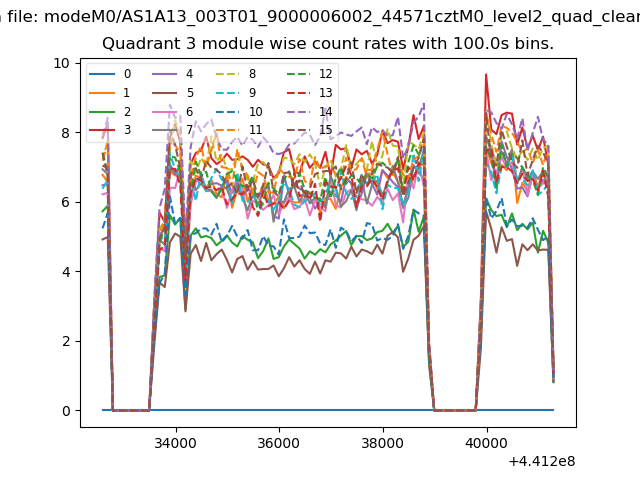 |
 |
| Parameter | Plot |
|---|---|
| CZT HV Monitor |  |
| D_VDD | 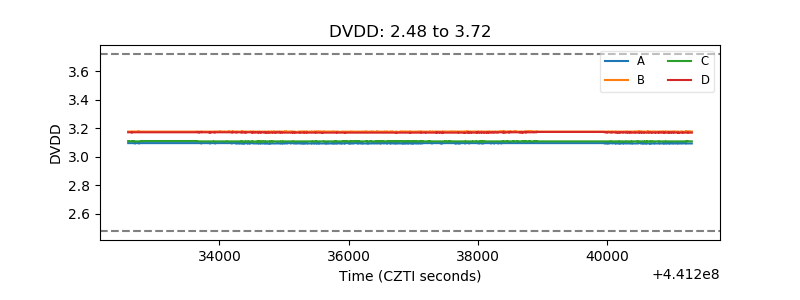 |
| Temperature 1 | 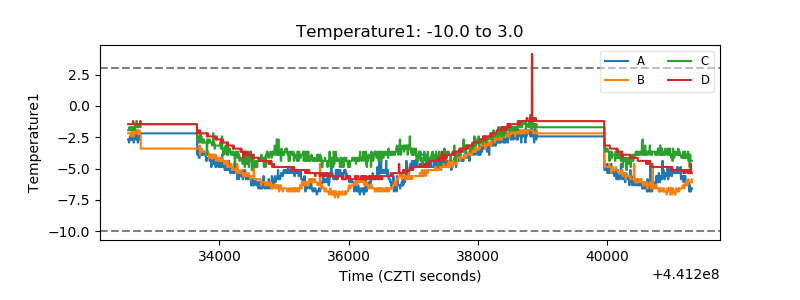 |
| Veto HV Monitor | 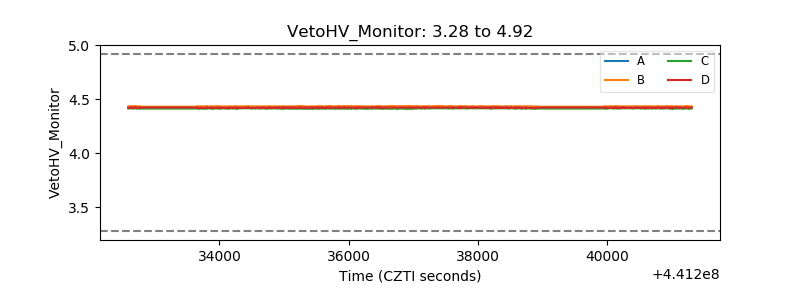 |
| Veto LLD | 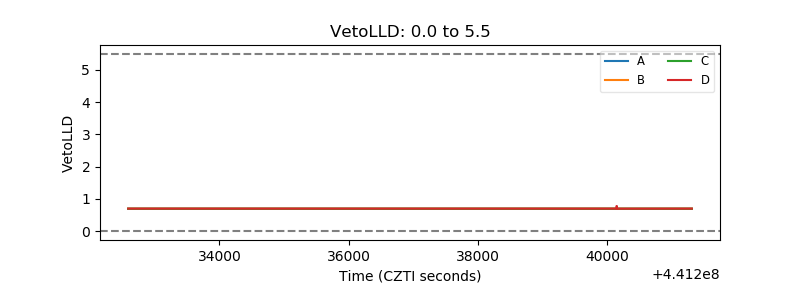 |
| Alpha Counter | 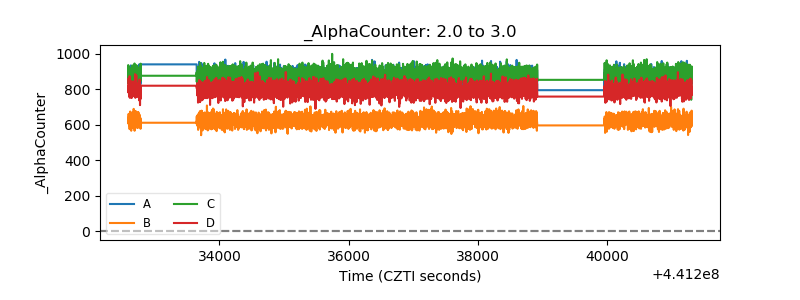 |
| _CPM_Rate | 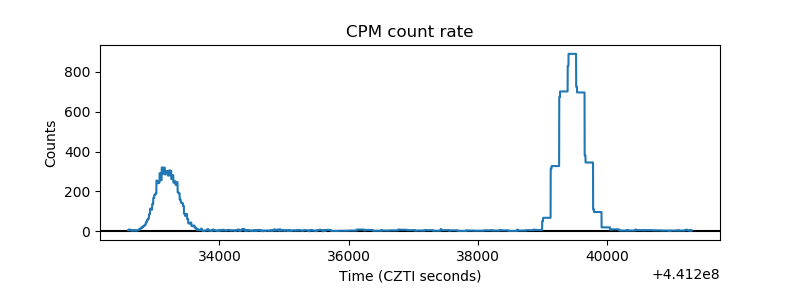 |
| CZT Counter | 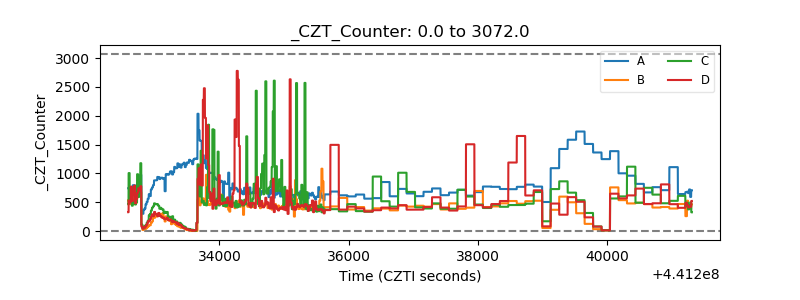 |
| +2.5 Volts monitor | 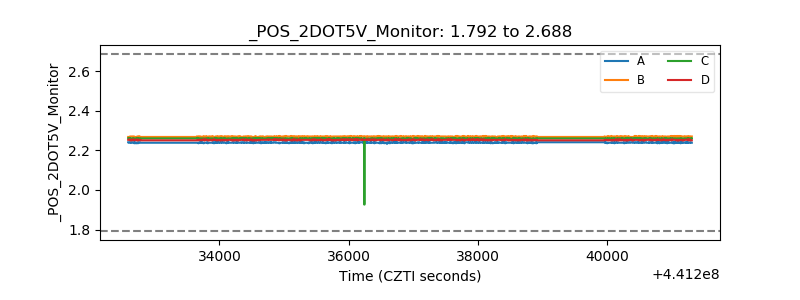 |
| +5 Volts monitor | 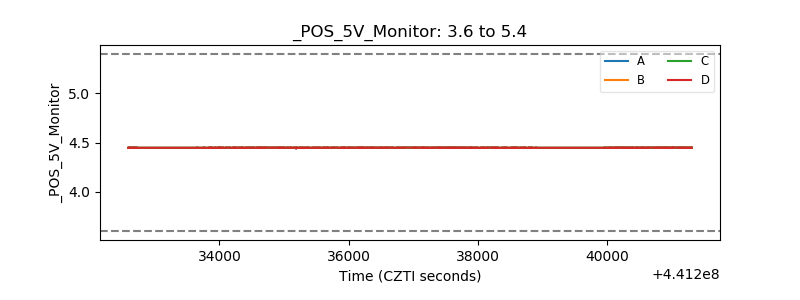 |
| _ROLL_ROT | 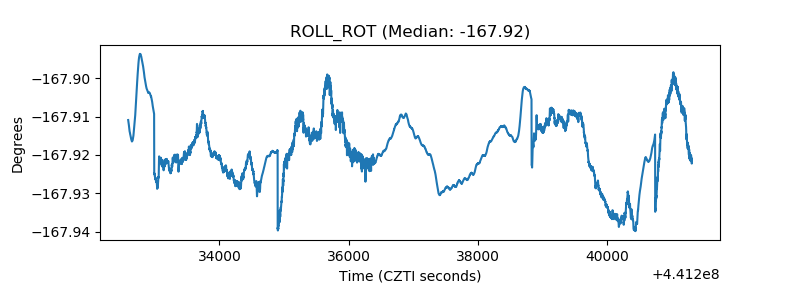 |
| _Roll_DEC | 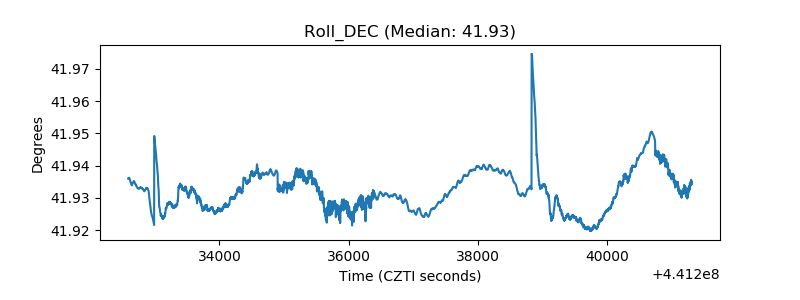 |
| _Roll_RA | 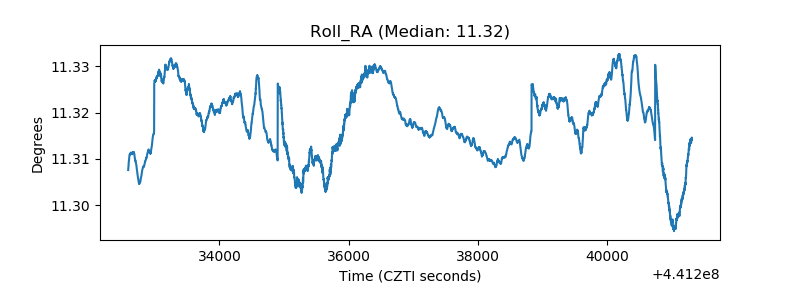 |
| Veto Counter | 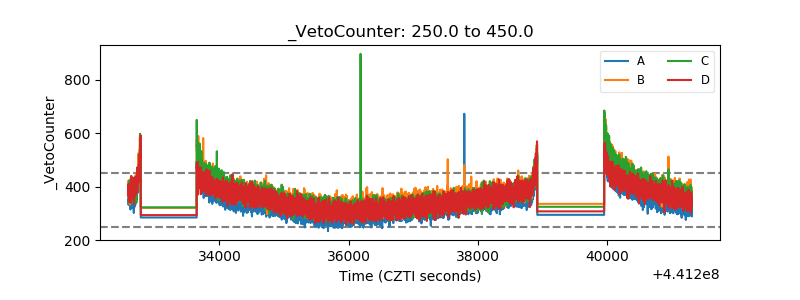 |