| Param | Original file | Final file |
|---|---|---|
| Filename | modeM0/AS1A13_003T01_9000006002_44573cztM0_level2.fits | modeM0/AS1A13_003T01_9000006002_44573cztM0_level2_quad_clean.evt |
| Size (bytes) | 473,904,000 | 112,072,320 |
| Size | 452.0 MB | 106.9 MB |
| Events in quadrant A | 5,089,961 | 746,004 |
| Events in quadrant B | 3,352,853 | 772,305 |
| Events in quadrant C | 4,527,076 | 733,963 |
| Events in quadrant D | 4,052,149 | 674,028 |
| Mode M9 | |||
|---|---|---|---|
| Quadrant | BADHDUFLAG | Total packets | Discarded packets |
| A | 0 | 22 | 0 |
| B | 0 | 22 | 0 |
| C | 0 | 22 | 0 |
| D | 0 | 22 | 0 |
| Mode SS | |||
|---|---|---|---|
| Quadrant | BADHDUFLAG | Total packets | Discarded packets |
| A | 0 | 138 | 0 |
| B | 0 | 138 | 0 |
| C | 0 | 138 | 0 |
| D | 0 | 138 | 0 |
| Mode M0 | |||
|---|---|---|---|
| Quadrant | BADHDUFLAG | Total packets | Discarded packets |
| A | 0 | 20856 | 2 |
| B | 0 | 14566 | 2 |
| C | 0 | 17955 | 2 |
| D | 0 | 16844 | 2 |
| Quadrant | Total seconds | Saturated seconds | Saturation percentage |
|---|---|---|---|
| A | 6704 | 152 | 2.267303% |
| B | 6704 | 106 | 1.581146% |
| C | 6704 | 214 | 3.192124% |
| D | 6704 | 196 | 2.923628% |
Noise dominated data is calculated using 1-second bins in cleaned event files. If a bin has >2000 counts, and if more than 50% of those come from <1% of pixels, then it is considered to be noise-dominated and hence unusable.
| Quadrant | # 1 sec bins | Bins with >0 counts | Bins with >2000 counts | High rate bins dominated by noise | Noise dominated (total time) | Noise dominated (detector-on time) | Marked lightcurve |
|---|---|---|---|---|---|---|---|
| A | 8894 | 6706 | 64 | 64 | 0.72% | 0.95% | 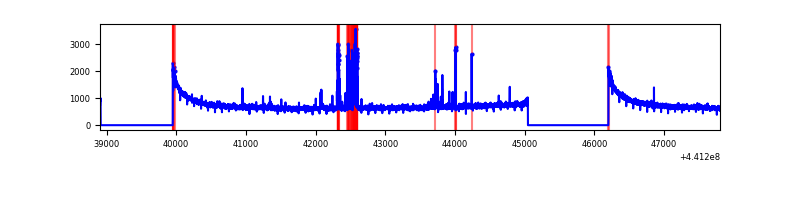 |
| B | 8894 | 6706 | 65 | 65 | 0.73% | 0.97% | 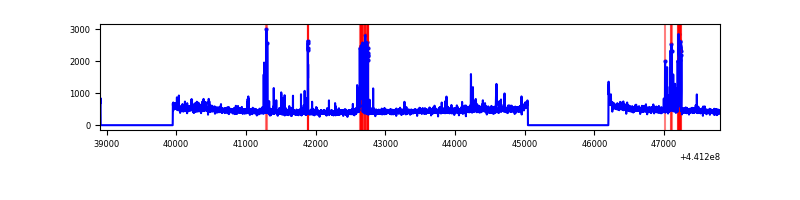 |
| C | 8894 | 6706 | 177 | 177 | 1.99% | 2.64% | 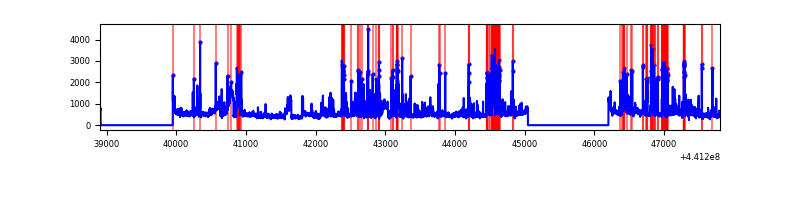 |
| D | 8894 | 6706 | 167 | 167 | 1.88% | 2.49% | 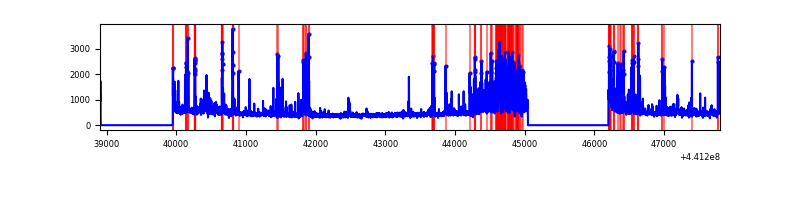 |
Top three noisy pixels from each quadrant. If the there are fewer than three noisy pixels in the level2.evt file, extra rows are filled as -1
| Pixel properties | Quadrant properties | ||||||
|---|---|---|---|---|---|---|---|
| Quadrant | DetID | PixID | Counts | Sigma | Mean | Median | Sigma |
| A | 10 | 83 | 1924691 | 12241.76 | 758 | 740 | 157.2 |
| A | 13 | 248 | 219877 | 1394.33 | 758 | 740 | 157.2 |
| A | 8 | 205 | 11473 | 68.29 | 758 | 740 | 157.2 |
| B | 5 | 172 | 267485 | 1797.76 | 760 | 738 | 148.4 |
| B | 5 | 235 | 61359 | 408.56 | 760 | 738 | 148.4 |
| B | 12 | 111 | 18923 | 122.56 | 760 | 738 | 148.4 |
| C | 15 | 208 | 1075540 | 6156.23 | 743 | 749 | 174.6 |
| C | 14 | 254 | 426494 | 2438.6 | 743 | 749 | 174.6 |
| C | 3 | 233 | 74099 | 420.14 | 743 | 749 | 174.6 |
| D | 1 | 52 | 540877 | 2888.12 | 740 | 718 | 187.0 |
| D | 2 | 249 | 287278 | 1532.18 | 740 | 718 | 187.0 |
| D | 13 | 174 | 148762 | 791.56 | 740 | 718 | 187.0 |
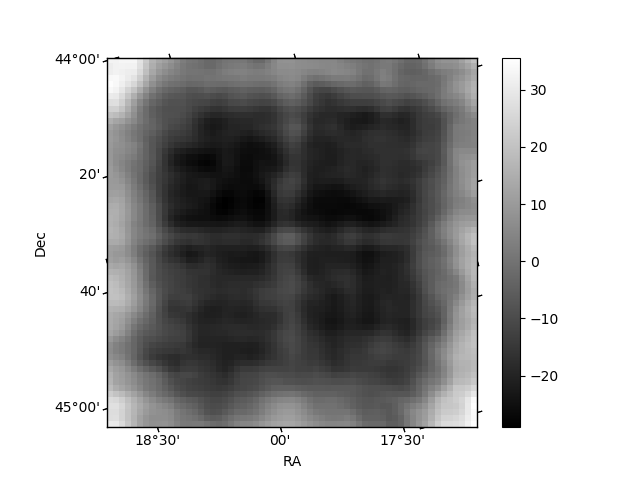
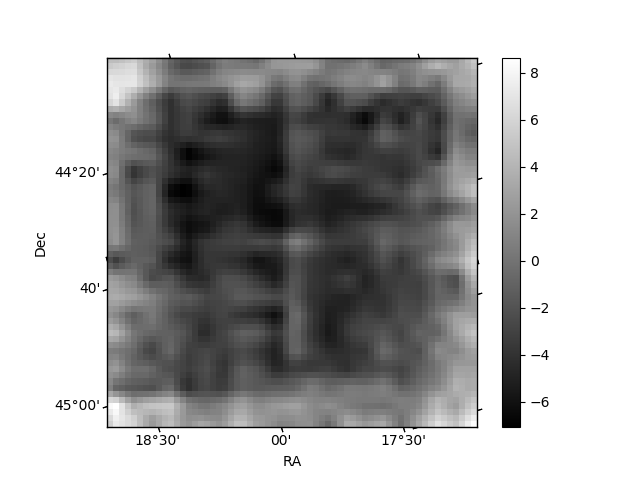
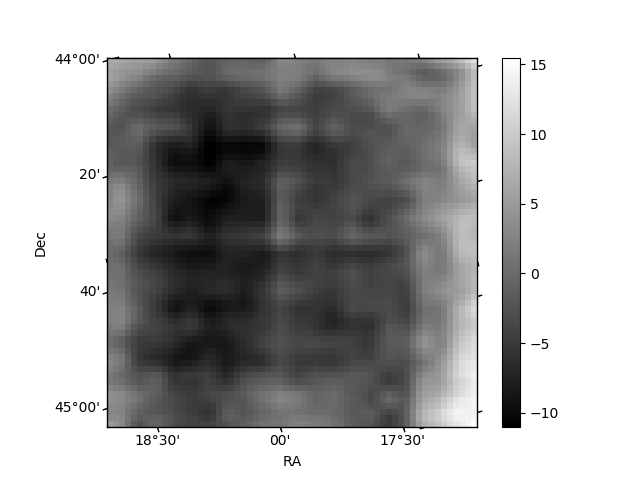
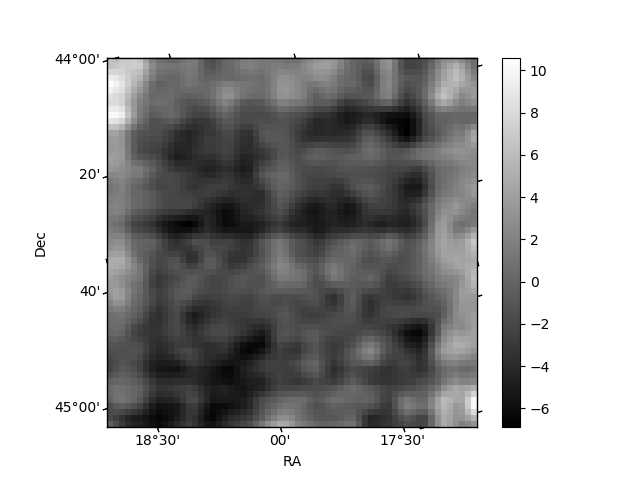
Histogram calculated using DETX and DETY for each event in the final _common_clean file
| Quadrant A | 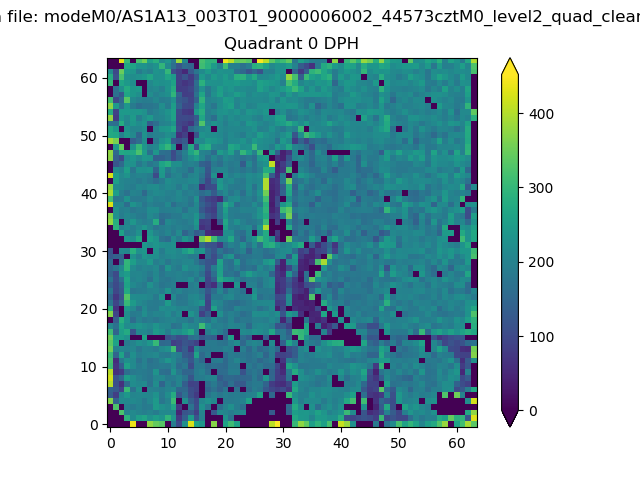 |
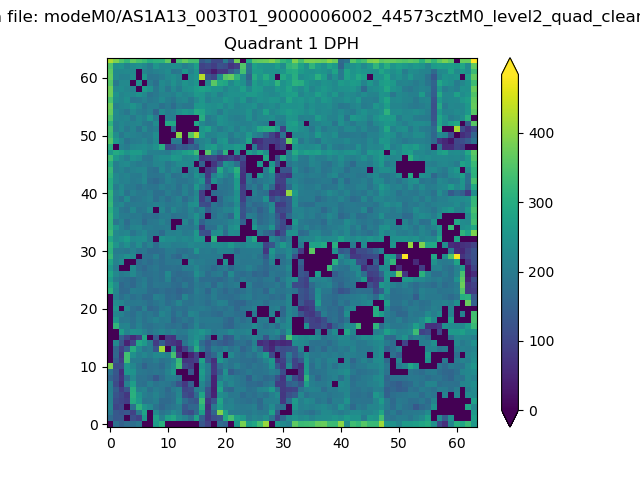 |
Quadrant B |
|---|---|---|---|
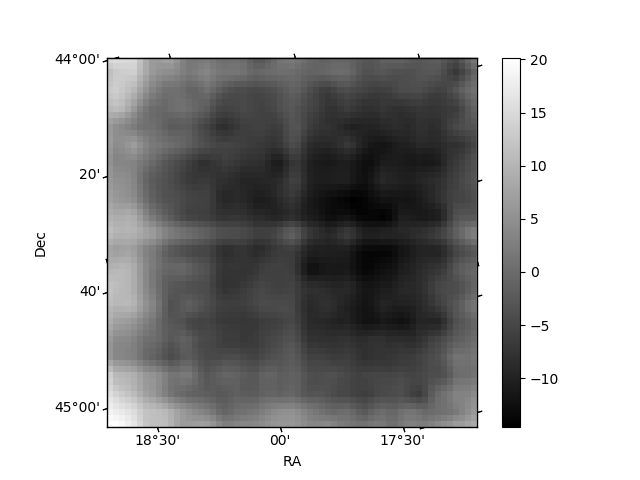
| Quadrant D | 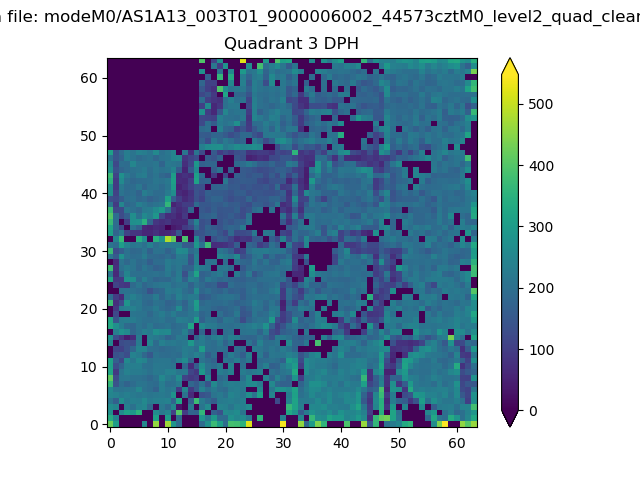 |
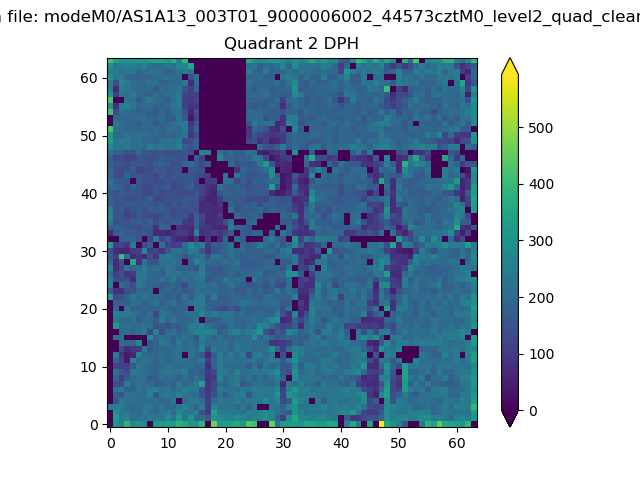 |
Quadrant C |
| Plot type | Count rate plots | Images |
|---|---|---|
| Comparison with Poisson distribution Blue bars denote a histogram of data divided into 1 sec bins. Red curve is a Poisson curve with rate = median count rate of data. |
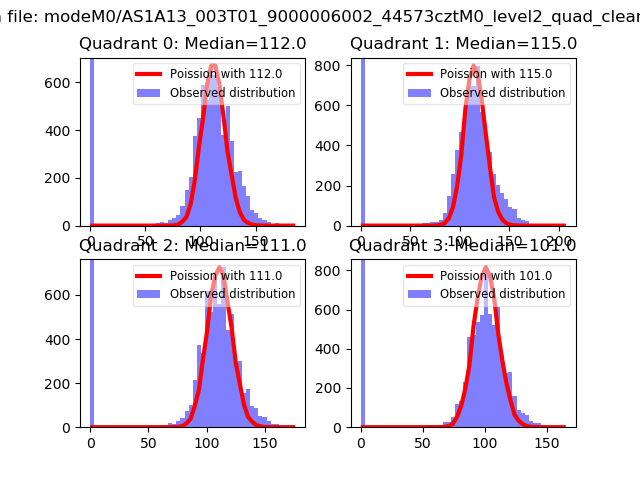 |
 |
| Quadrant-wise count rates Data is divided into 100 sec bins |
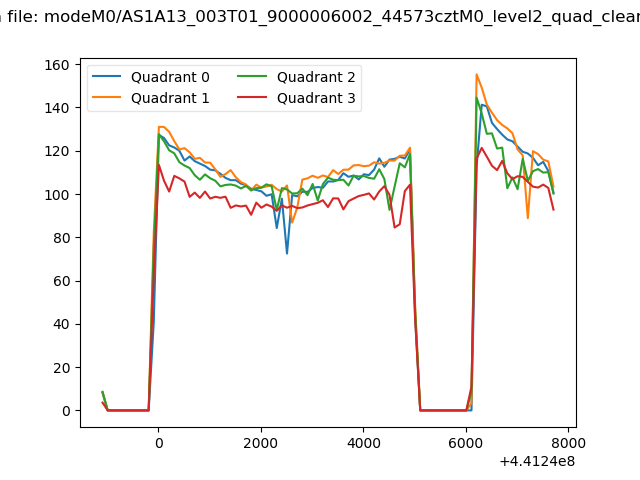 |
|
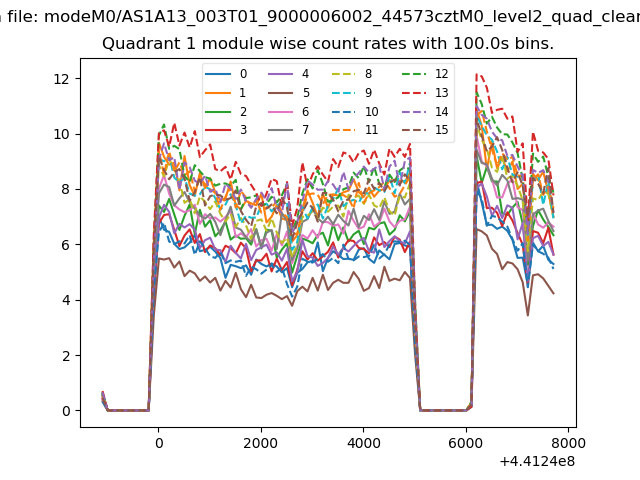
| Module-wise count rates for Quadrant A Data is divided into 100 sec bins |
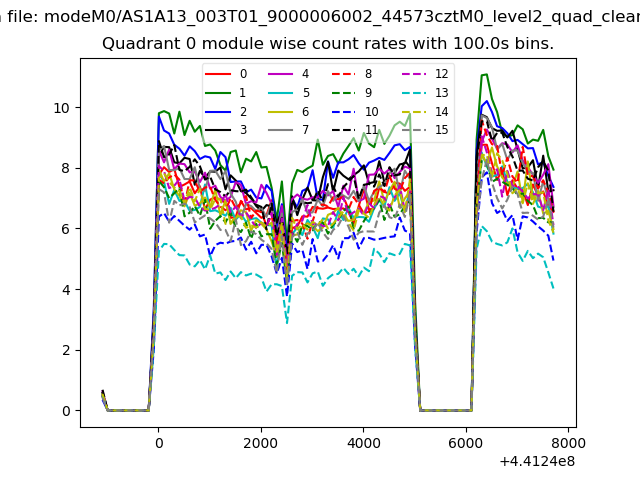 |
 |
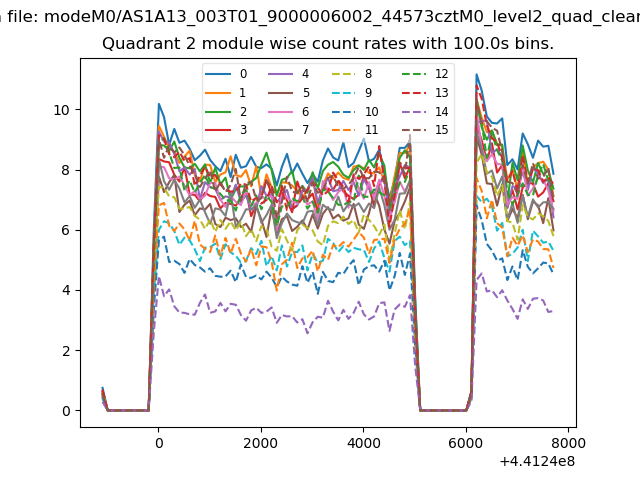
| Module-wise count rates for Quadrant B Data is divided into 100 sec bins |
 |
 |
| Module-wise count rates for Quadrant C Data is divided into 100 sec bins |
 |
 |
| Module-wise count rates for Quadrant D Data is divided into 100 sec bins |
 |
 |
| Parameter | Plot |
|---|---|
| CZT HV Monitor | 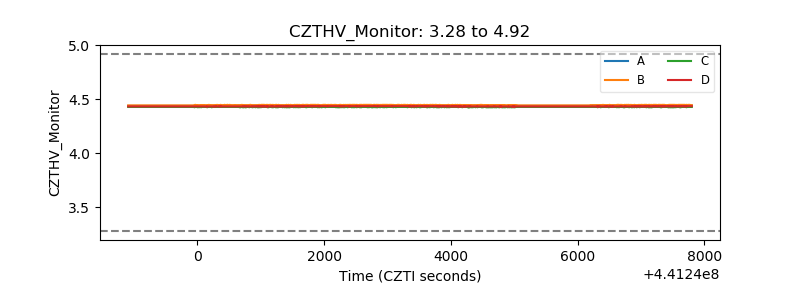 |
| D_VDD | 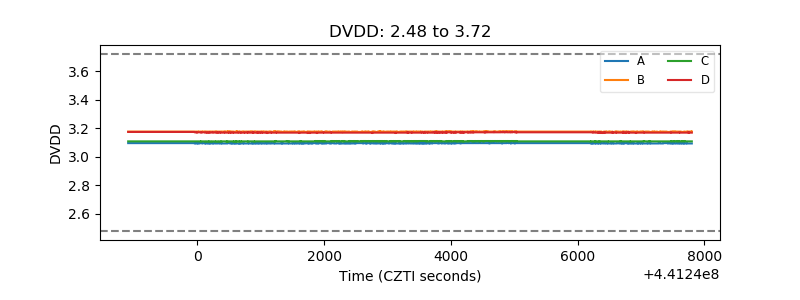 |
| Temperature 1 | 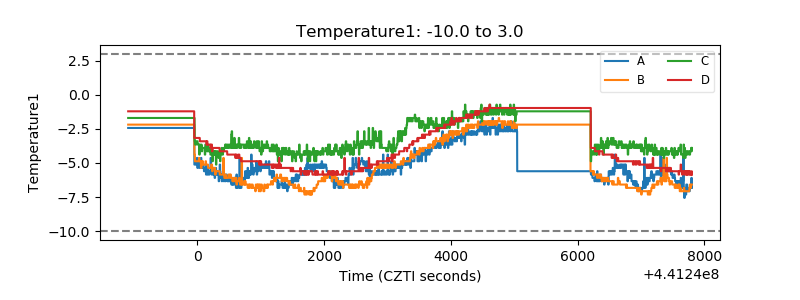 |
| Veto HV Monitor | 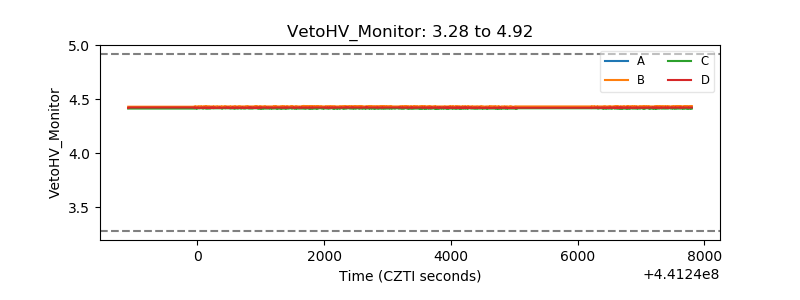 |
| Veto LLD | 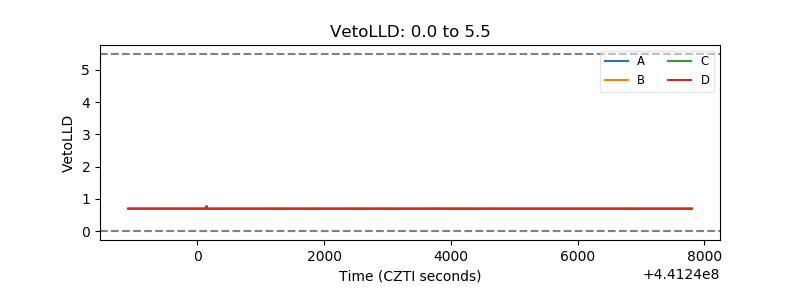 |
| Alpha Counter | 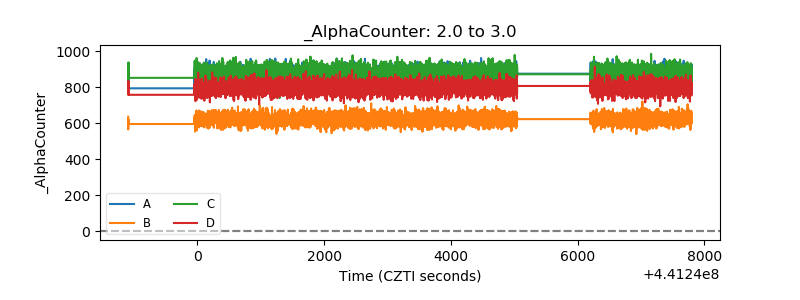 |
| _CPM_Rate | 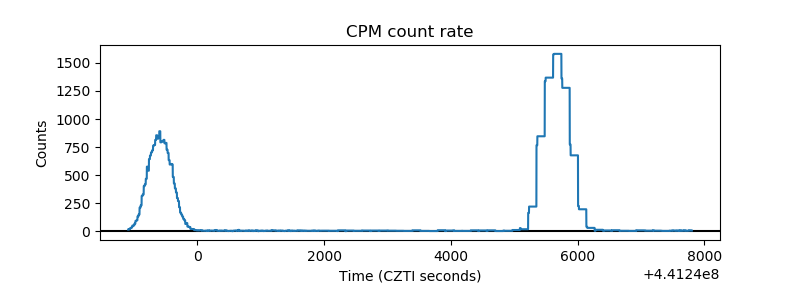 |
| CZT Counter | 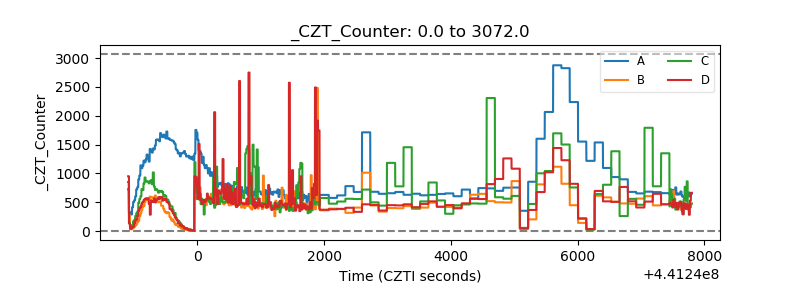 |
| +2.5 Volts monitor | 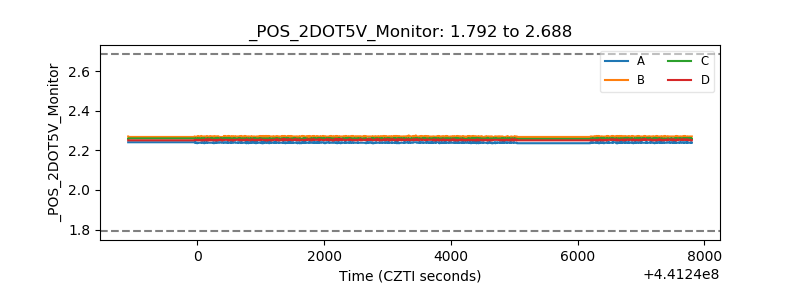 |
| +5 Volts monitor | 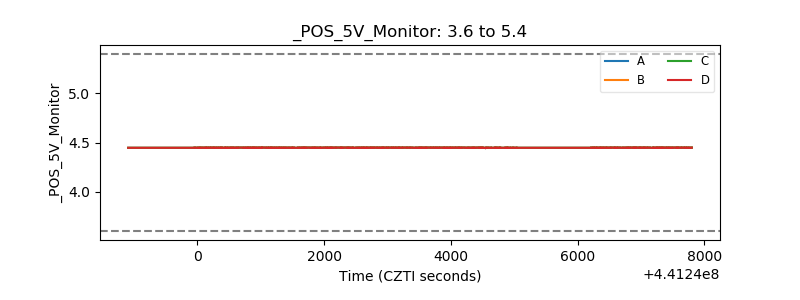 |
| _ROLL_ROT | 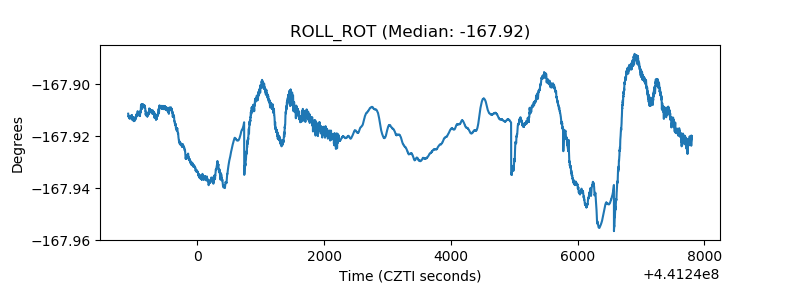 |
| _Roll_DEC | 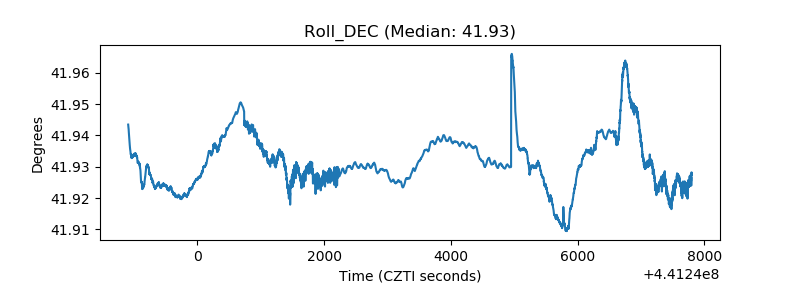 |
| _Roll_RA | 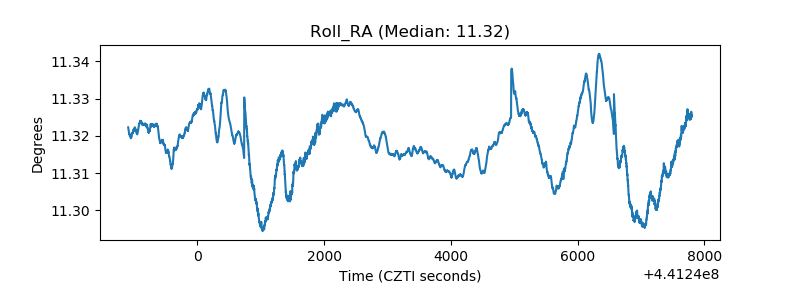 |
| Veto Counter | 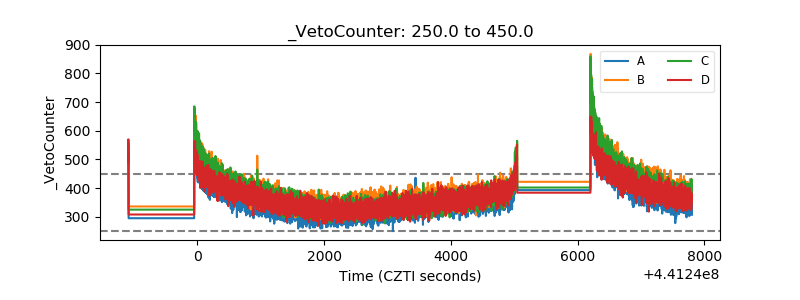 |