| Param | Original file | Final file |
|---|---|---|
| Filename | modeM0/AS1A13_003T01_9000006002_44574cztM0_level2.fits | modeM0/AS1A13_003T01_9000006002_44574cztM0_level2_quad_clean.evt |
| Size (bytes) | 466,320,960 | 113,981,760 |
| Size | 444.7 MB | 108.7 MB |
| Events in quadrant A | 4,918,787 | 771,858 |
| Events in quadrant B | 3,449,363 | 799,647 |
| Events in quadrant C | 4,726,073 | 731,689 |
| Events in quadrant D | 3,659,515 | 692,210 |
| Mode M9 | |||
|---|---|---|---|
| Quadrant | BADHDUFLAG | Total packets | Discarded packets |
| A | 0 | 18 | 0 |
| B | 0 | 19 | 0 |
| C | 0 | 19 | 0 |
| D | 0 | 19 | 0 |
| Mode SS | |||
|---|---|---|---|
| Quadrant | BADHDUFLAG | Total packets | Discarded packets |
| A | 0 | 132 | 0 |
| B | 0 | 132 | 0 |
| C | 0 | 132 | 0 |
| D | 0 | 132 | 0 |
| Mode M0 | |||
|---|---|---|---|
| Quadrant | BADHDUFLAG | Total packets | Discarded packets |
| A | 0 | 20184 | 2 |
| B | 0 | 14627 | 2 |
| C | 0 | 18500 | 2 |
| D | 0 | 15407 | 2 |
| Quadrant | Total seconds | Saturated seconds | Saturation percentage |
|---|---|---|---|
| A | 6543 | 108 | 1.650619% |
| B | 6543 | 116 | 1.772887% |
| C | 6543 | 398 | 6.082837% |
| D | 6543 | 133 | 2.032707% |
Noise dominated data is calculated using 1-second bins in cleaned event files. If a bin has >2000 counts, and if more than 50% of those come from <1% of pixels, then it is considered to be noise-dominated and hence unusable.
| Quadrant | # 1 sec bins | Bins with >0 counts | Bins with >2000 counts | High rate bins dominated by noise | Noise dominated (total time) | Noise dominated (detector-on time) | Marked lightcurve |
|---|---|---|---|---|---|---|---|
| A | 7778 | 6544 | 11 | 11 | 0.14% | 0.17% | 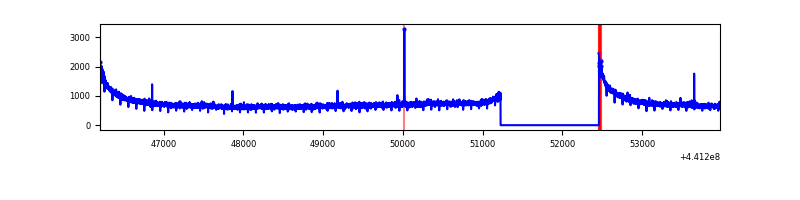 |
| B | 7778 | 6543 | 55 | 55 | 0.71% | 0.84% | 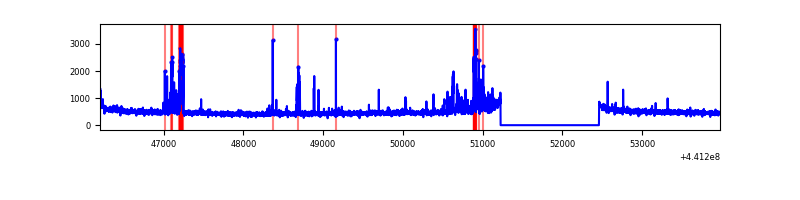 |
| C | 7777 | 6542 | 280 | 280 | 3.60% | 4.28% | 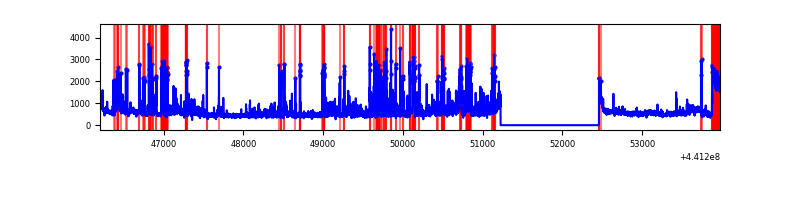 |
| D | 7778 | 6543 | 107 | 107 | 1.38% | 1.64% | 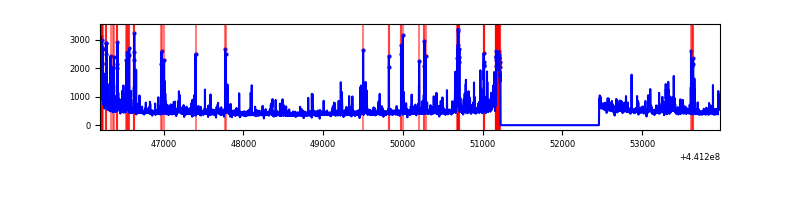 |
Top three noisy pixels from each quadrant. If the there are fewer than three noisy pixels in the level2.evt file, extra rows are filled as -1
| Pixel properties | Quadrant properties | ||||||
|---|---|---|---|---|---|---|---|
| Quadrant | DetID | PixID | Counts | Sigma | Mean | Median | Sigma |
| A | 10 | 83 | 1926421 | 12156.65 | 768 | 752 | 158.4 |
| A | 0 | 243 | 9057 | 52.43 | 768 | 752 | 158.4 |
| A | 3 | 137 | 8436 | 48.51 | 768 | 752 | 158.4 |
| B | 5 | 172 | 123241 | 812.98 | 769 | 746 | 150.7 |
| B | 5 | 235 | 107526 | 708.68 | 769 | 746 | 150.7 |
| B | 4 | 171 | 85869 | 564.95 | 769 | 746 | 150.7 |
| C | 15 | 208 | 1472538 | 8554.75 | 738 | 743 | 172.0 |
| C | 3 | 233 | 220428 | 1276.91 | 738 | 743 | 172.0 |
| C | 14 | 254 | 106258 | 613.3 | 738 | 743 | 172.0 |
| D | 2 | 249 | 240863 | 1286.82 | 744 | 722 | 186.6 |
| D | 1 | 52 | 178612 | 953.24 | 744 | 722 | 186.6 |
| D | 13 | 249 | 137089 | 730.74 | 744 | 722 | 186.6 |
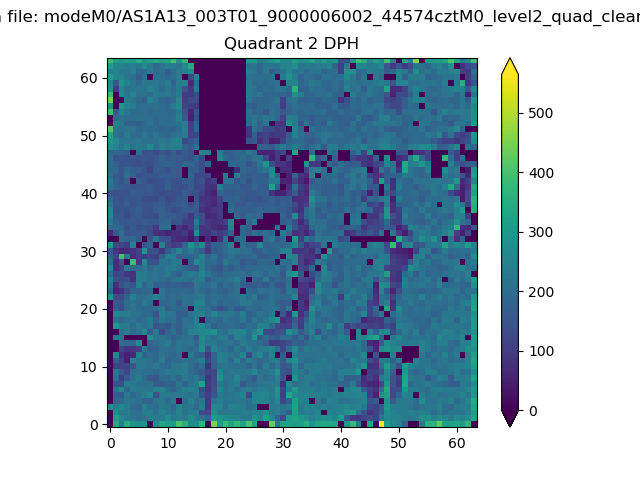
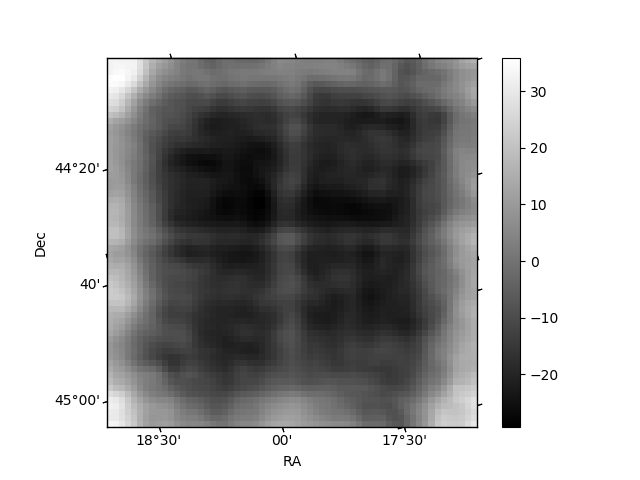
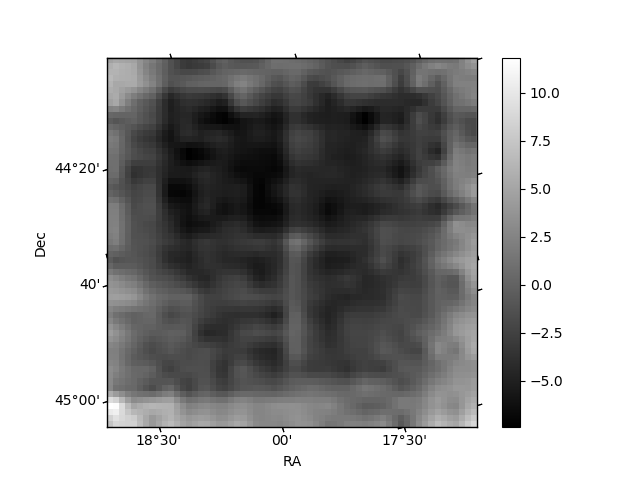
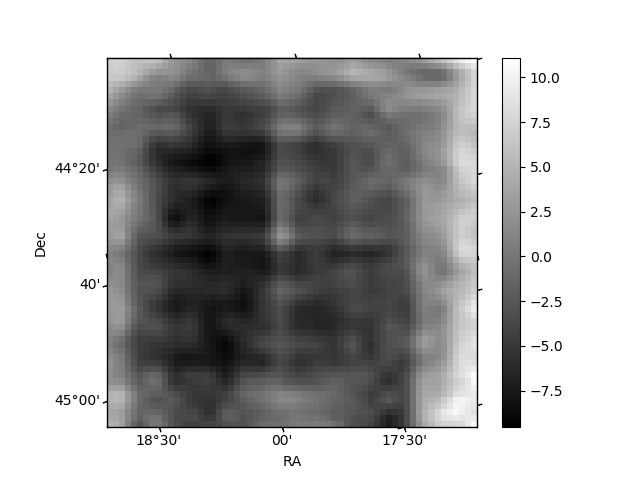
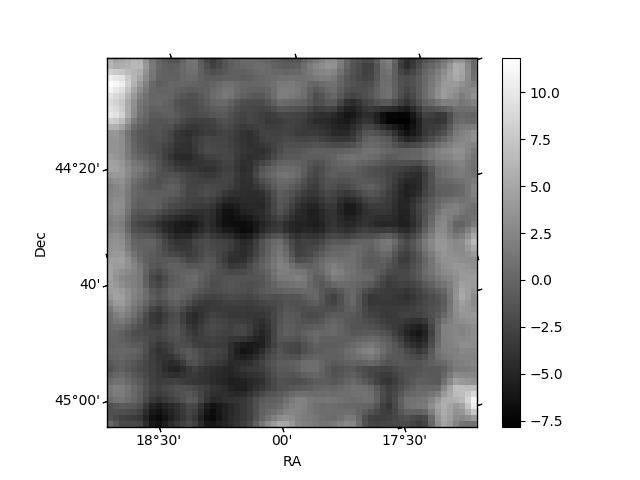
Histogram calculated using DETX and DETY for each event in the final _common_clean file
| Quadrant A | 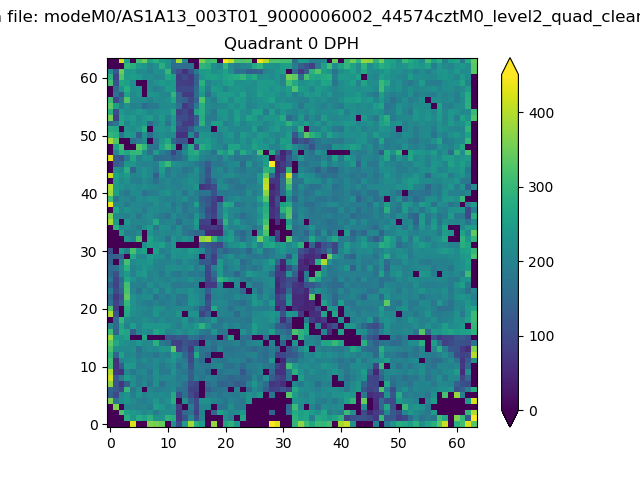 |
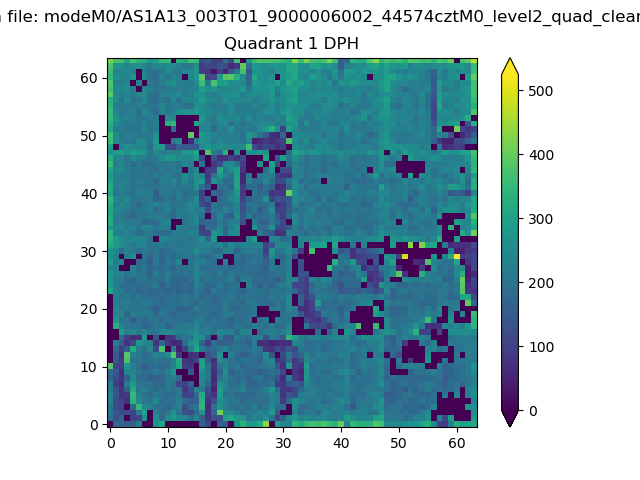 |
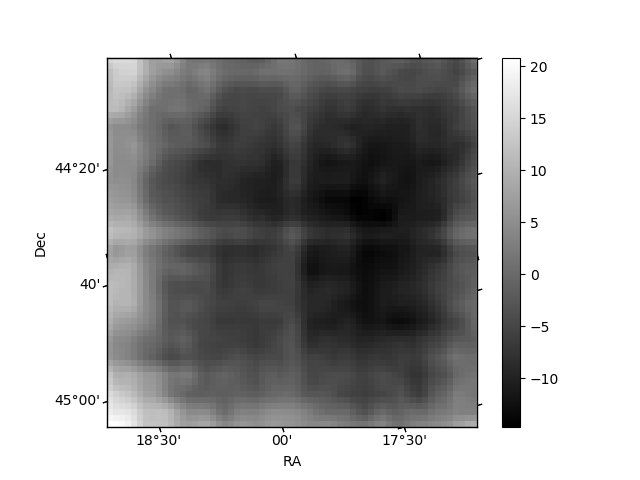
Quadrant B |
|---|---|---|---|
| Quadrant D | 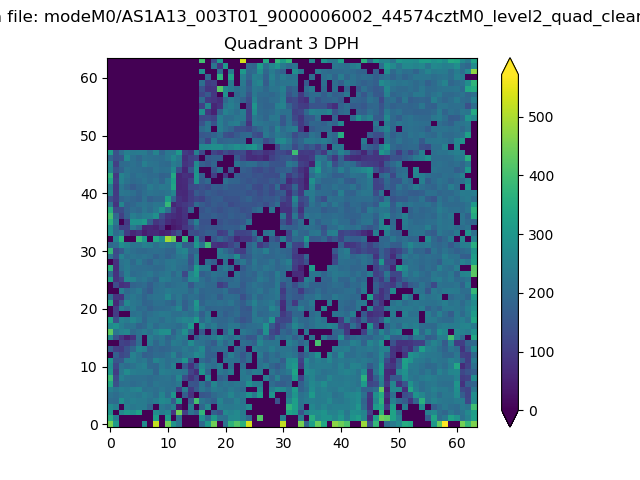 |
 |
Quadrant C |
| Plot type | Count rate plots | Images |
|---|---|---|
| Comparison with Poisson distribution Blue bars denote a histogram of data divided into 1 sec bins. Red curve is a Poisson curve with rate = median count rate of data. |
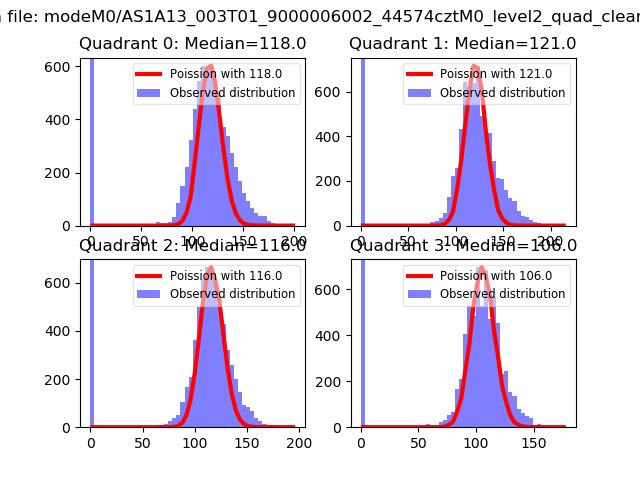 |
 |
| Quadrant-wise count rates Data is divided into 100 sec bins |
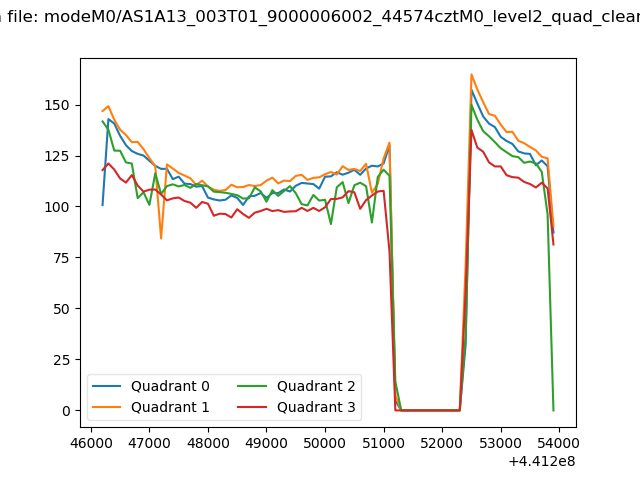 |
|
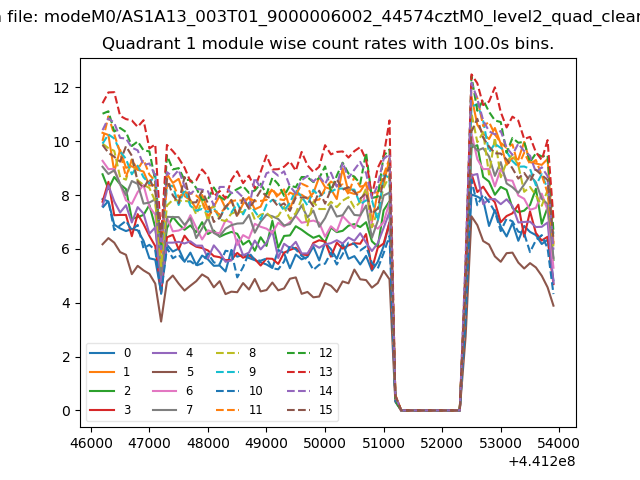
| Module-wise count rates for Quadrant A Data is divided into 100 sec bins |
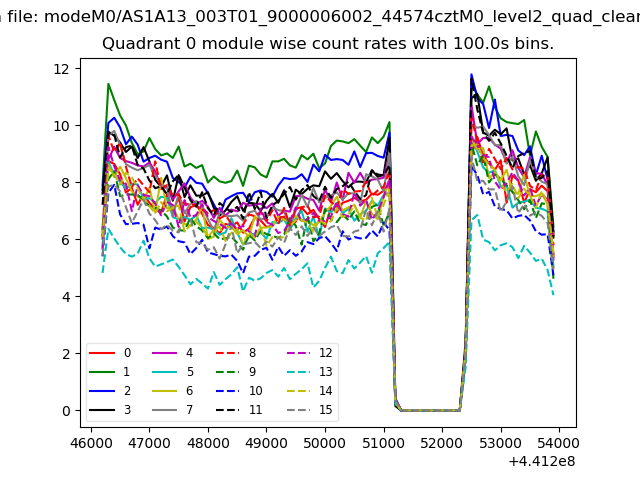 |
 |
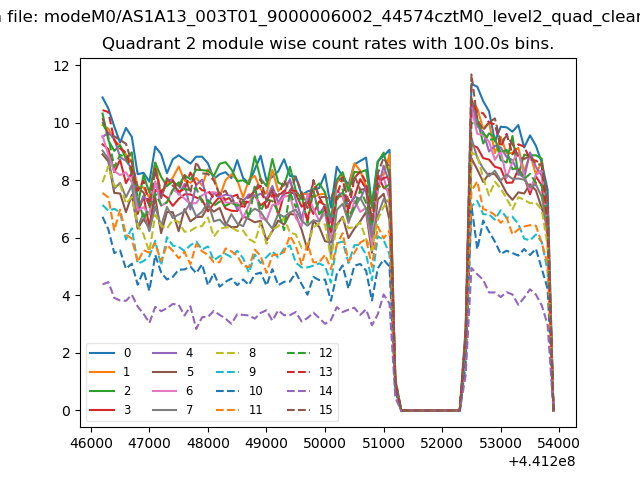
| Module-wise count rates for Quadrant B Data is divided into 100 sec bins |
 |
 |
| Module-wise count rates for Quadrant C Data is divided into 100 sec bins |
 |
 |
| Module-wise count rates for Quadrant D Data is divided into 100 sec bins |
 |
 |
| Parameter | Plot |
|---|---|
| CZT HV Monitor | 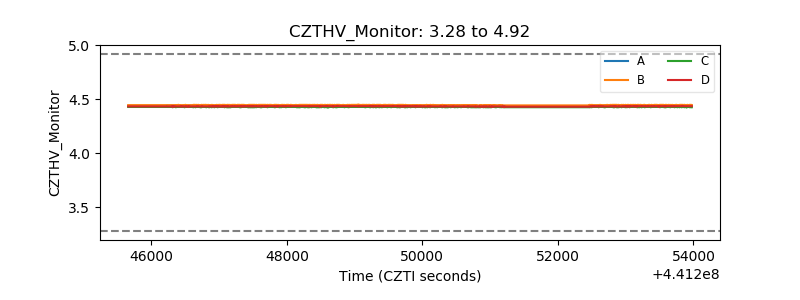 |
| D_VDD | 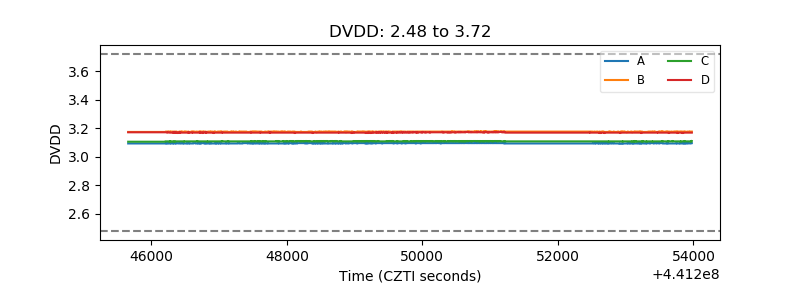 |
| Temperature 1 | 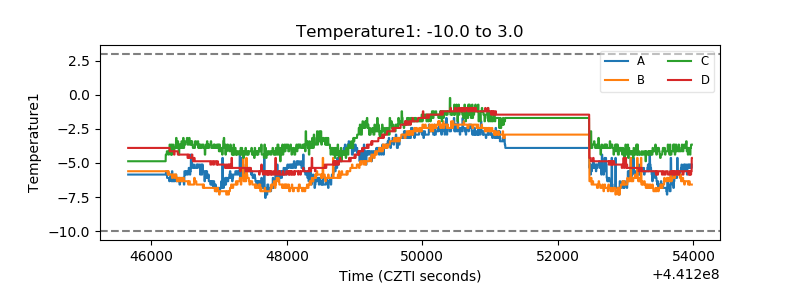 |
| Veto HV Monitor | 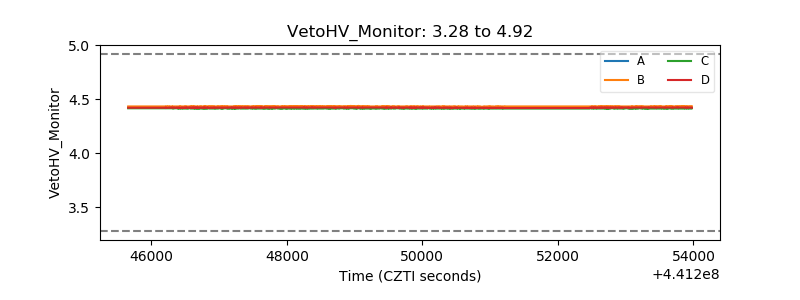 |
| Veto LLD | 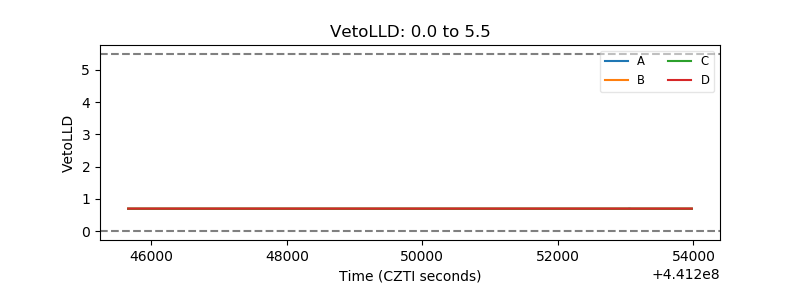 |
| Alpha Counter | 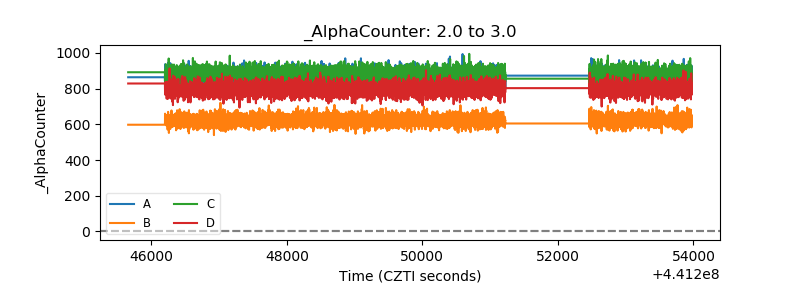 |
| _CPM_Rate | 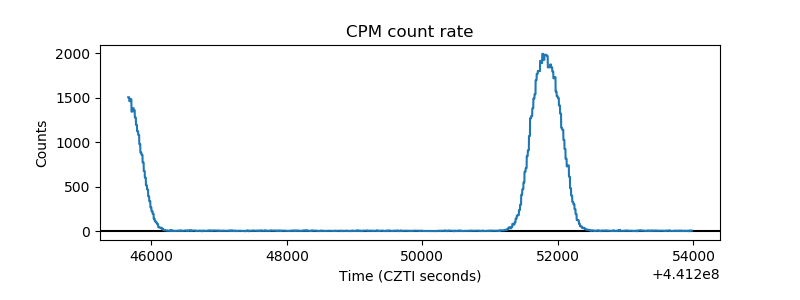 |
| CZT Counter | 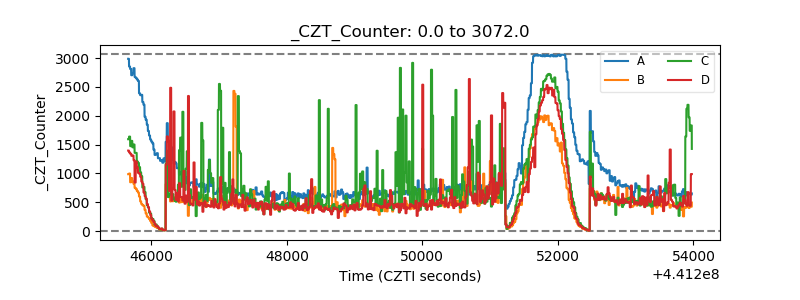 |
| +2.5 Volts monitor | 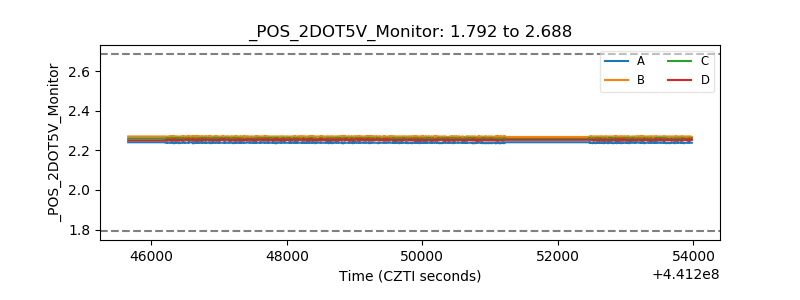 |
| +5 Volts monitor | 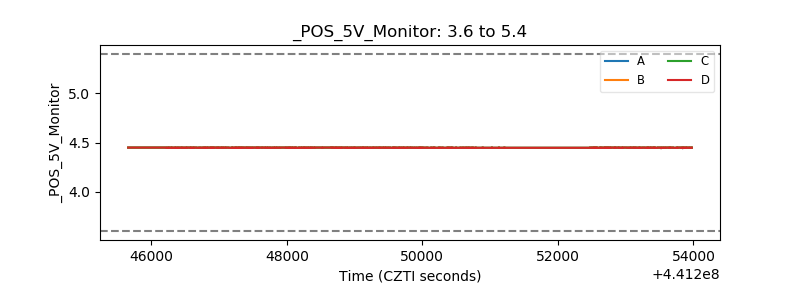 |
| _ROLL_ROT |  |
| _Roll_DEC | 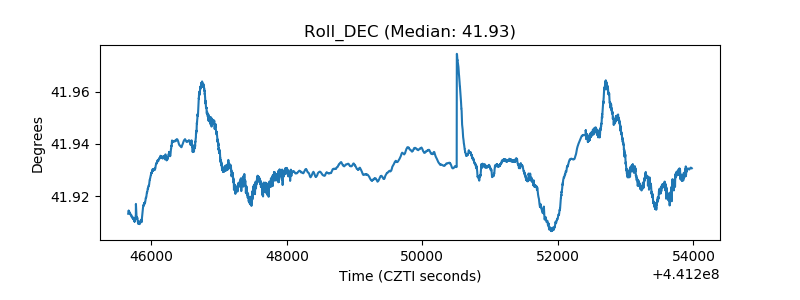 |
| _Roll_RA | 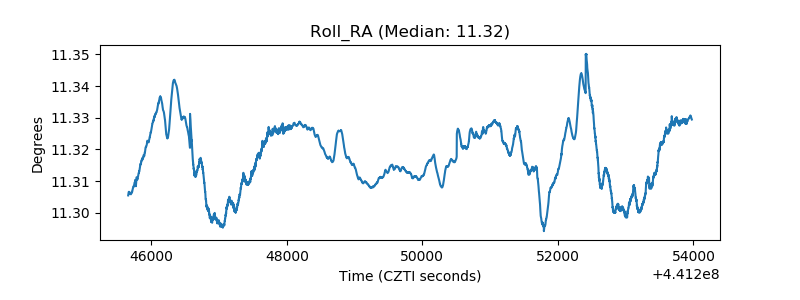 |
| Veto Counter | 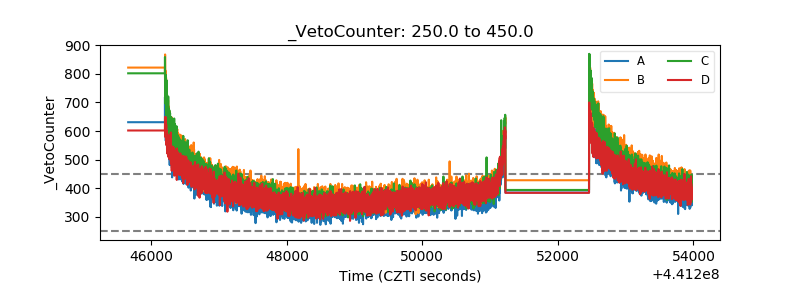 |