| Param | Original file | Final file |
|---|---|---|
| Filename | modeM0/AS1A13_003T01_9000006002_44576cztM0_level2.fits | modeM0/AS1A13_003T01_9000006002_44576cztM0_level2_quad_clean.evt |
| Size (bytes) | 460,203,840 | 114,278,400 |
| Size | 438.9 MB | 109.0 MB |
| Events in quadrant A | 4,954,982 | 773,858 |
| Events in quadrant B | 3,604,123 | 797,665 |
| Events in quadrant C | 3,314,911 | 769,686 |
| Events in quadrant D | 4,663,548 | 672,623 |
| Mode M9 | |||
|---|---|---|---|
| Quadrant | BADHDUFLAG | Total packets | Discarded packets |
| A | 0 | 17 | 0 |
| B | 0 | 18 | 0 |
| C | 0 | 18 | 0 |
| D | 0 | 18 | 0 |
| Mode SS | |||
|---|---|---|---|
| Quadrant | BADHDUFLAG | Total packets | Discarded packets |
| A | 0 | 128 | 0 |
| B | 0 | 128 | 0 |
| C | 0 | 128 | 0 |
| D | 0 | 128 | 0 |
| Mode M0 | |||
|---|---|---|---|
| Quadrant | BADHDUFLAG | Total packets | Discarded packets |
| A | 0 | 20179 | 2 |
| B | 0 | 14817 | 2 |
| C | 0 | 14125 | 2 |
| D | 0 | 18225 | 2 |
| Quadrant | Total seconds | Saturated seconds | Saturation percentage |
|---|---|---|---|
| A | 6408 | 186 | 2.902622% |
| B | 6408 | 233 | 3.636080% |
| C | 6408 | 92 | 1.435705% |
| D | 6408 | 460 | 7.178527% |
Noise dominated data is calculated using 1-second bins in cleaned event files. If a bin has >2000 counts, and if more than 50% of those come from <1% of pixels, then it is considered to be noise-dominated and hence unusable.
| Quadrant | # 1 sec bins | Bins with >0 counts | Bins with >2000 counts | High rate bins dominated by noise | Noise dominated (total time) | Noise dominated (detector-on time) | Marked lightcurve |
|---|---|---|---|---|---|---|---|
| A | 7638 | 6408 | 11 | 11 | 0.14% | 0.17% | 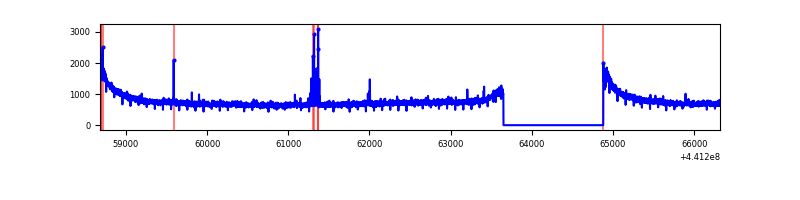 |
| B | 7638 | 6408 | 109 | 109 | 1.43% | 1.70% | 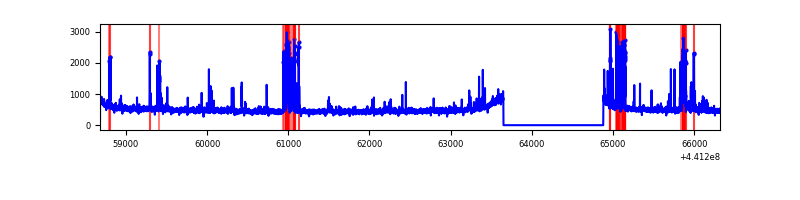 |
| C | 7638 | 6409 | 24 | 24 | 0.31% | 0.37% | 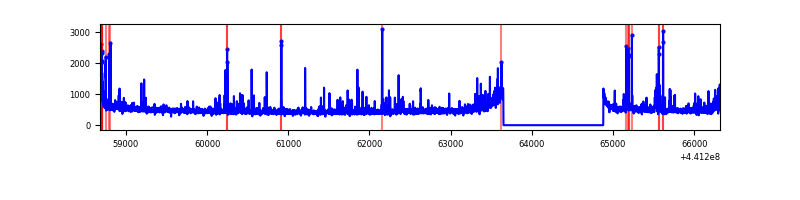 |
| D | 7638 | 6408 | 370 | 370 | 4.84% | 5.77% | 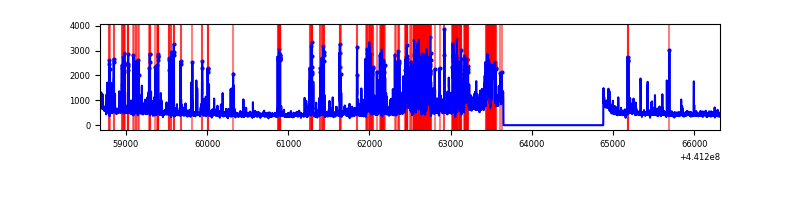 |
Top three noisy pixels from each quadrant. If the there are fewer than three noisy pixels in the level2.evt file, extra rows are filled as -1
| Pixel properties | Quadrant properties | ||||||
|---|---|---|---|---|---|---|---|
| Quadrant | DetID | PixID | Counts | Sigma | Mean | Median | Sigma |
| A | 10 | 83 | 1883691 | 11614.62 | 782 | 767 | 162.1 |
| A | 13 | 248 | 40621 | 245.84 | 782 | 767 | 162.1 |
| A | 3 | 137 | 8395 | 47.05 | 782 | 767 | 162.1 |
| B | 5 | 172 | 420919 | 2777.46 | 778 | 753 | 151.3 |
| B | 5 | 255 | 57116 | 372.58 | 778 | 753 | 151.3 |
| B | 4 | 171 | 26929 | 173.03 | 778 | 753 | 151.3 |
| C | 14 | 254 | 147167 | 825.59 | 762 | 769 | 177.3 |
| C | 3 | 233 | 63464 | 353.56 | 762 | 769 | 177.3 |
| C | 15 | 208 | 55073 | 306.24 | 762 | 769 | 177.3 |
| D | 13 | 249 | 1098916 | 6024.01 | 737 | 717 | 182.3 |
| D | 1 | 52 | 434168 | 2377.63 | 737 | 717 | 182.3 |
| D | 13 | 174 | 152041 | 830.06 | 737 | 717 | 182.3 |
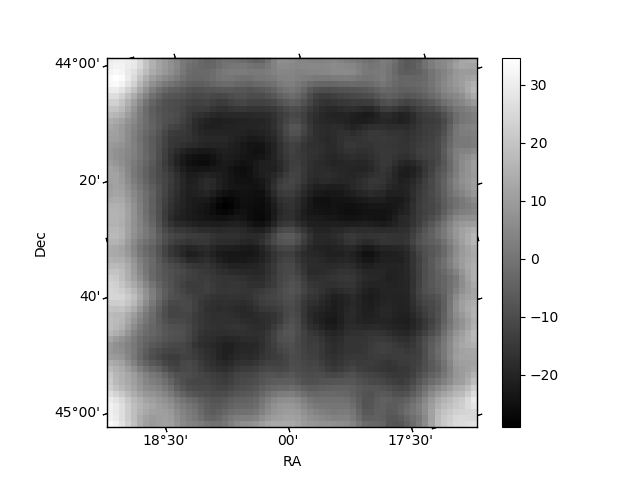
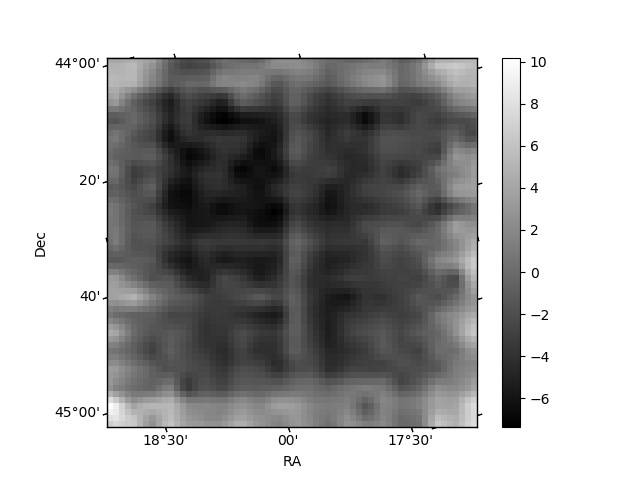
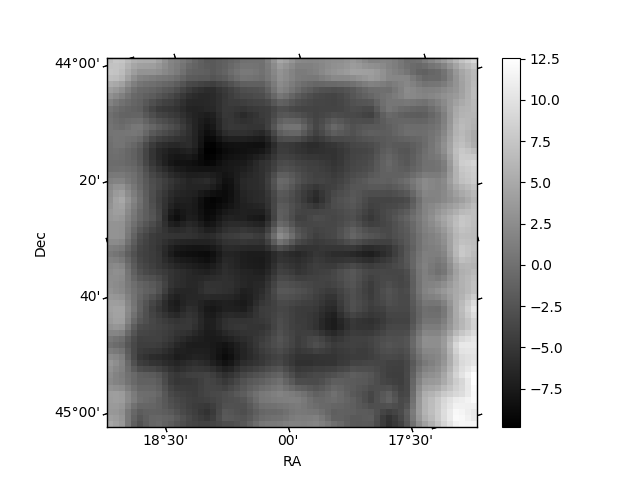
Histogram calculated using DETX and DETY for each event in the final _common_clean file
| Quadrant A | 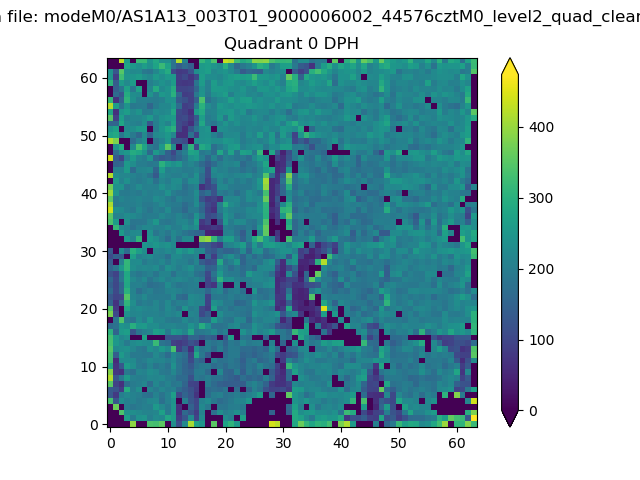 |
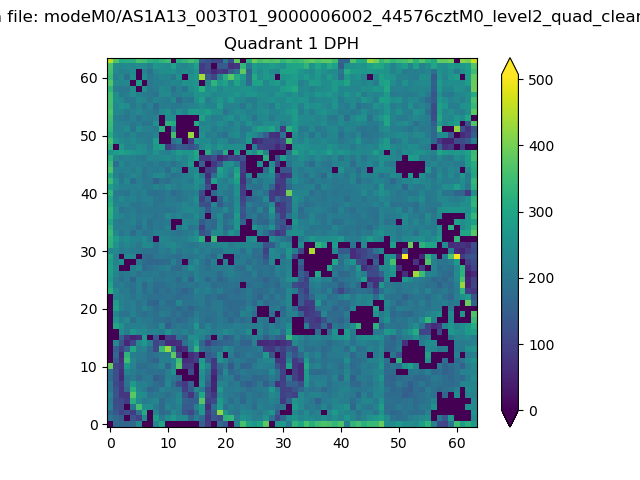 |
Quadrant B |
|---|---|---|---|
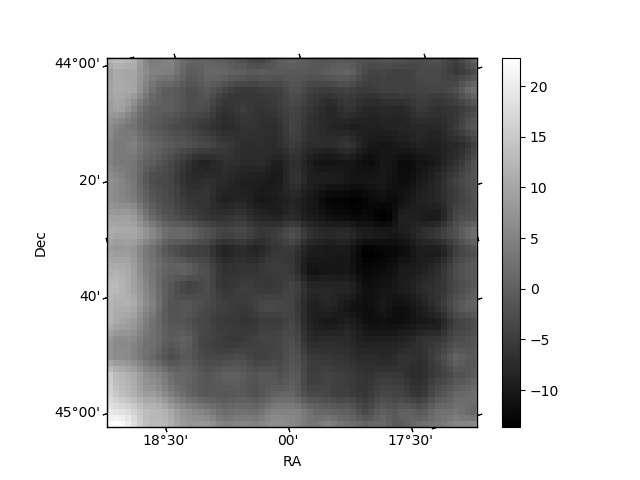
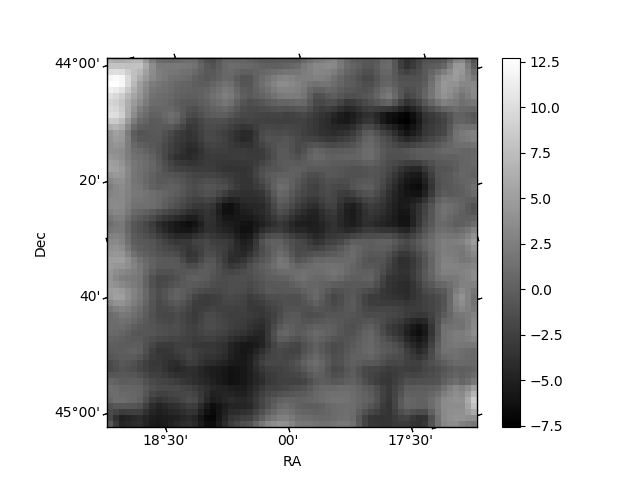
| Quadrant D | 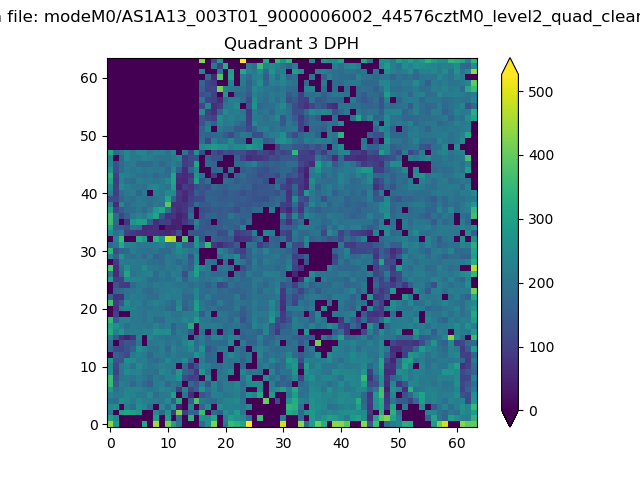 |
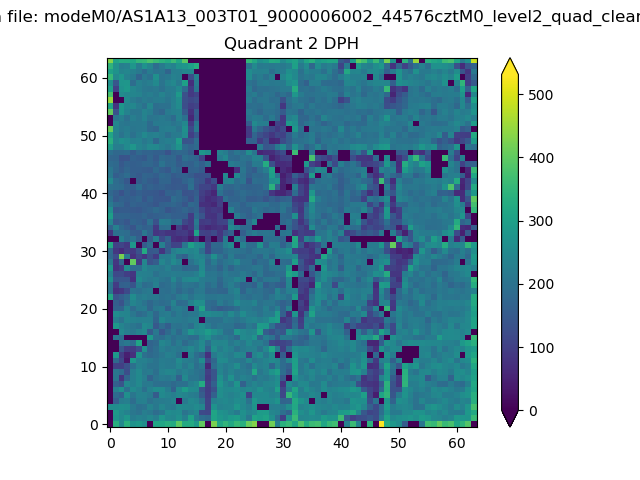 |
Quadrant C |
| Plot type | Count rate plots | Images |
|---|---|---|
| Comparison with Poisson distribution Blue bars denote a histogram of data divided into 1 sec bins. Red curve is a Poisson curve with rate = median count rate of data. |
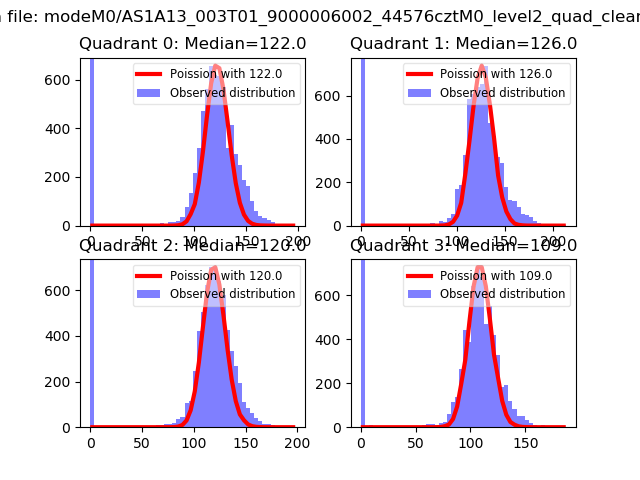 |
 |
| Quadrant-wise count rates Data is divided into 100 sec bins |
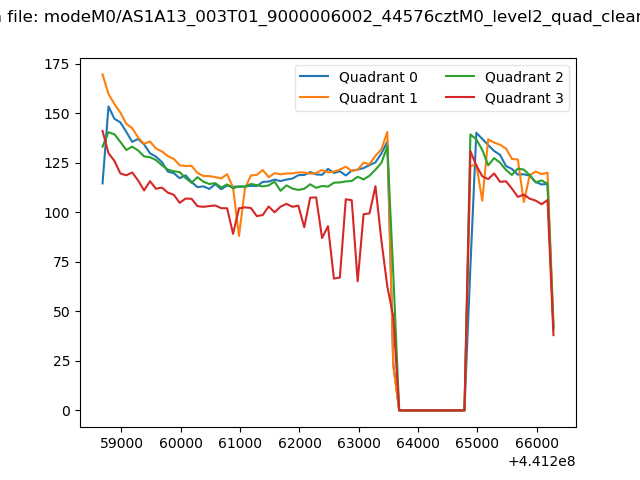 |
|
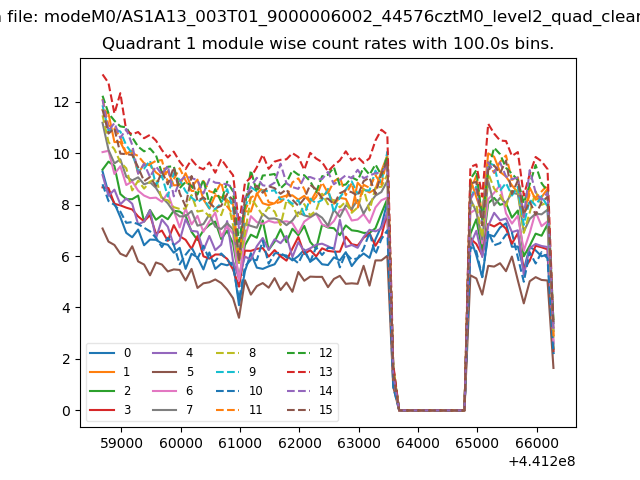
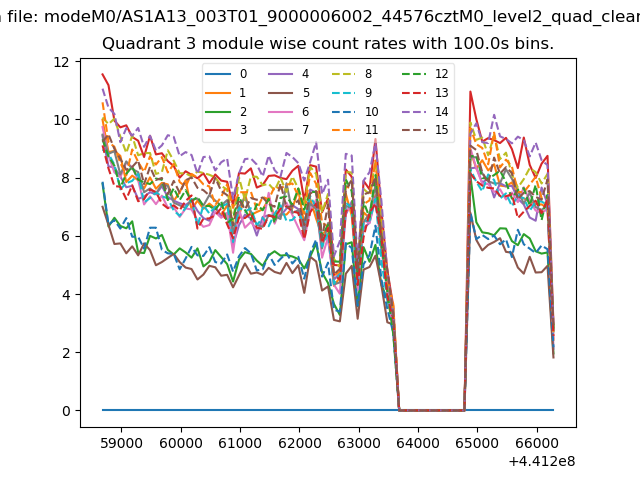
| Module-wise count rates for Quadrant A Data is divided into 100 sec bins |
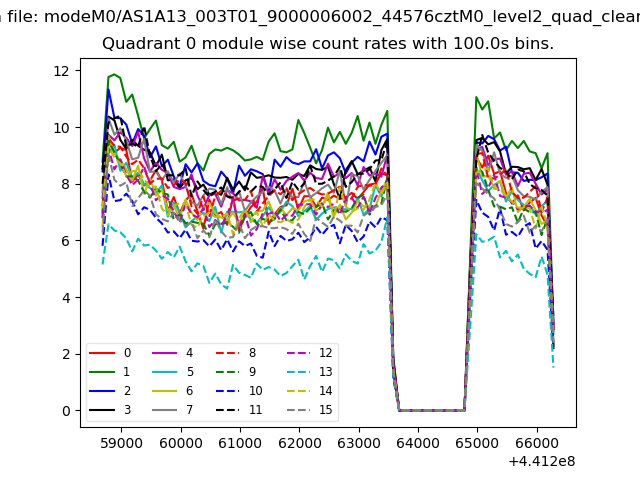 |
 |
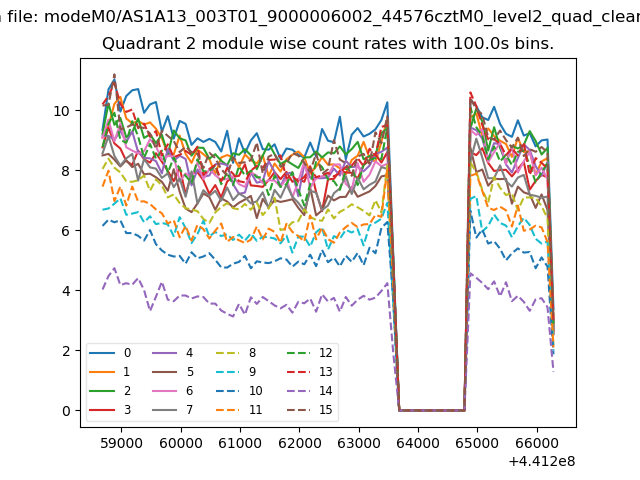
| Module-wise count rates for Quadrant B Data is divided into 100 sec bins |
 |
 |
| Module-wise count rates for Quadrant C Data is divided into 100 sec bins |
 |
 |
| Module-wise count rates for Quadrant D Data is divided into 100 sec bins |
 |
 |
| Parameter | Plot |
|---|---|
| CZT HV Monitor | 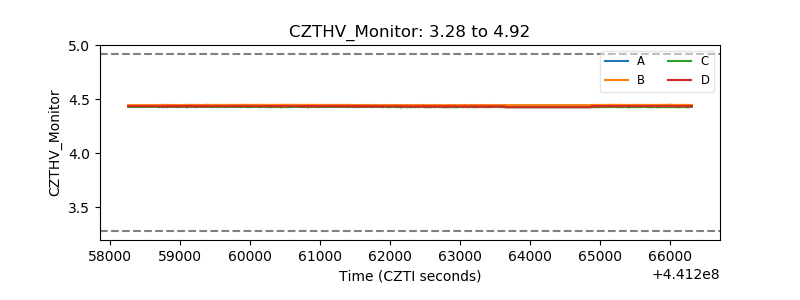 |
| D_VDD | 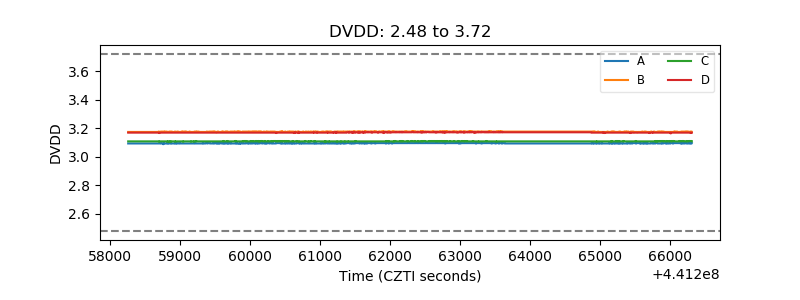 |
| Temperature 1 | 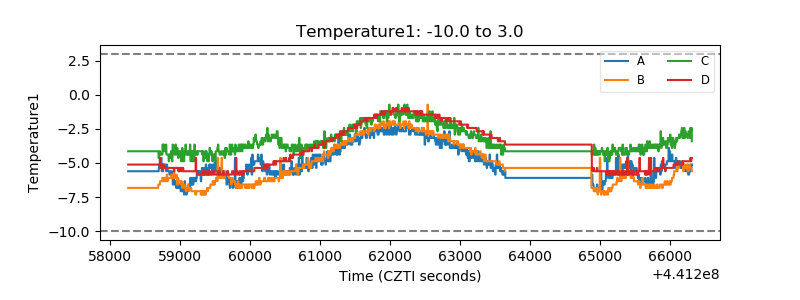 |
| Veto HV Monitor | 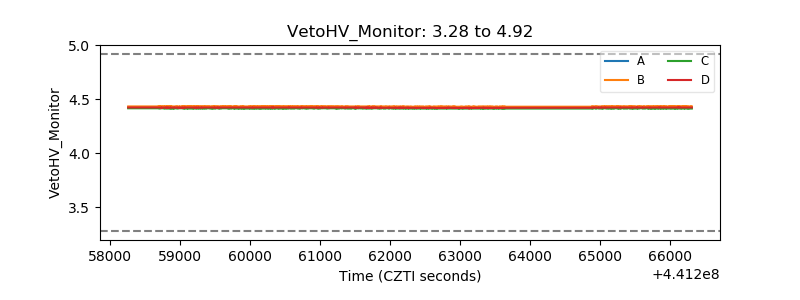 |
| Veto LLD | 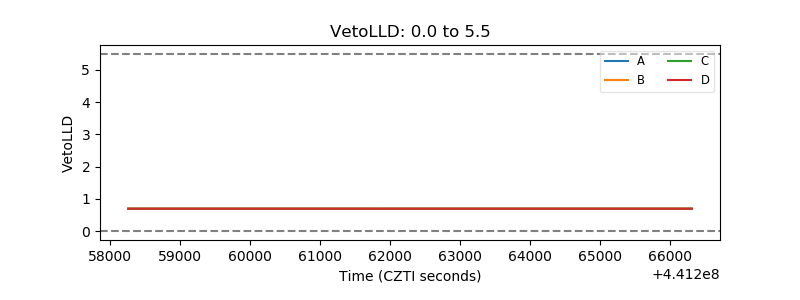 |
| Alpha Counter | 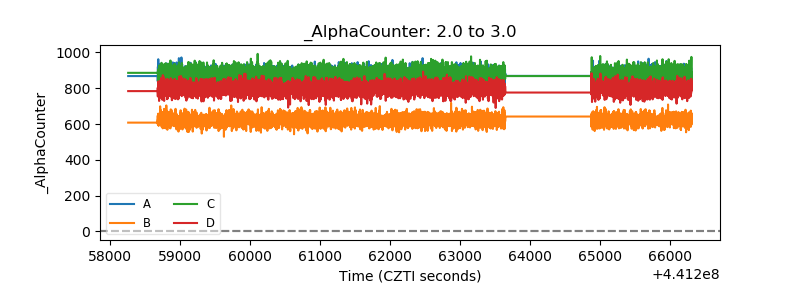 |
| _CPM_Rate | 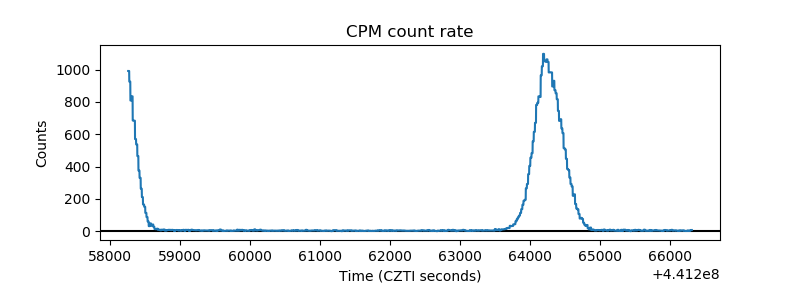 |
| CZT Counter | 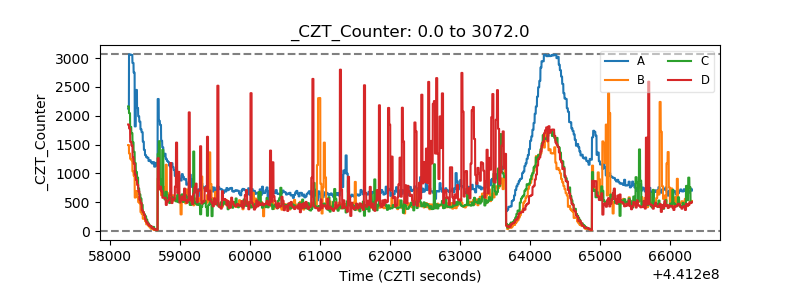 |
| +2.5 Volts monitor | 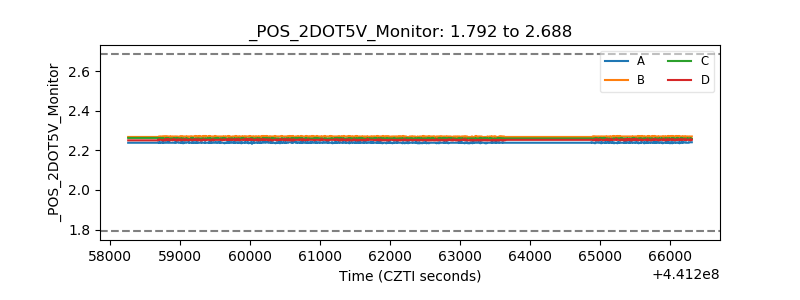 |
| +5 Volts monitor | 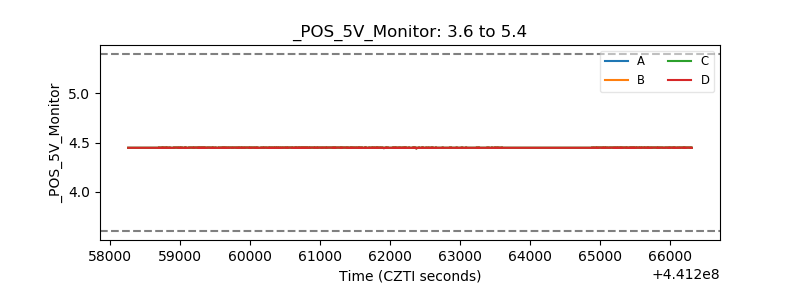 |
| _ROLL_ROT |  |
| _Roll_DEC | 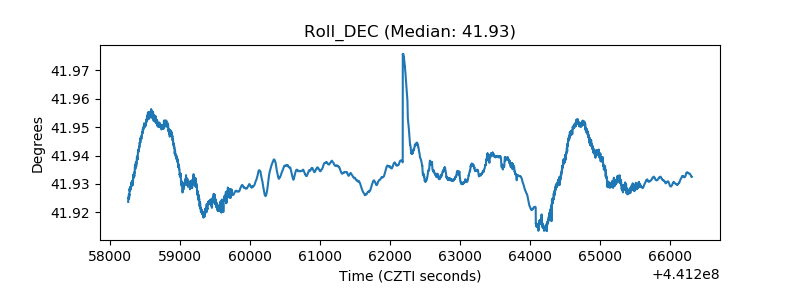 |
| _Roll_RA | 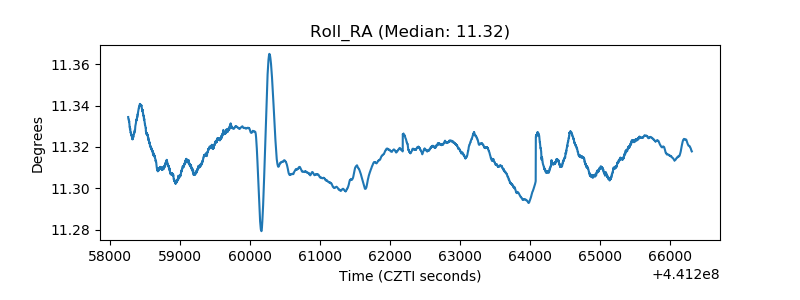 |
| Veto Counter |  |