| Param | Original file | Final file |
|---|---|---|
| Filename | modeM0/AS1A13_003T01_9000006002_44578cztM0_level2.fits | modeM0/AS1A13_003T01_9000006002_44578cztM0_level2_quad_clean.evt |
| Size (bytes) | 679,178,880 | 138,021,120 |
| Size | 647.7 MB | 131.6 MB |
| Events in quadrant A | 6,110,459 | 959,968 |
| Events in quadrant B | 5,241,009 | 963,186 |
| Events in quadrant C | 5,738,655 | 895,499 |
| Events in quadrant D | 7,389,076 | 767,763 |
| Mode M9 | |||
|---|---|---|---|
| Quadrant | BADHDUFLAG | Total packets | Discarded packets |
| A | 0 | 11 | 0 |
| B | 0 | 11 | 0 |
| C | 0 | 11 | 0 |
| D | 0 | 11 | 0 |
| Mode SS | |||
|---|---|---|---|
| Quadrant | BADHDUFLAG | Total packets | Discarded packets |
| A | 0 | 172 | 0 |
| B | 0 | 172 | 0 |
| C | 0 | 172 | 0 |
| D | 0 | 172 | 0 |
| Mode M0 | |||
|---|---|---|---|
| Quadrant | BADHDUFLAG | Total packets | Discarded packets |
| A | 0 | 25876 | 1 |
| B | 0 | 21311 | 1 |
| C | 0 | 22956 | 1 |
| D | 0 | 27829 | 1 |
| Quadrant | Total seconds | Saturated seconds | Saturation percentage |
|---|---|---|---|
| A | 8539 | 183 | 2.143108% |
| B | 8539 | 436 | 5.105984% |
| C | 8539 | 614 | 7.190538% |
| D | 8539 | 1150 | 13.467619% |
Noise dominated data is calculated using 1-second bins in cleaned event files. If a bin has >2000 counts, and if more than 50% of those come from <1% of pixels, then it is considered to be noise-dominated and hence unusable.
| Quadrant | # 1 sec bins | Bins with >0 counts | Bins with >2000 counts | High rate bins dominated by noise | Noise dominated (total time) | Noise dominated (detector-on time) | Marked lightcurve |
|---|---|---|---|---|---|---|---|
| A | 9624 | 8539 | 3 | 3 | 0.03% | 0.04% | 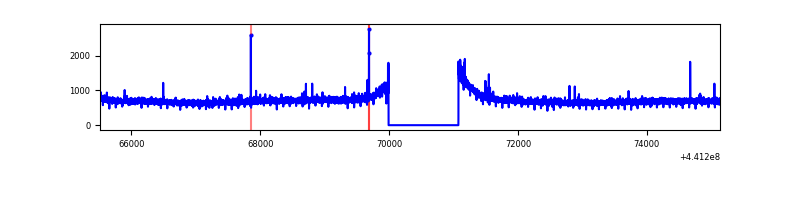 |
| B | 9624 | 8539 | 259 | 259 | 2.69% | 3.03% | 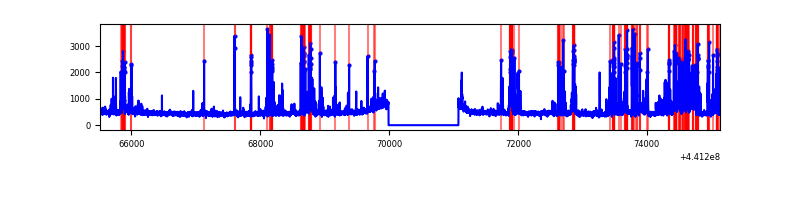 |
| C | 9624 | 8540 | 535 | 535 | 5.56% | 6.26% | 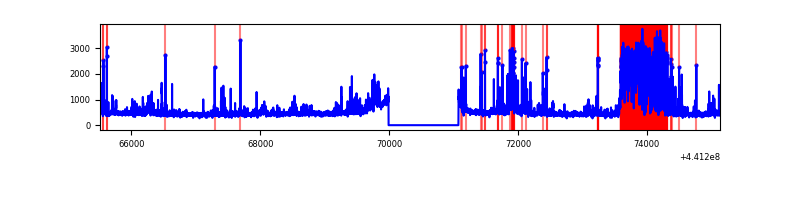 |
| D | 9624 | 8539 | 1048 | 1048 | 10.89% | 12.27% | 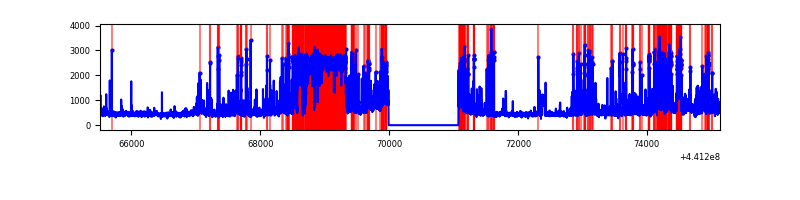 |
Top three noisy pixels from each quadrant. If the there are fewer than three noisy pixels in the level2.evt file, extra rows are filled as -1
| Pixel properties | Quadrant properties | ||||||
|---|---|---|---|---|---|---|---|
| Quadrant | DetID | PixID | Counts | Sigma | Mean | Median | Sigma |
| A | 10 | 83 | 2273305 | 11186.56 | 980 | 958 | 203.1 |
| A | 7 | 3 | 16825 | 78.11 | 980 | 958 | 203.1 |
| A | 10 | 248 | 12642 | 57.52 | 980 | 958 | 203.1 |
| B | 4 | 171 | 843216 | 4504.75 | 962 | 934 | 187.0 |
| B | 5 | 172 | 349574 | 1864.62 | 962 | 934 | 187.0 |
| B | 0 | 186 | 175397 | 933.08 | 962 | 934 | 187.0 |
| C | 15 | 208 | 1603781 | 7409.1 | 931 | 938 | 216.3 |
| C | 14 | 254 | 235231 | 1083.01 | 931 | 938 | 216.3 |
| C | 3 | 233 | 157706 | 724.66 | 931 | 938 | 216.3 |
| D | 13 | 249 | 2912647 | 13122.31 | 888 | 861 | 221.9 |
| D | 1 | 52 | 412715 | 1856.07 | 888 | 861 | 221.9 |
| D | 13 | 174 | 282246 | 1268.09 | 888 | 861 | 221.9 |
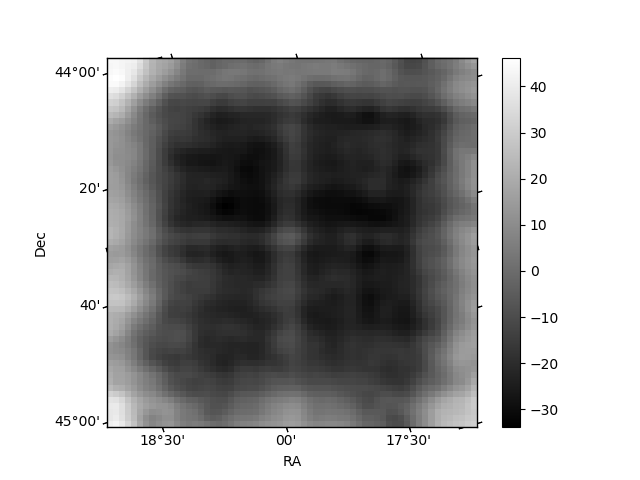
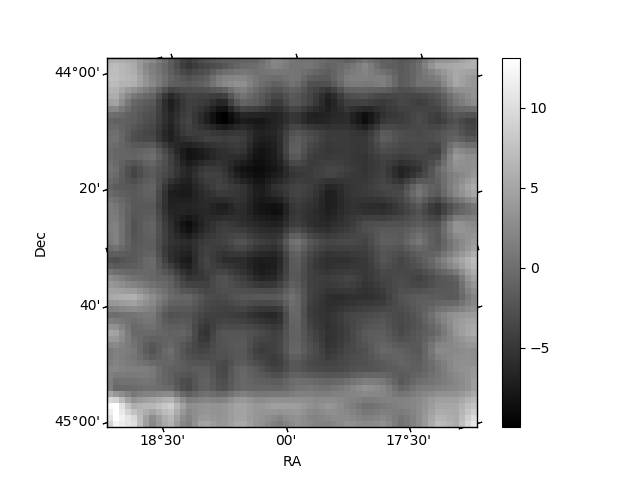
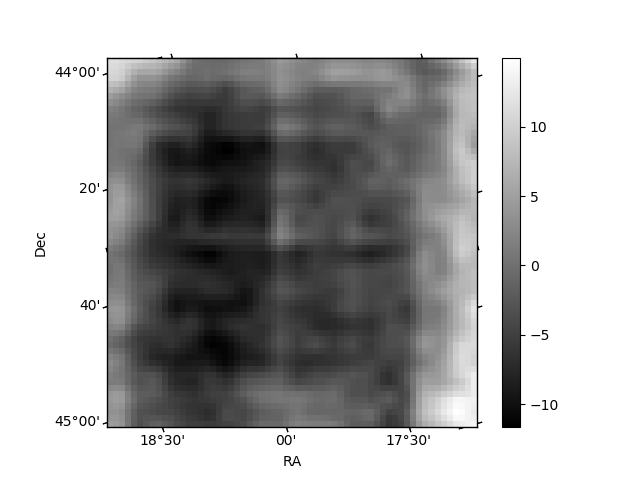
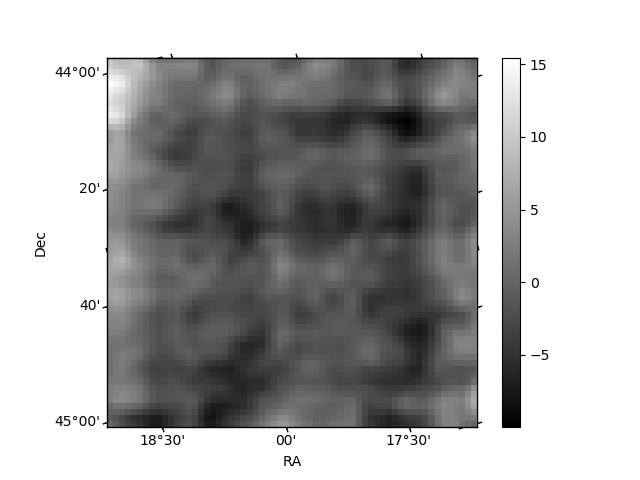
Histogram calculated using DETX and DETY for each event in the final _common_clean file
| Quadrant A | 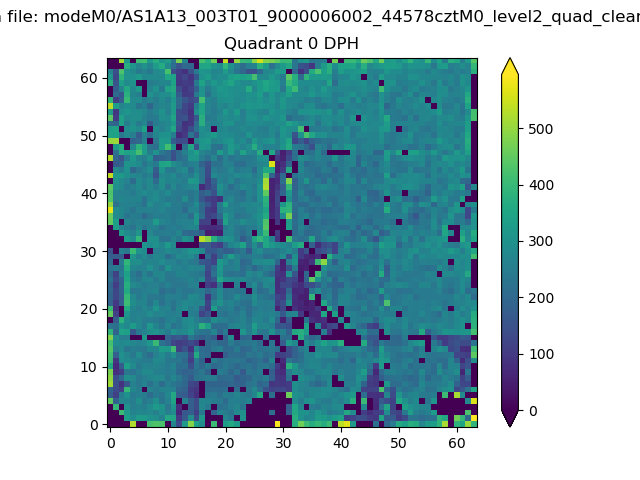 |
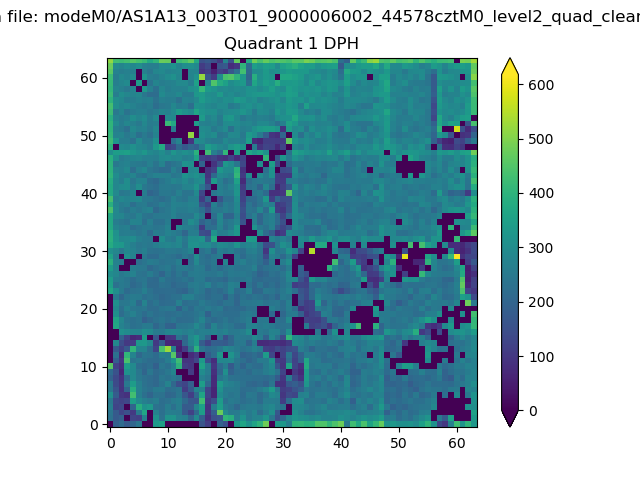 |
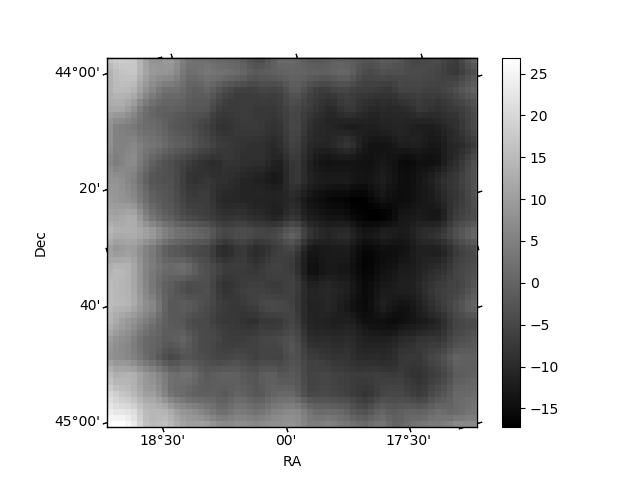
Quadrant B |
|---|---|---|---|
| Quadrant D | 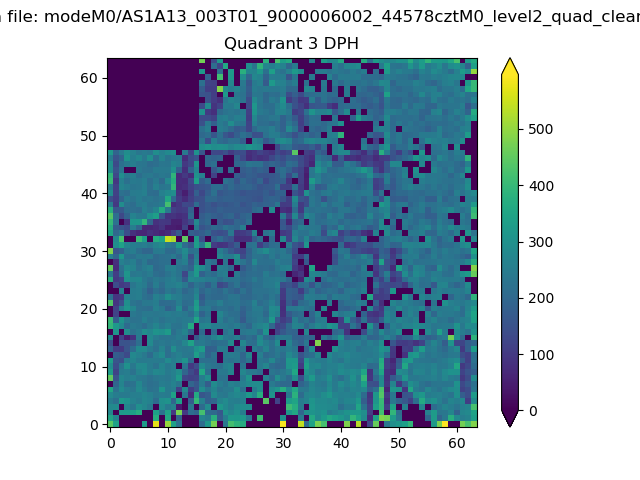 |
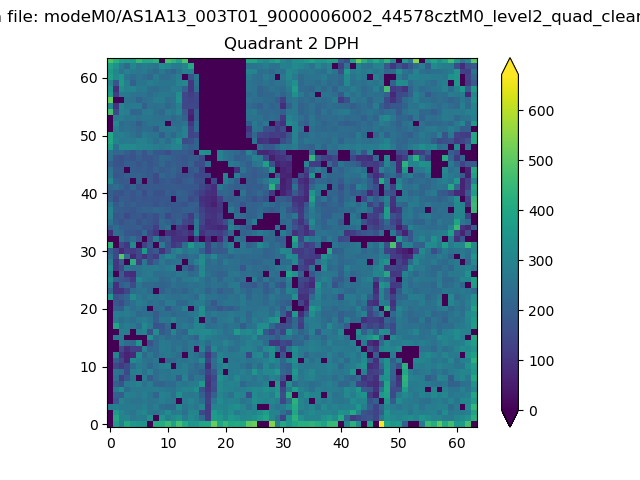 |
Quadrant C |
| Plot type | Count rate plots | Images |
|---|---|---|
| Comparison with Poisson distribution Blue bars denote a histogram of data divided into 1 sec bins. Red curve is a Poisson curve with rate = median count rate of data. |
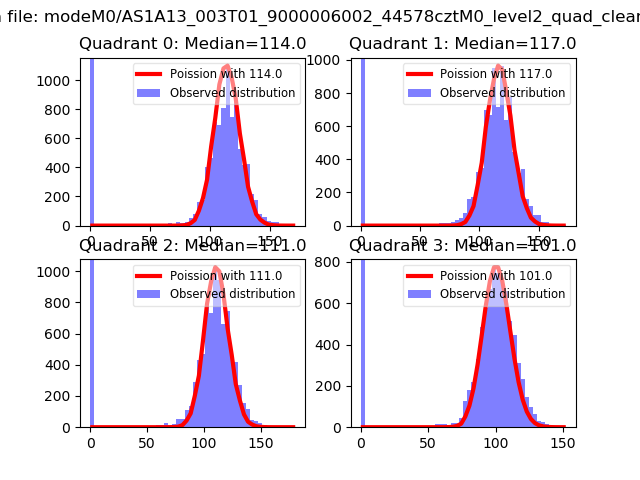 |
 |
| Quadrant-wise count rates Data is divided into 100 sec bins |
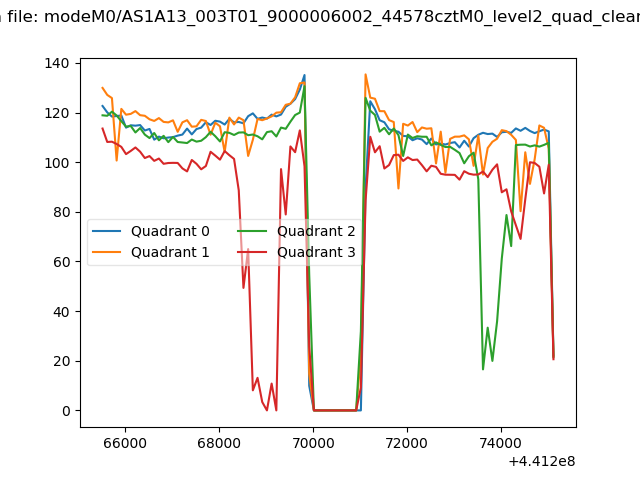 |
|
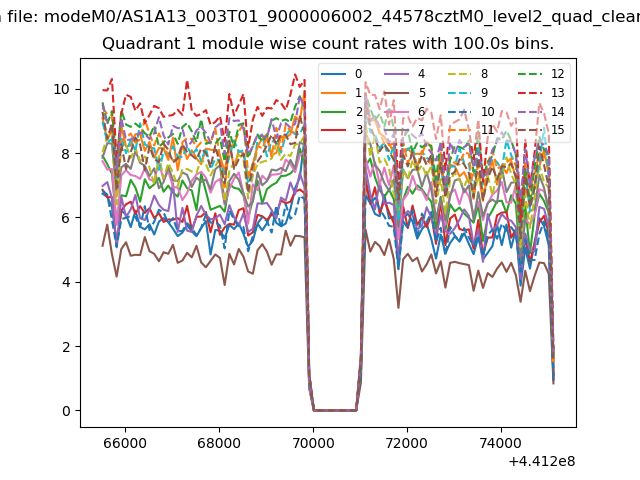
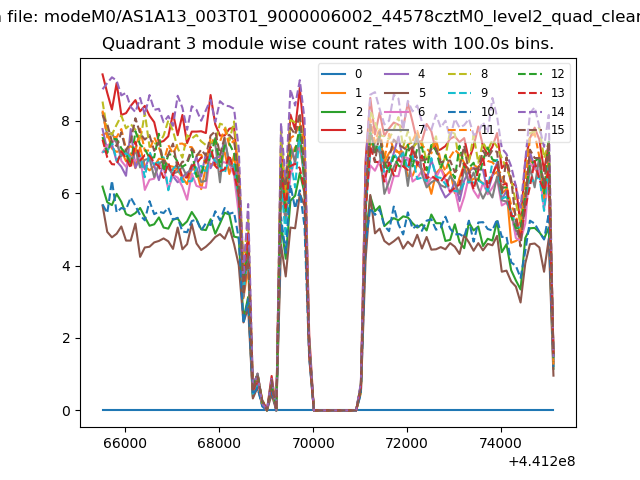
| Module-wise count rates for Quadrant A Data is divided into 100 sec bins |
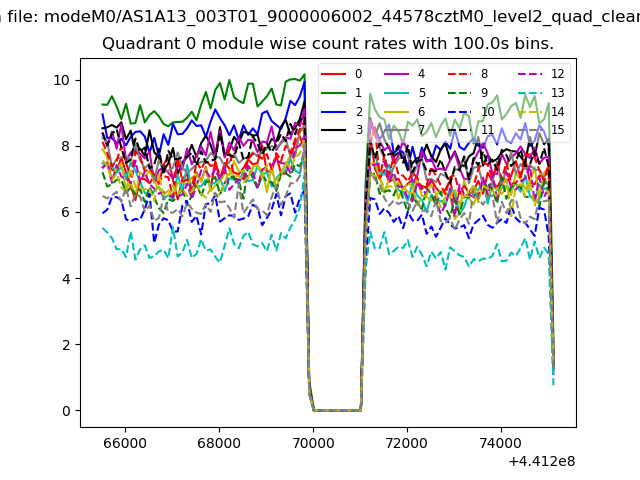 |
 |
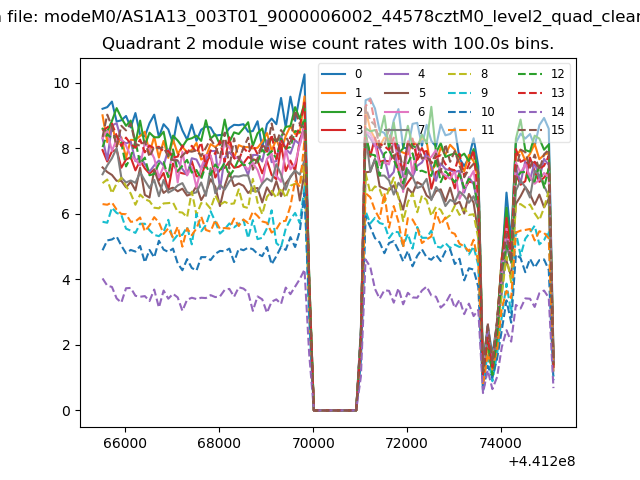
| Module-wise count rates for Quadrant B Data is divided into 100 sec bins |
 |
 |
| Module-wise count rates for Quadrant C Data is divided into 100 sec bins |
 |
 |
| Module-wise count rates for Quadrant D Data is divided into 100 sec bins |
 |
 |
| Parameter | Plot |
|---|---|
| CZT HV Monitor |  |
| D_VDD | 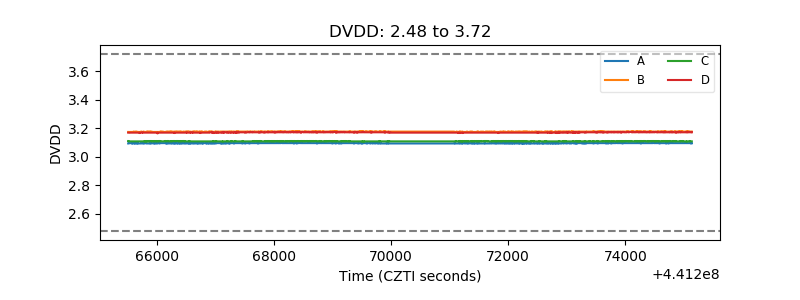 |
| Temperature 1 | 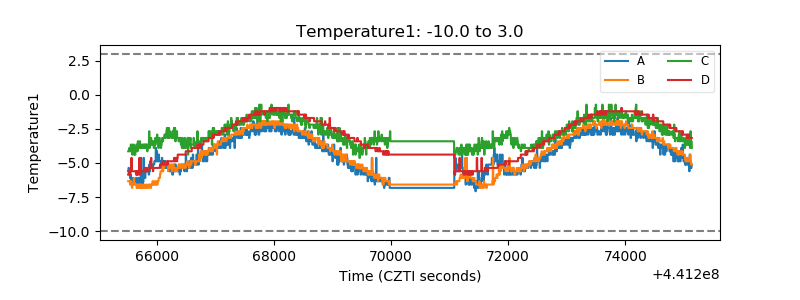 |
| Veto HV Monitor | 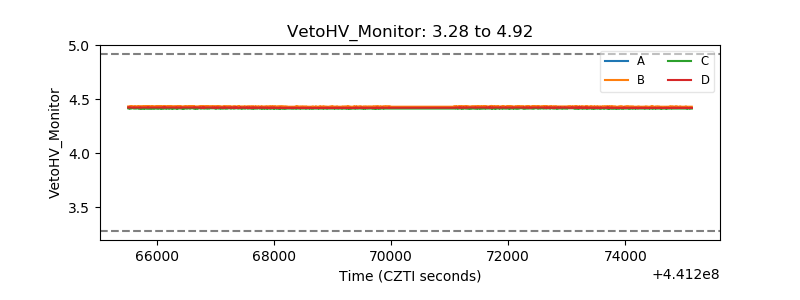 |
| Veto LLD | 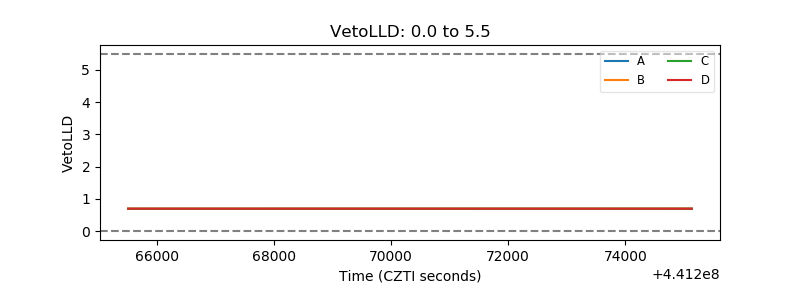 |
| Alpha Counter | 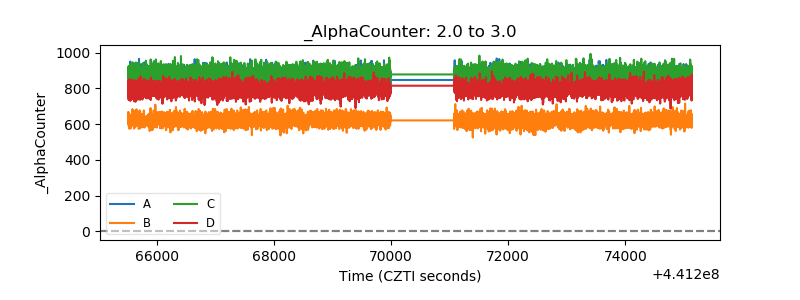 |
| _CPM_Rate | 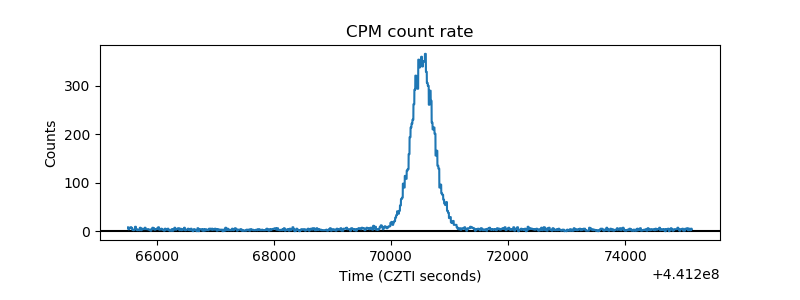 |
| CZT Counter | 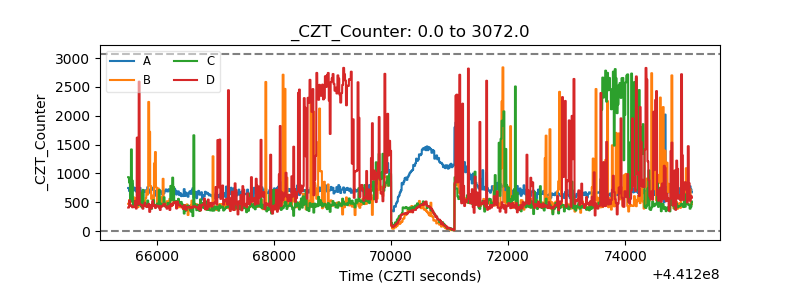 |
| +2.5 Volts monitor | 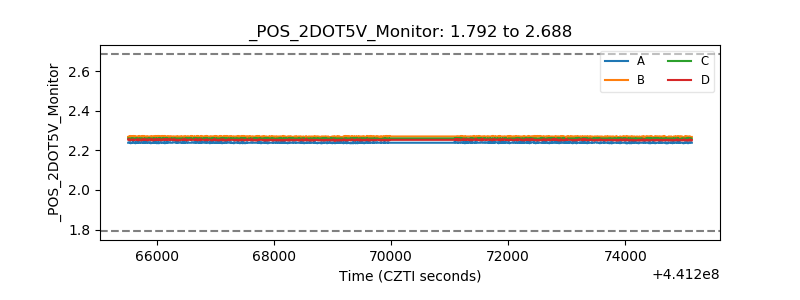 |
| +5 Volts monitor | 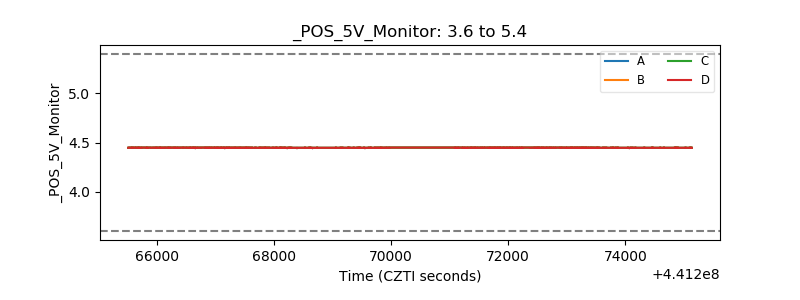 |
| _ROLL_ROT | 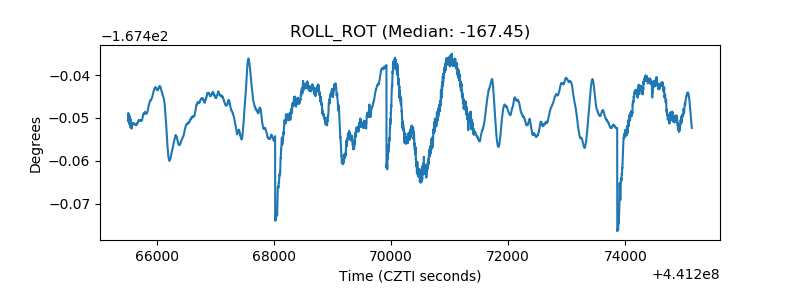 |
| _Roll_DEC | 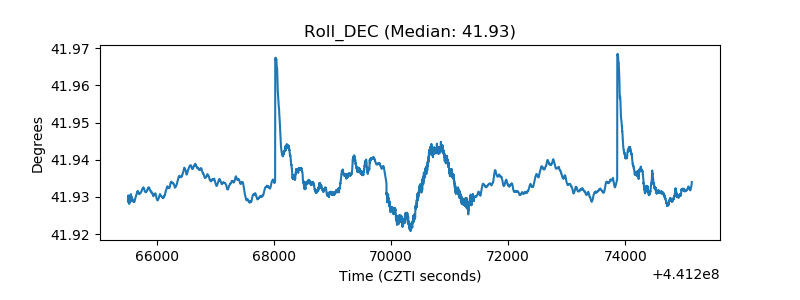 |
| _Roll_RA | 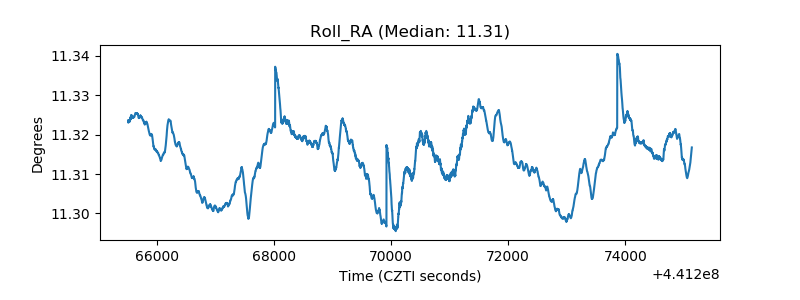 |
| Veto Counter | 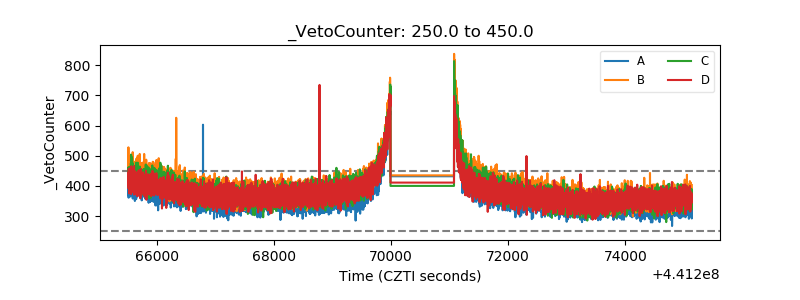 |