| Param | Original file | Final file |
|---|---|---|
| Filename | modeM0/AS1A13_009T03_9000006006_44584cztM0_level2.fits | modeM0/AS1A13_009T03_9000006006_44584cztM0_level2_quad_clean.evt |
| Size (bytes) | 122,699,520 | 27,296,640 |
| Size | 117.0 MB | 26.0 MB |
| Events in quadrant A | 1,152,652 | 182,843 |
| Events in quadrant B | 893,920 | 187,329 |
| Events in quadrant C | 952,005 | 176,853 |
| Events in quadrant D | 1,409,307 | 155,548 |
| Mode SS | |||
|---|---|---|---|
| Quadrant | BADHDUFLAG | Total packets | Discarded packets |
| A | 0 | 34 | 0 |
| B | 0 | 34 | 0 |
| C | 0 | 34 | 0 |
| D | 0 | 34 | 0 |
| Mode M0 | |||
|---|---|---|---|
| Quadrant | BADHDUFLAG | Total packets | Discarded packets |
| A | 0 | 5000 | 4 |
| B | 0 | 3729 | 0 |
| C | 0 | 3903 | 1 |
| D | 0 | 5301 | 0 |
| Quadrant | Total seconds | Saturated seconds | Saturation percentage |
|---|---|---|---|
| A | 1687 | 4 | 0.237107% |
| B | 1689 | 38 | 2.249852% |
| C | 1688 | 61 | 3.613744% |
| D | 1689 | 151 | 8.940201% |
Noise dominated data is calculated using 1-second bins in cleaned event files. If a bin has >2000 counts, and if more than 50% of those come from <1% of pixels, then it is considered to be noise-dominated and hence unusable.
| Quadrant | # 1 sec bins | Bins with >0 counts | Bins with >2000 counts | High rate bins dominated by noise | Noise dominated (total time) | Noise dominated (detector-on time) | Marked lightcurve |
|---|---|---|---|---|---|---|---|
| A | 1689 | 1689 | 0 | 0 | 0.00% | 0.00% | 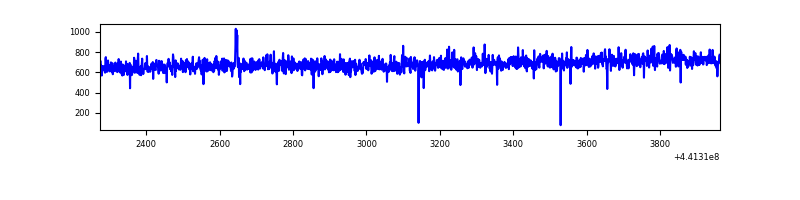 |
| B | 1689 | 1689 | 19 | 19 | 1.12% | 1.12% | 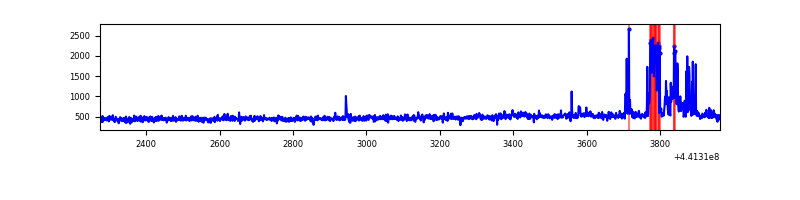 |
| C | 1689 | 1689 | 48 | 48 | 2.84% | 2.84% | 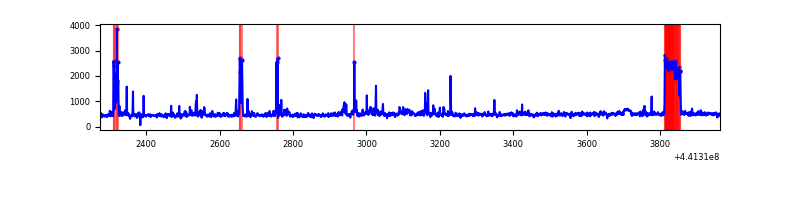 |
| D | 1689 | 1689 | 134 | 134 | 7.93% | 7.93% | 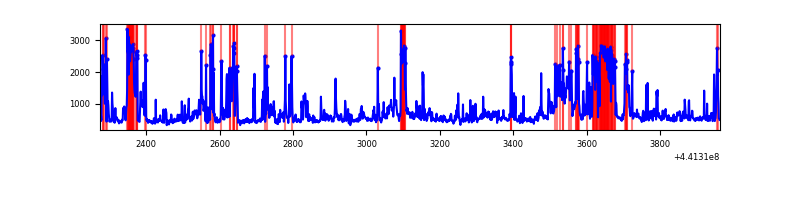 |
Top three noisy pixels from each quadrant. If the there are fewer than three noisy pixels in the level2.evt file, extra rows are filled as -1
| Pixel properties | Quadrant properties | ||||||
|---|---|---|---|---|---|---|---|
| Quadrant | DetID | PixID | Counts | Sigma | Mean | Median | Sigma |
| A | 10 | 83 | 378731 | 8697.41 | 199 | 194 | 43.5 |
| A | 15 | 254 | 2477 | 52.46 | 199 | 194 | 43.5 |
| A | 3 | 137 | 2423 | 51.21 | 199 | 194 | 43.5 |
| B | 5 | 172 | 96856 | 2334.12 | 198 | 192 | 41.4 |
| B | 3 | 112 | 8897 | 210.2 | 198 | 192 | 41.4 |
| B | 12 | 111 | 5253 | 122.21 | 198 | 192 | 41.4 |
| C | 3 | 233 | 96528 | 2021.91 | 193 | 193 | 47.6 |
| C | 12 | 2 | 73683 | 1542.43 | 193 | 193 | 47.6 |
| C | 14 | 254 | 23258 | 484.1 | 193 | 193 | 47.6 |
| D | 13 | 249 | 562557 | 11627.68 | 186 | 180 | 48.4 |
| D | 1 | 52 | 116058 | 2395.89 | 186 | 180 | 48.4 |
| D | 13 | 174 | 11483 | 233.7 | 186 | 180 | 48.4 |
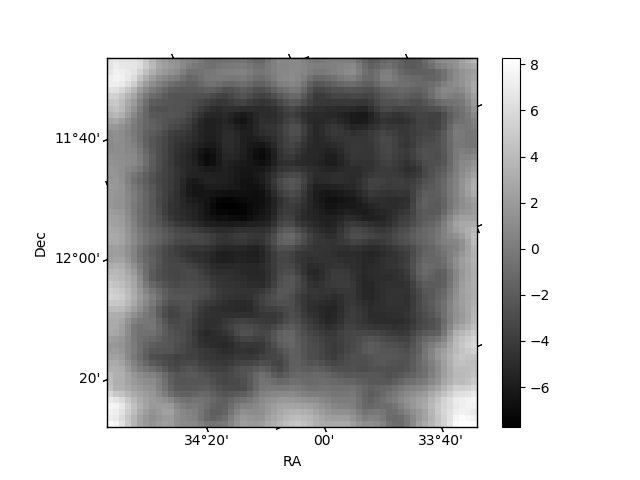
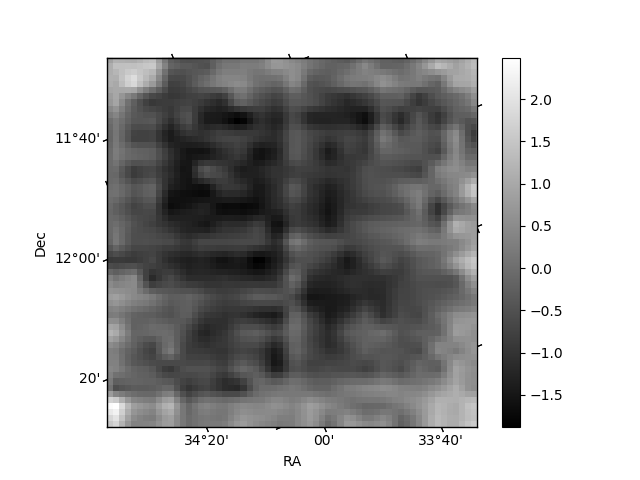
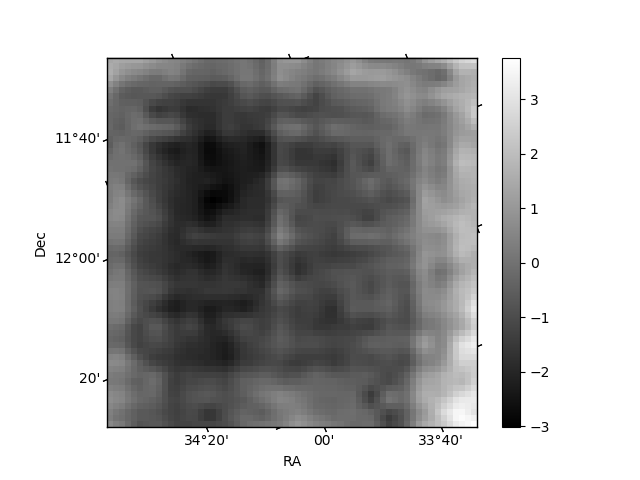
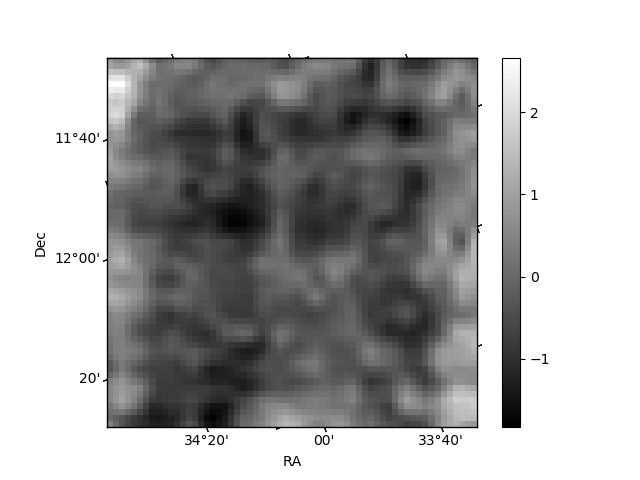
Histogram calculated using DETX and DETY for each event in the final _common_clean file
| Quadrant A | 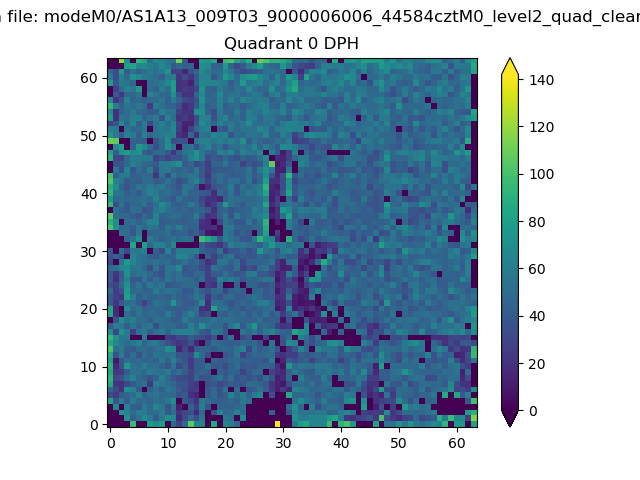 |
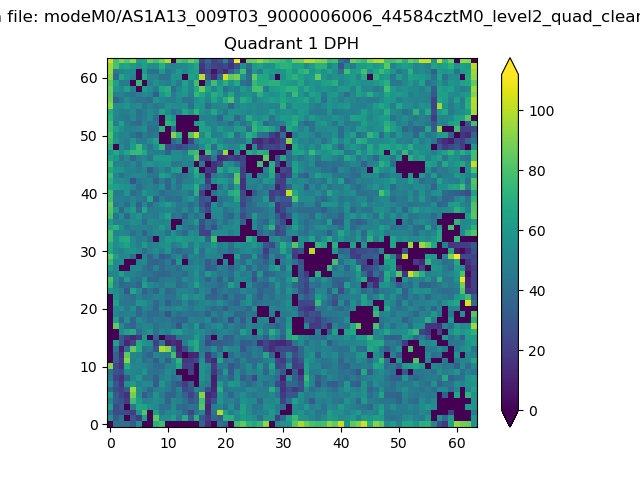 |
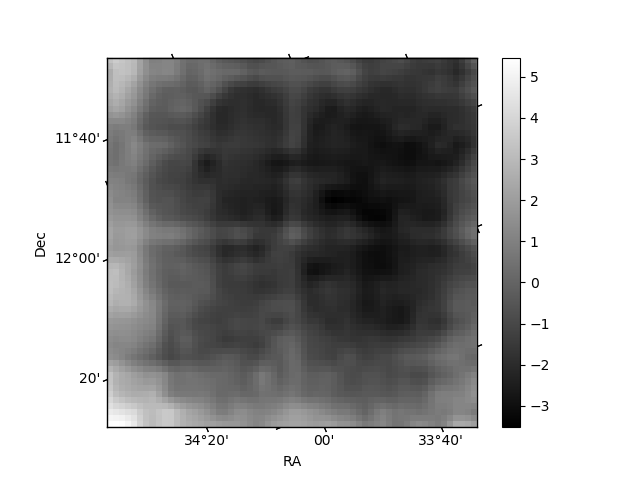
Quadrant B |
|---|---|---|---|
| Quadrant D | 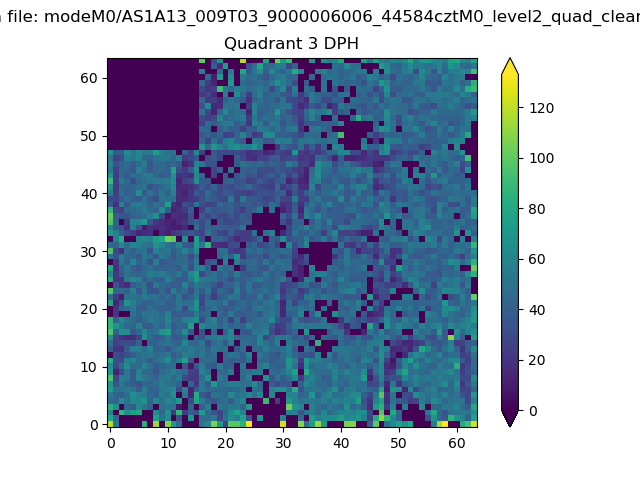 |
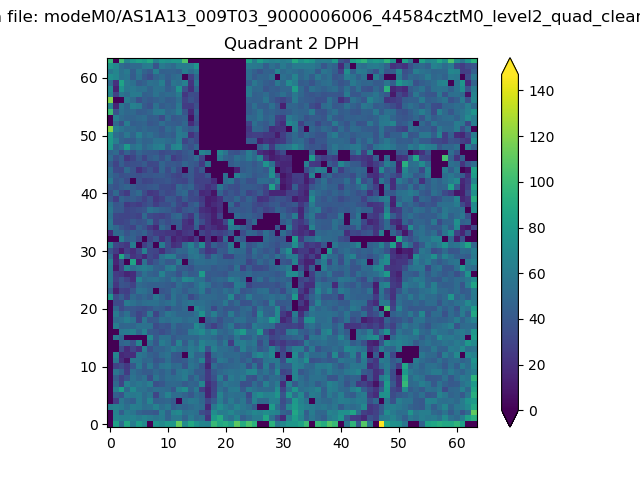 |
Quadrant C |
| Plot type | Count rate plots | Images |
|---|---|---|
| Comparison with Poisson distribution Blue bars denote a histogram of data divided into 1 sec bins. Red curve is a Poisson curve with rate = median count rate of data. |
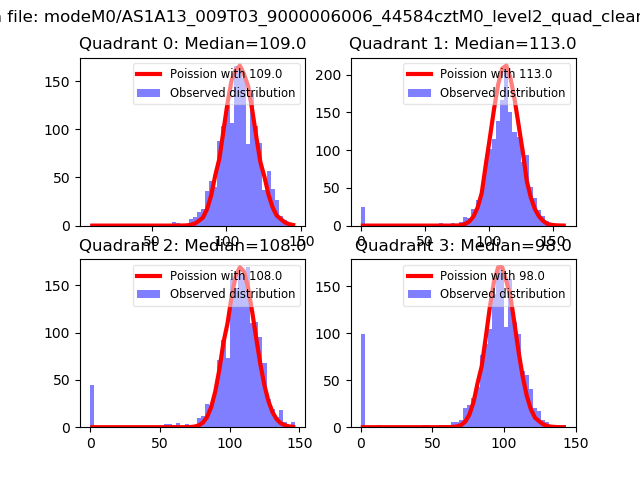 |
 |
| Quadrant-wise count rates Data is divided into 100 sec bins |
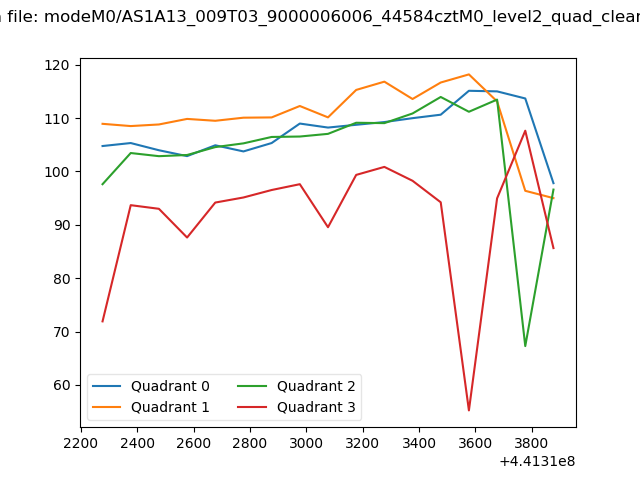 |
|
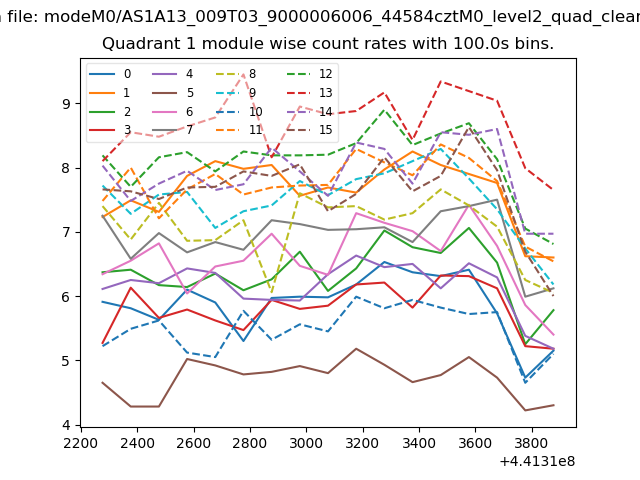
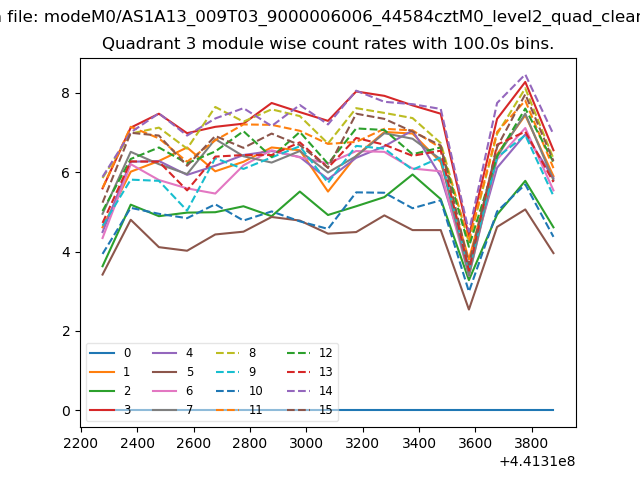
| Module-wise count rates for Quadrant A Data is divided into 100 sec bins |
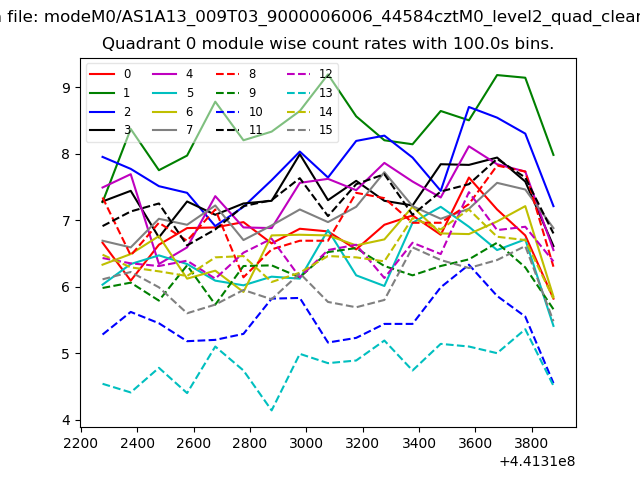 |
 |
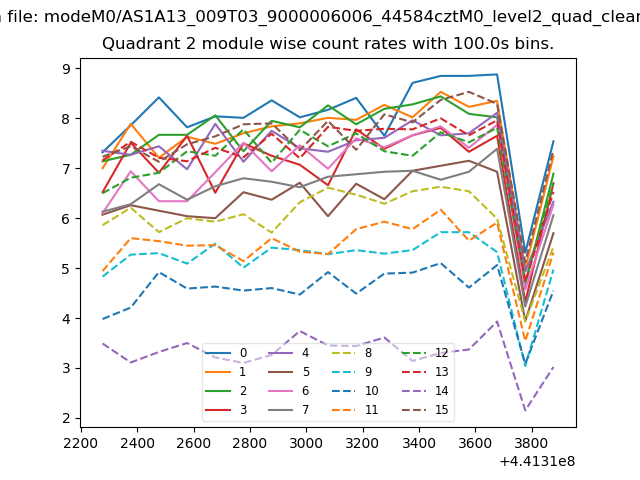
| Module-wise count rates for Quadrant B Data is divided into 100 sec bins |
 |
 |
| Module-wise count rates for Quadrant C Data is divided into 100 sec bins |
 |
 |
| Module-wise count rates for Quadrant D Data is divided into 100 sec bins |
 |
 |
| Parameter | Plot |
|---|---|
| CZT HV Monitor | 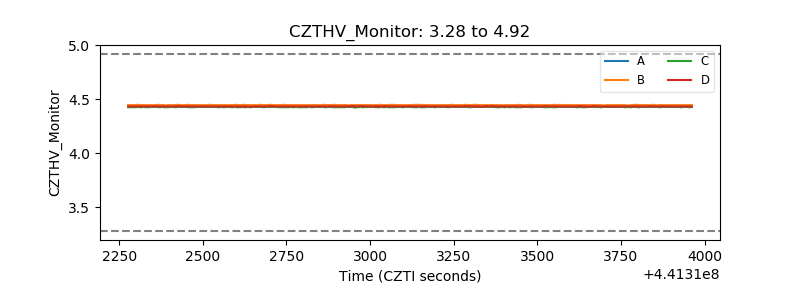 |
| D_VDD | 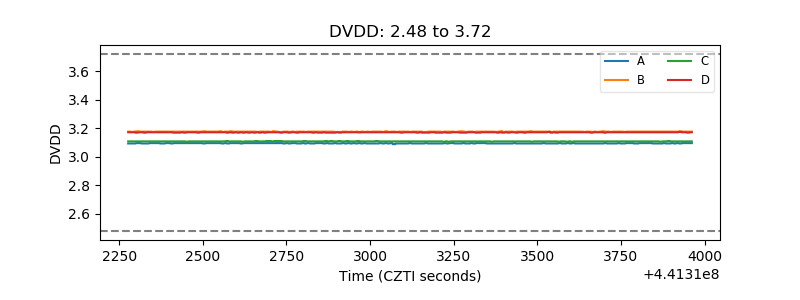 |
| Temperature 1 | 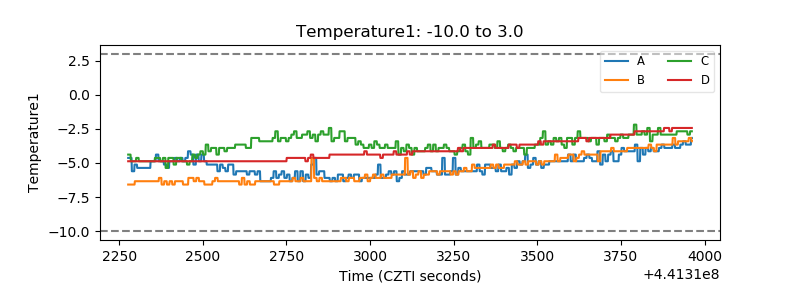 |
| Veto HV Monitor | 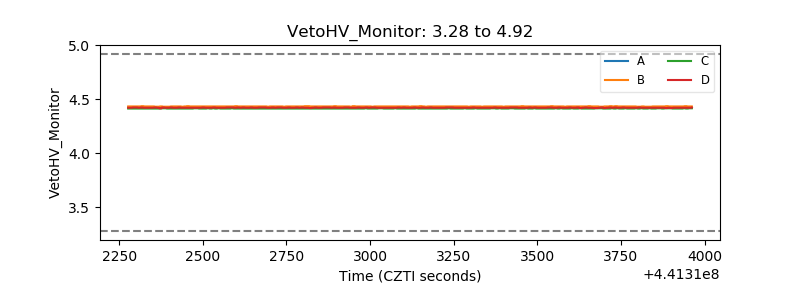 |
| Veto LLD | 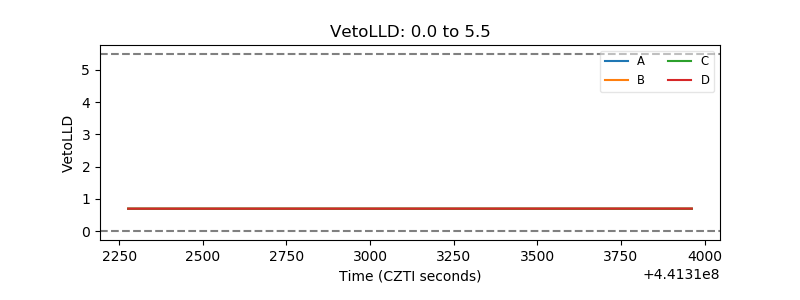 |
| Alpha Counter | 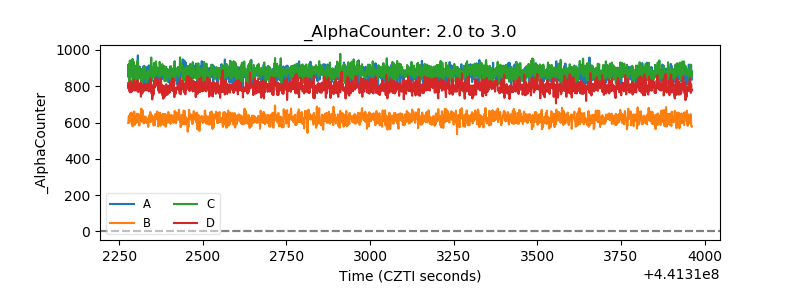 |
| _CPM_Rate |  |
| CZT Counter | 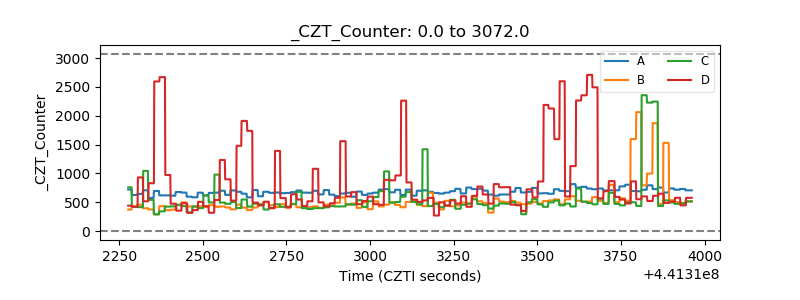 |
| +2.5 Volts monitor | 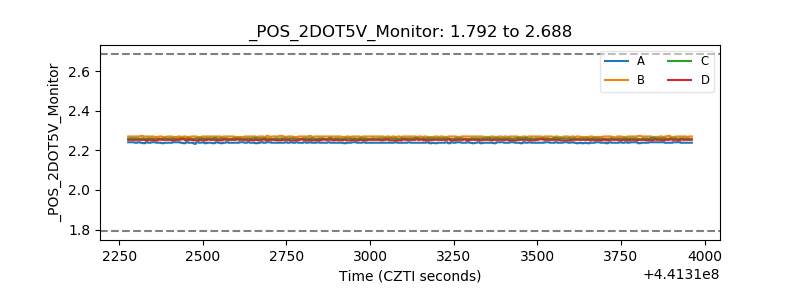 |
| +5 Volts monitor | 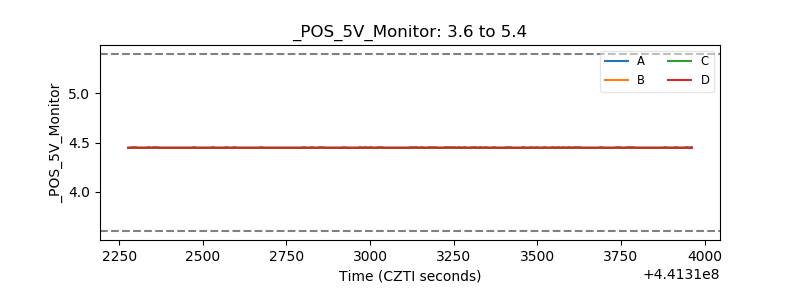 |
| _ROLL_ROT | 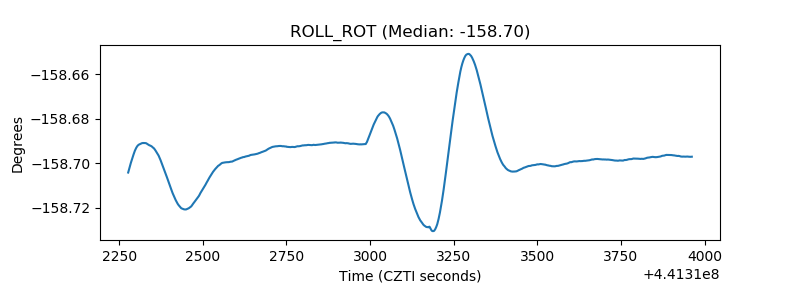 |
| _Roll_DEC | 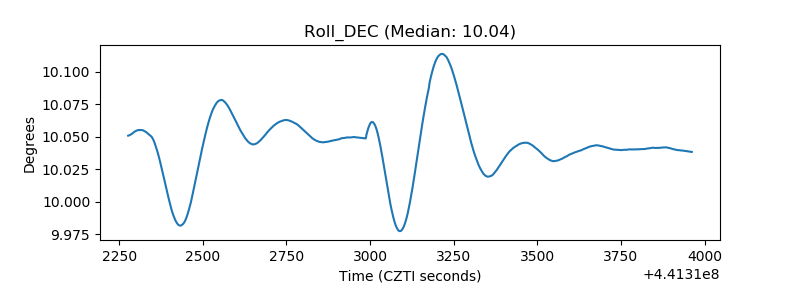 |
| _Roll_RA | 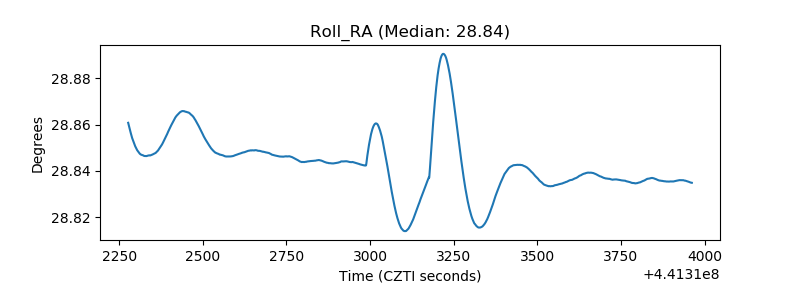 |
| Veto Counter | 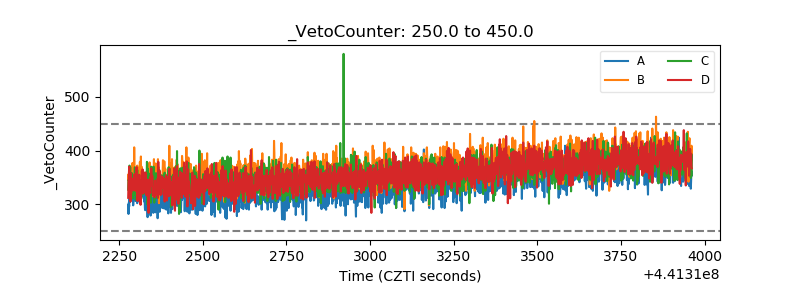 |