| Param | Original file | Final file |
|---|---|---|
| Filename | modeM0/AS1A13_009T03_9000006006_44587cztM0_level2.fits | modeM0/AS1A13_009T03_9000006006_44587cztM0_level2_quad_clean.evt |
| Size (bytes) | 492,327,360 | 116,133,120 |
| Size | 469.5 MB | 110.8 MB |
| Events in quadrant A | 5,251,114 | 787,051 |
| Events in quadrant B | 3,736,299 | 791,650 |
| Events in quadrant C | 3,959,567 | 751,064 |
| Events in quadrant D | 4,727,599 | 693,270 |
| Mode SS | |||
|---|---|---|---|
| Quadrant | BADHDUFLAG | Total packets | Discarded packets |
| A | 0 | 146 | 0 |
| B | 0 | 146 | 0 |
| C | 0 | 146 | 0 |
| D | 0 | 146 | 0 |
| Mode M9 | |||
|---|---|---|---|
| Quadrant | BADHDUFLAG | Total packets | Discarded packets |
| A | 0 | 20 | 0 |
| B | 0 | 20 | 0 |
| C | 0 | 20 | 0 |
| D | 0 | 20 | 0 |
| Mode M0 | |||
|---|---|---|---|
| Quadrant | BADHDUFLAG | Total packets | Discarded packets |
| A | 0 | 21629 | 2 |
| B | 0 | 15921 | 2 |
| C | 0 | 16550 | 2 |
| D | 0 | 18686 | 2 |
| Quadrant | Total seconds | Saturated seconds | Saturation percentage |
|---|---|---|---|
| A | 7081 | 124 | 1.751165% |
| B | 7082 | 192 | 2.711099% |
| C | 7082 | 179 | 2.527535% |
| D | 7082 | 224 | 3.162948% |
Noise dominated data is calculated using 1-second bins in cleaned event files. If a bin has >2000 counts, and if more than 50% of those come from <1% of pixels, then it is considered to be noise-dominated and hence unusable.
| Quadrant | # 1 sec bins | Bins with >0 counts | Bins with >2000 counts | High rate bins dominated by noise | Noise dominated (total time) | Noise dominated (detector-on time) | Marked lightcurve |
|---|---|---|---|---|---|---|---|
| A | 9091 | 7082 | 14 | 14 | 0.15% | 0.20% | 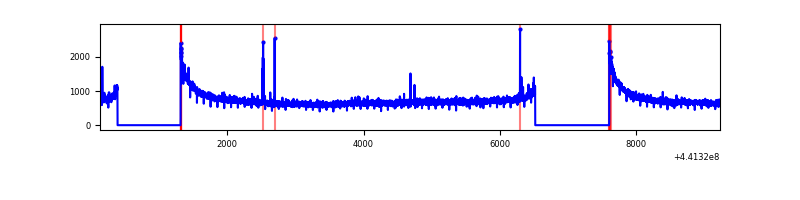 |
| B | 9092 | 7083 | 114 | 114 | 1.25% | 1.61% | 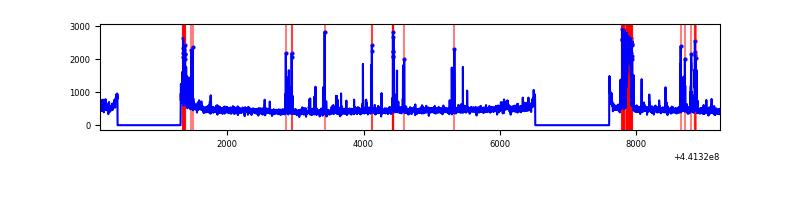 |
| C | 9092 | 7084 | 126 | 126 | 1.39% | 1.78% | 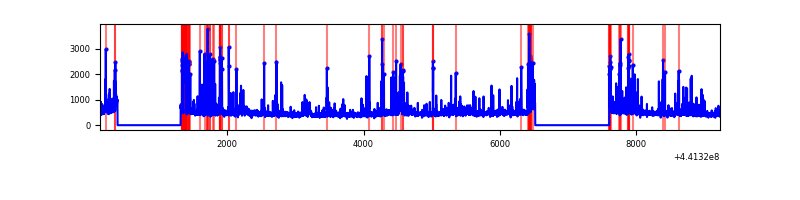 |
| D | 9092 | 7084 | 234 | 234 | 2.57% | 3.30% | 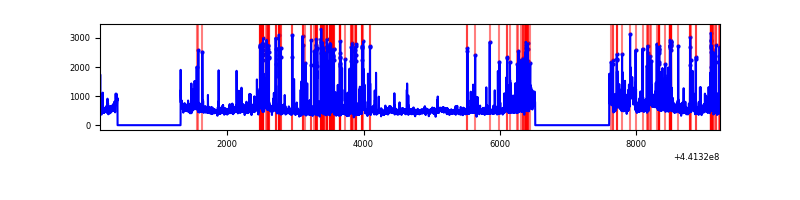 |
Top three noisy pixels from each quadrant. If the there are fewer than three noisy pixels in the level2.evt file, extra rows are filled as -1
| Pixel properties | Quadrant properties | ||||||
|---|---|---|---|---|---|---|---|
| Quadrant | DetID | PixID | Counts | Sigma | Mean | Median | Sigma |
| A | 10 | 83 | 2056170 | 12276.49 | 809 | 794 | 167.4 |
| A | 13 | 248 | 39394 | 230.55 | 809 | 794 | 167.4 |
| A | 8 | 4 | 14510 | 81.92 | 809 | 794 | 167.4 |
| B | 5 | 32 | 242676 | 1556.78 | 801 | 779 | 155.4 |
| B | 5 | 172 | 157600 | 1009.26 | 801 | 779 | 155.4 |
| B | 0 | 186 | 77482 | 493.64 | 801 | 779 | 155.4 |
| C | 12 | 2 | 511602 | 2754.17 | 784 | 788 | 185.5 |
| C | 14 | 254 | 171055 | 918.03 | 784 | 788 | 185.5 |
| C | 3 | 233 | 85849 | 458.63 | 784 | 788 | 185.5 |
| D | 13 | 249 | 946333 | 4809.89 | 782 | 759 | 196.6 |
| D | 1 | 52 | 549638 | 2792.0 | 782 | 759 | 196.6 |
| D | 12 | 17 | 71377 | 359.22 | 782 | 759 | 196.6 |
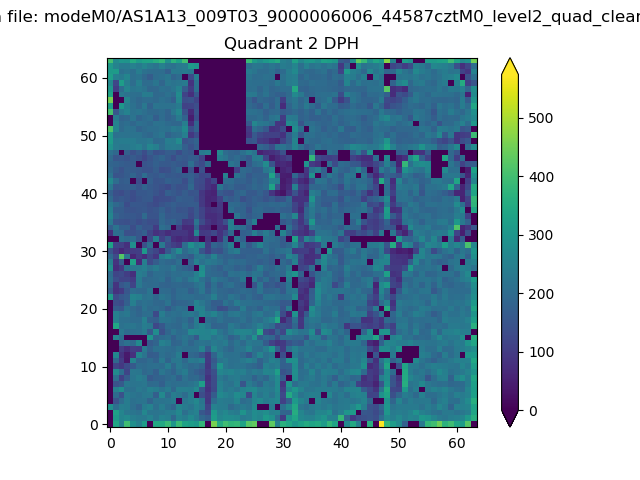
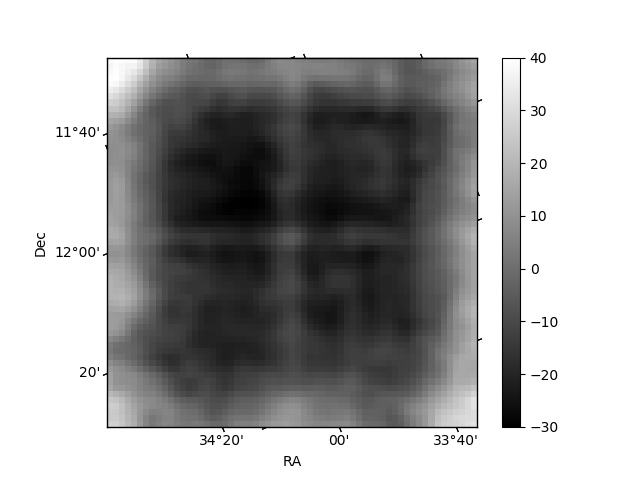
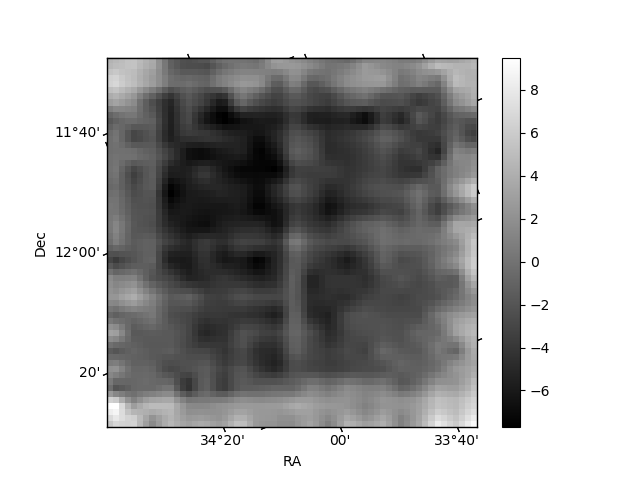
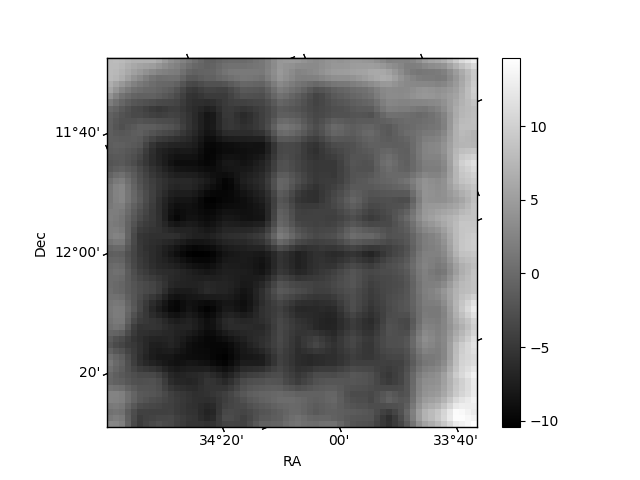
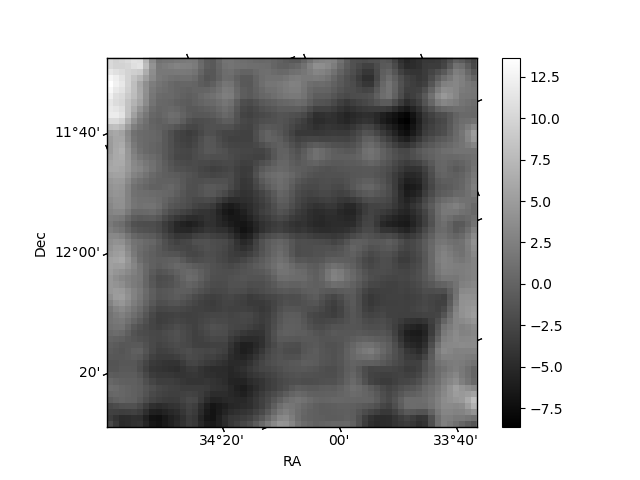
Histogram calculated using DETX and DETY for each event in the final _common_clean file
| Quadrant A | 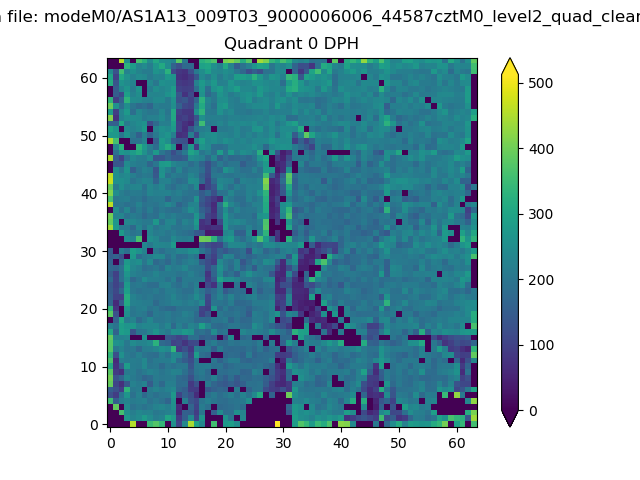 |
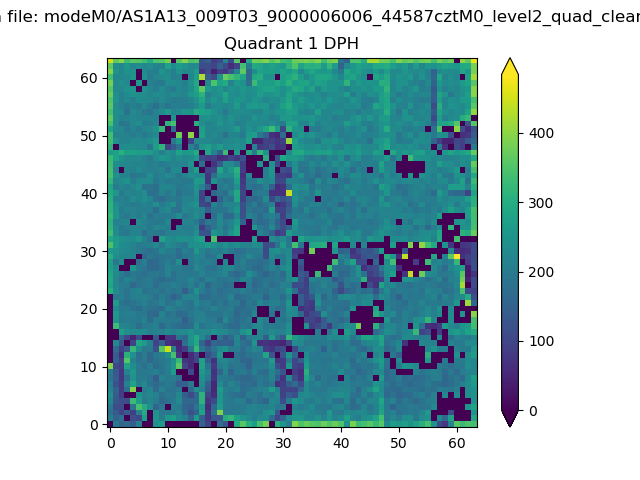 |
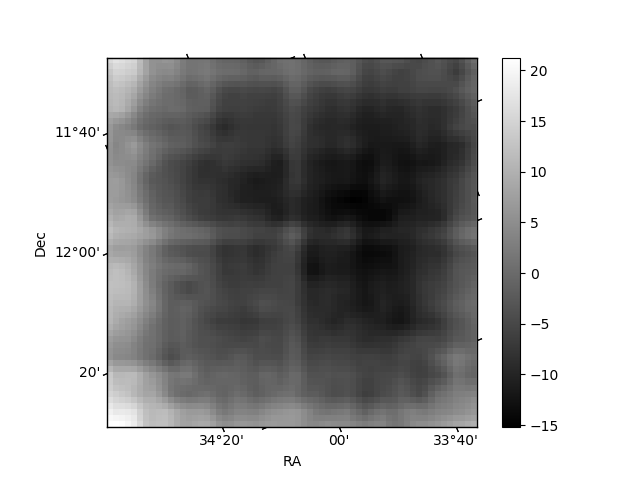
Quadrant B |
|---|---|---|---|
| Quadrant D | 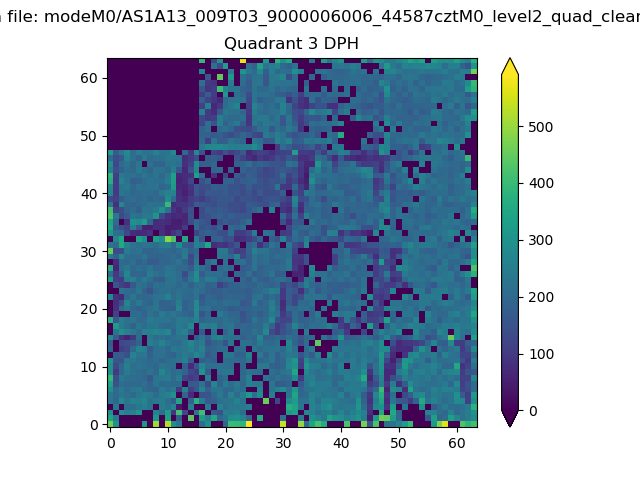 |
 |
Quadrant C |
| Plot type | Count rate plots | Images |
|---|---|---|
| Comparison with Poisson distribution Blue bars denote a histogram of data divided into 1 sec bins. Red curve is a Poisson curve with rate = median count rate of data. |
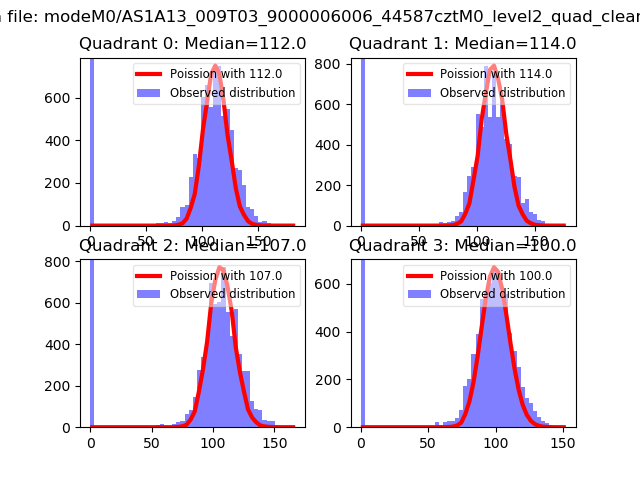 |
 |
| Quadrant-wise count rates Data is divided into 100 sec bins |
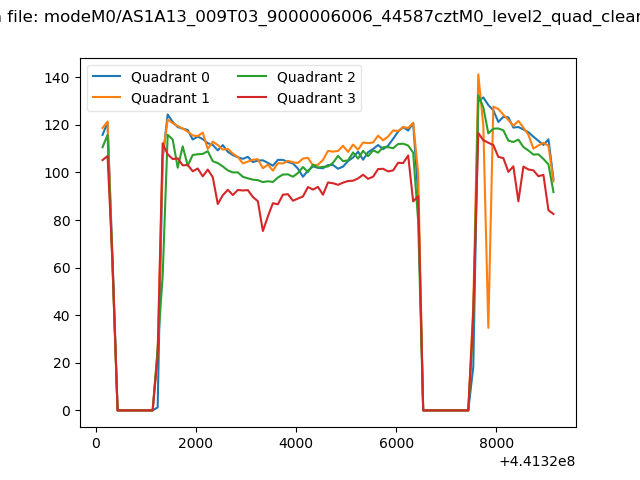 |
|
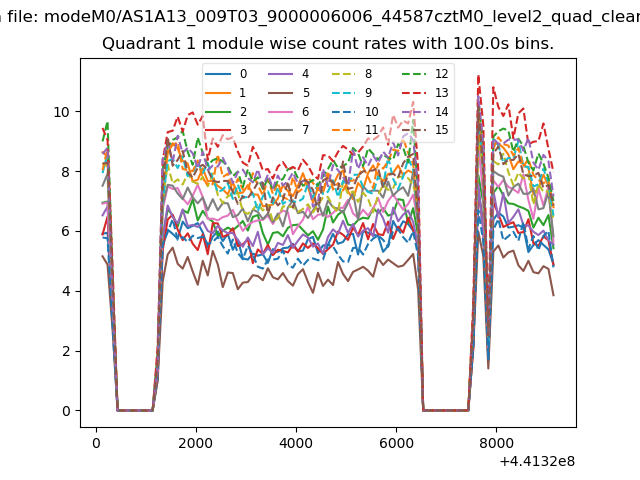
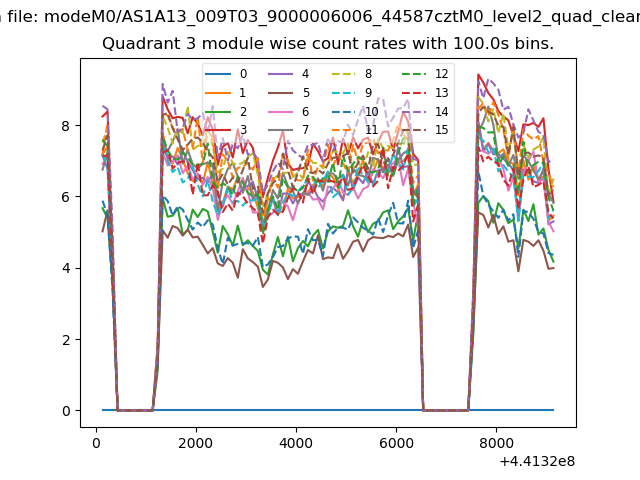
| Module-wise count rates for Quadrant A Data is divided into 100 sec bins |
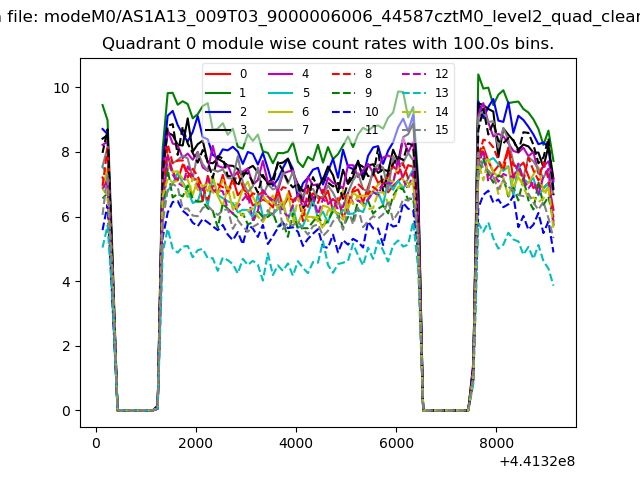 |
 |
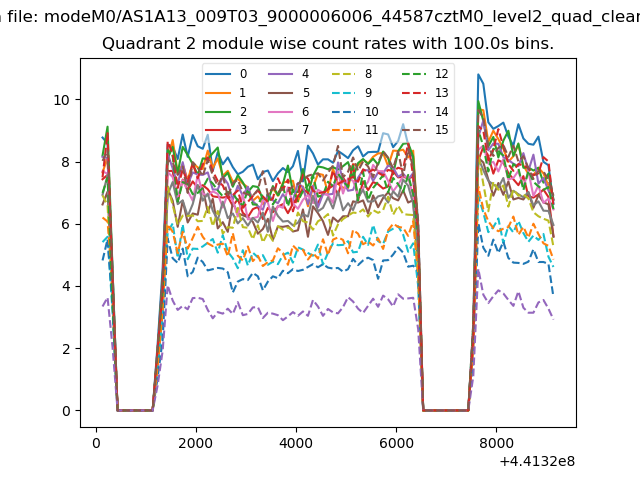
| Module-wise count rates for Quadrant B Data is divided into 100 sec bins |
 |
 |
| Module-wise count rates for Quadrant C Data is divided into 100 sec bins |
 |
 |
| Module-wise count rates for Quadrant D Data is divided into 100 sec bins |
 |
 |
| Parameter | Plot |
|---|---|
| CZT HV Monitor | 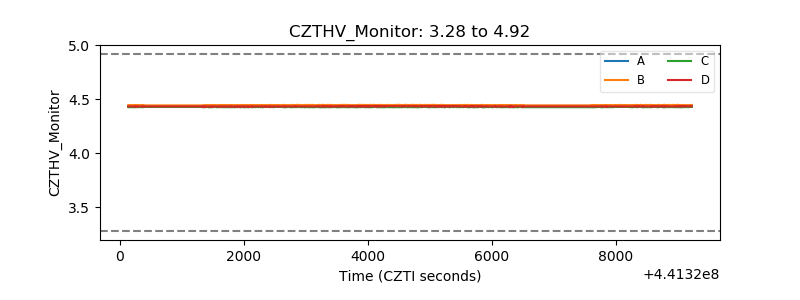 |
| D_VDD | 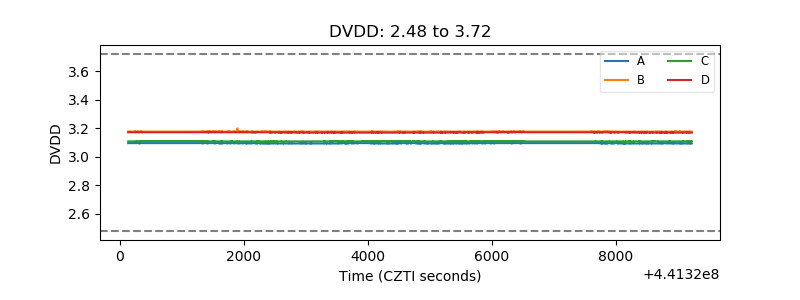 |
| Temperature 1 | 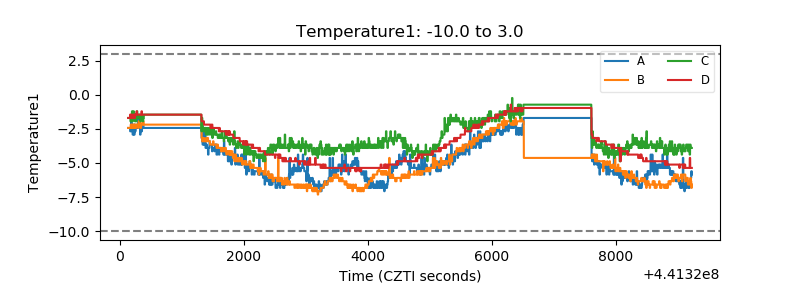 |
| Veto HV Monitor | 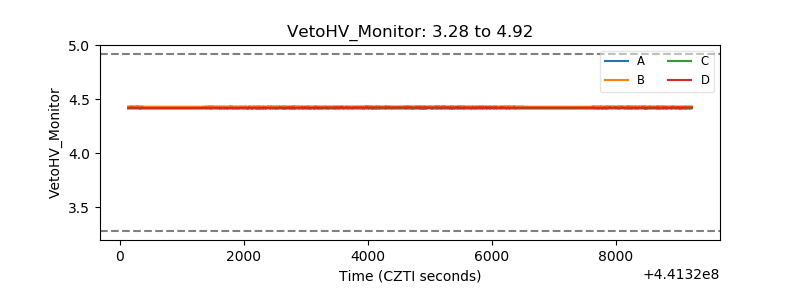 |
| Veto LLD | 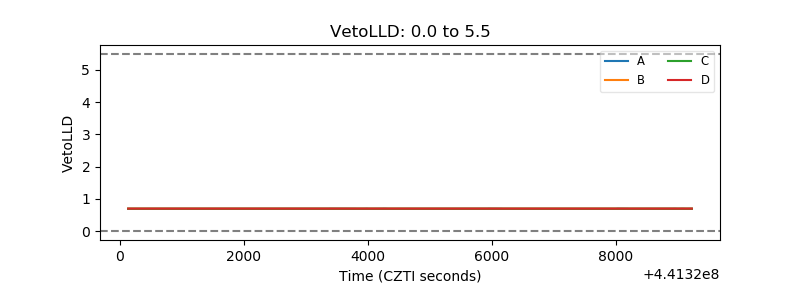 |
| Alpha Counter | 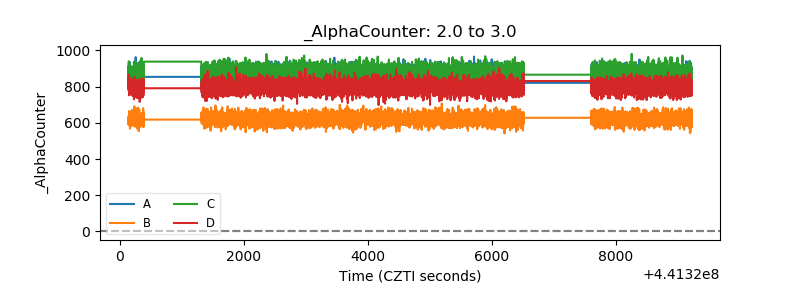 |
| _CPM_Rate | 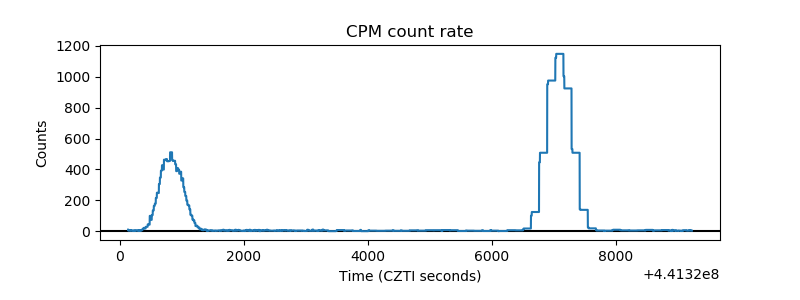 |
| CZT Counter | 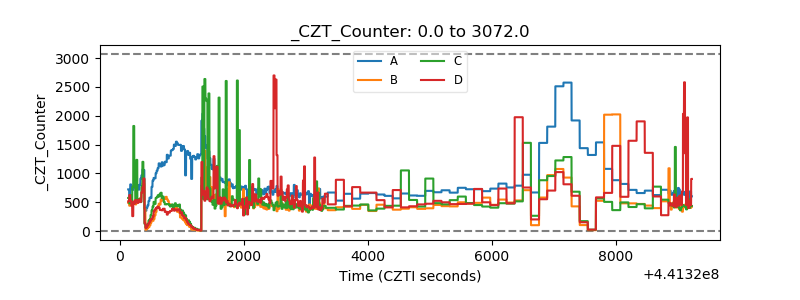 |
| +2.5 Volts monitor | 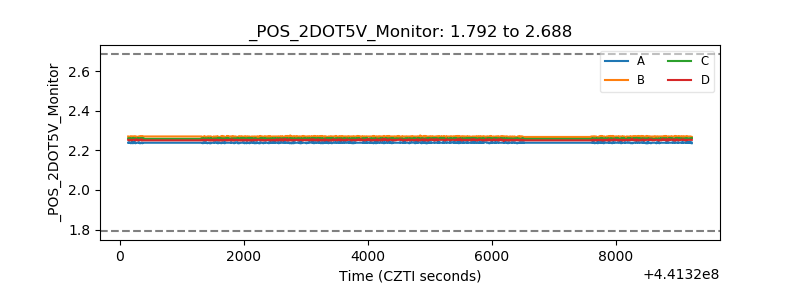 |
| +5 Volts monitor | 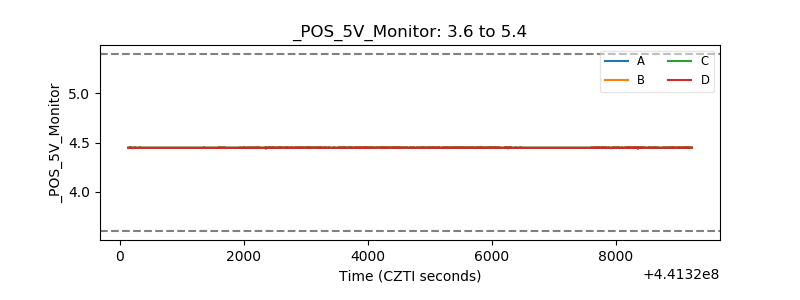 |
| _ROLL_ROT | 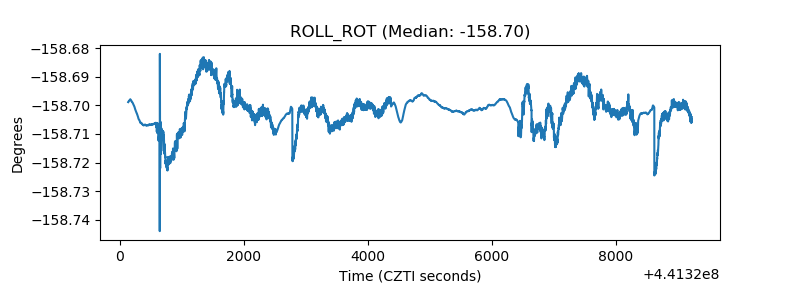 |
| _Roll_DEC | 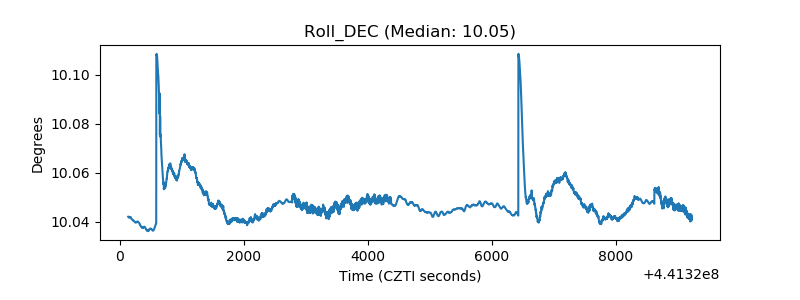 |
| _Roll_RA | 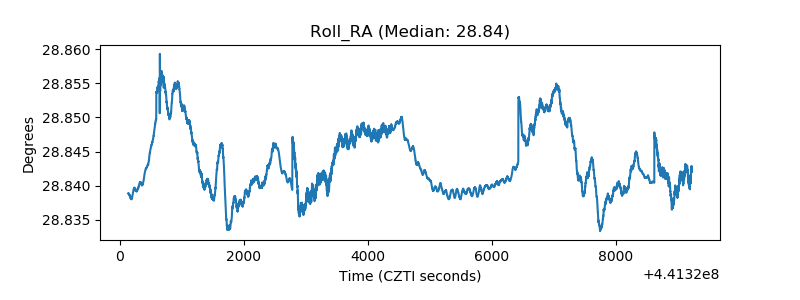 |
| Veto Counter | 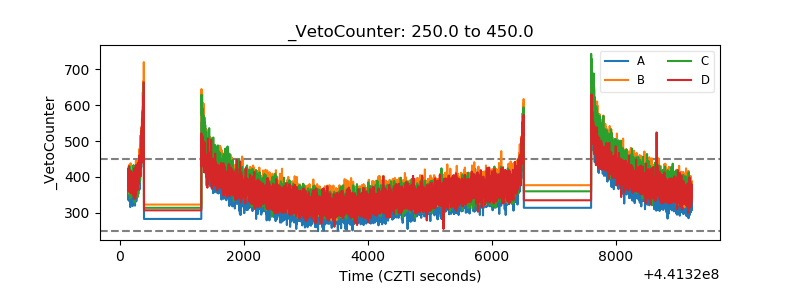 |