| Param | Original file | Final file |
|---|---|---|
| Filename | modeM0/AS1A13_009T03_9000006006_44590cztM0_level2.fits | modeM0/AS1A13_009T03_9000006006_44590cztM0_level2_quad_clean.evt |
| Size (bytes) | 479,315,520 | 118,411,200 |
| Size | 457.1 MB | 112.9 MB |
| Events in quadrant A | 5,114,837 | 803,361 |
| Events in quadrant B | 3,620,513 | 831,623 |
| Events in quadrant C | 4,051,697 | 782,996 |
| Events in quadrant D | 4,444,887 | 708,778 |
| Mode SS | |||
|---|---|---|---|
| Quadrant | BADHDUFLAG | Total packets | Discarded packets |
| A | 0 | 134 | 0 |
| B | 0 | 134 | 0 |
| C | 0 | 134 | 0 |
| D | 0 | 134 | 0 |
| Mode M9 | |||
|---|---|---|---|
| Quadrant | BADHDUFLAG | Total packets | Discarded packets |
| A | 0 | 13 | 0 |
| B | 0 | 14 | 0 |
| C | 0 | 14 | 0 |
| D | 0 | 14 | 0 |
| Mode M0 | |||
|---|---|---|---|
| Quadrant | BADHDUFLAG | Total packets | Discarded packets |
| A | 0 | 20752 | 2 |
| B | 0 | 14801 | 2 |
| C | 0 | 16207 | 2 |
| D | 0 | 17314 | 2 |
| Quadrant | Total seconds | Saturated seconds | Saturation percentage |
|---|---|---|---|
| A | 6580 | 179 | 2.720365% |
| B | 6580 | 197 | 2.993921% |
| C | 6580 | 197 | 2.993921% |
| D | 6580 | 303 | 4.604863% |
Noise dominated data is calculated using 1-second bins in cleaned event files. If a bin has >2000 counts, and if more than 50% of those come from <1% of pixels, then it is considered to be noise-dominated and hence unusable.
| Quadrant | # 1 sec bins | Bins with >0 counts | Bins with >2000 counts | High rate bins dominated by noise | Noise dominated (total time) | Noise dominated (detector-on time) | Marked lightcurve |
|---|---|---|---|---|---|---|---|
| A | 7830 | 6580 | 10 | 10 | 0.13% | 0.15% | 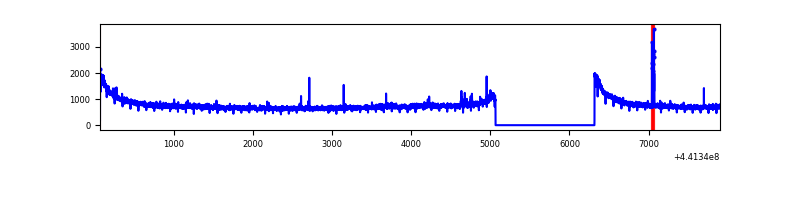 |
| B | 7830 | 6580 | 73 | 73 | 0.93% | 1.11% | 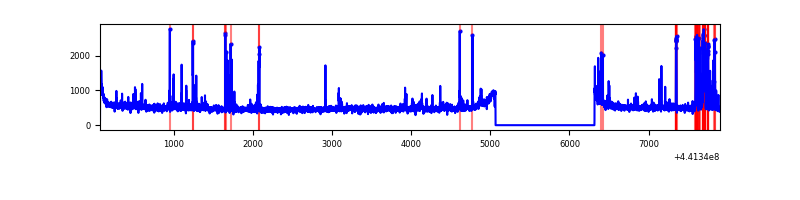 |
| C | 7830 | 6580 | 137 | 137 | 1.75% | 2.08% | 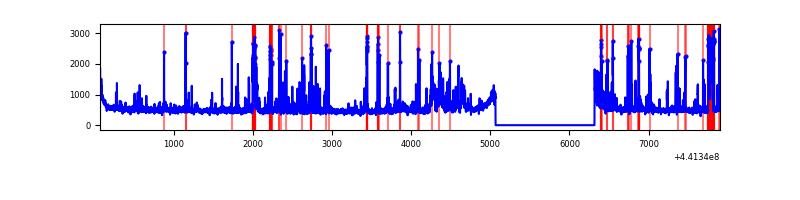 |
| D | 7830 | 6580 | 242 | 242 | 3.09% | 3.68% | 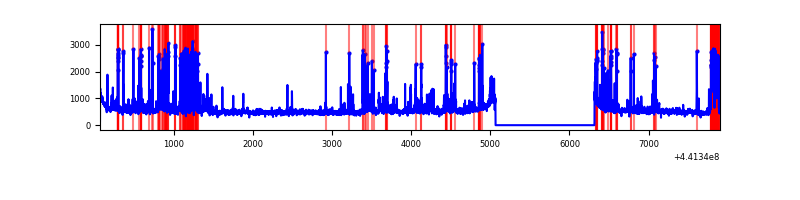 |
Top three noisy pixels from each quadrant. If the there are fewer than three noisy pixels in the level2.evt file, extra rows are filled as -1
| Pixel properties | Quadrant properties | ||||||
|---|---|---|---|---|---|---|---|
| Quadrant | DetID | PixID | Counts | Sigma | Mean | Median | Sigma |
| A | 10 | 83 | 1909859 | 11424.54 | 812 | 797 | 167.1 |
| A | 13 | 248 | 24268 | 140.46 | 812 | 797 | 167.1 |
| A | 10 | 248 | 21884 | 126.19 | 812 | 797 | 167.1 |
| B | 5 | 172 | 321046 | 2036.4 | 814 | 793 | 157.3 |
| B | 0 | 155 | 38857 | 242.04 | 814 | 793 | 157.3 |
| B | 0 | 186 | 25386 | 156.38 | 814 | 793 | 157.3 |
| C | 12 | 2 | 563706 | 3022.43 | 795 | 801 | 186.2 |
| C | 3 | 233 | 246963 | 1321.73 | 795 | 801 | 186.2 |
| C | 14 | 254 | 98089 | 522.37 | 795 | 801 | 186.2 |
| D | 13 | 249 | 481976 | 2420.62 | 785 | 762 | 198.8 |
| D | 1 | 52 | 428565 | 2151.95 | 785 | 762 | 198.8 |
| D | 2 | 249 | 268899 | 1348.79 | 785 | 762 | 198.8 |
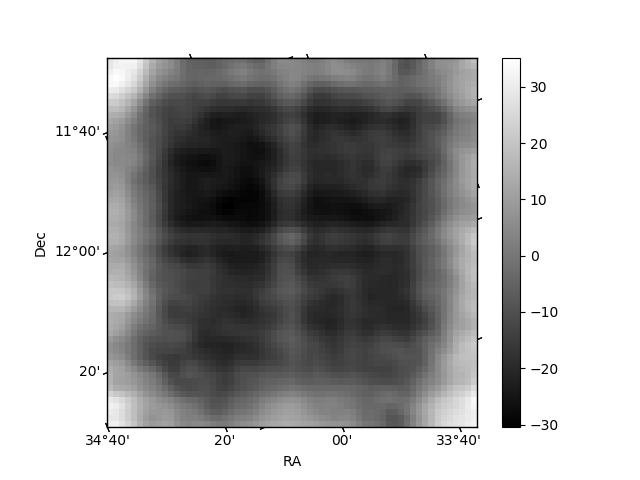
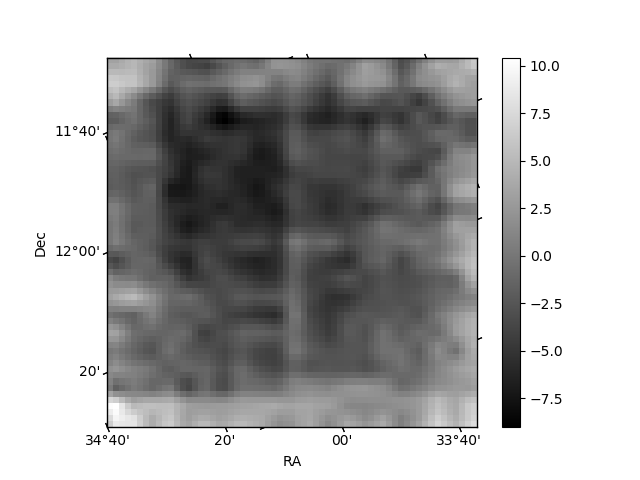
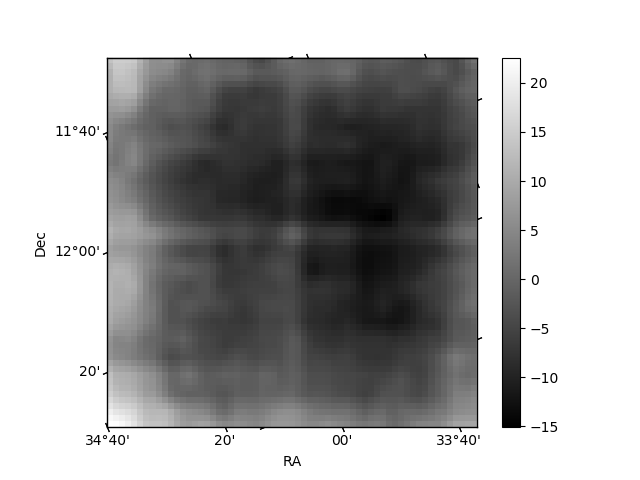
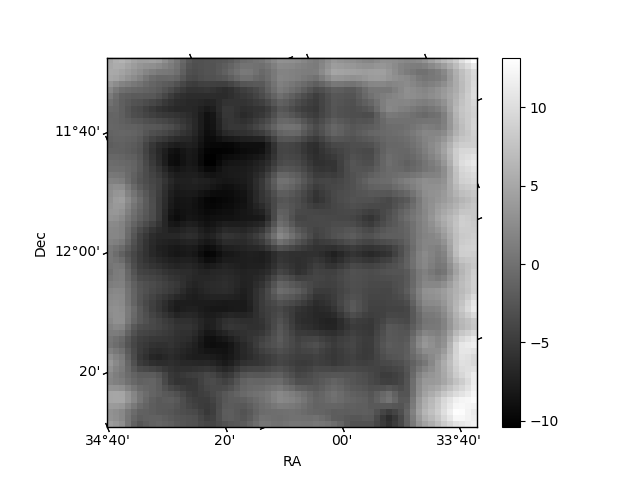
Histogram calculated using DETX and DETY for each event in the final _common_clean file
| Quadrant A | 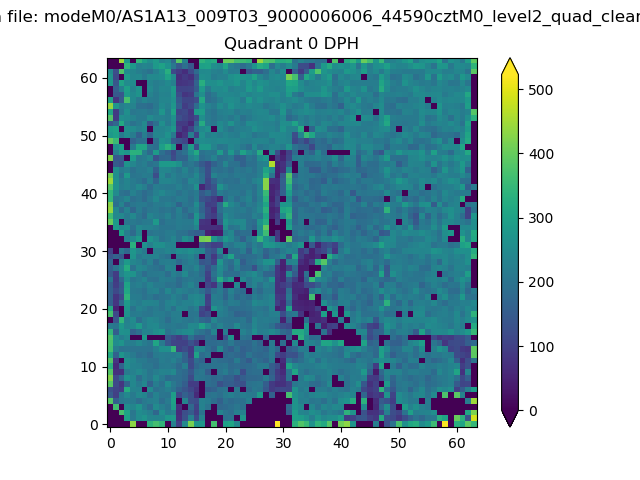 |
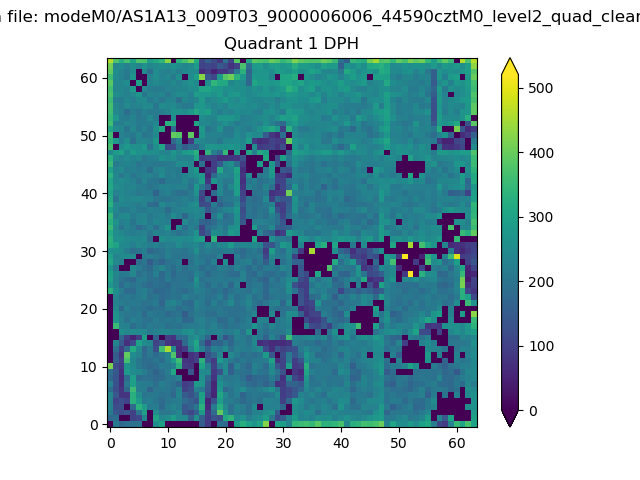 |
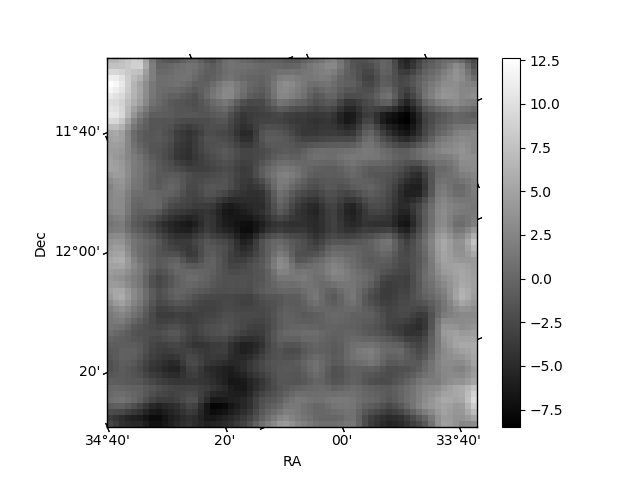
Quadrant B |
|---|---|---|---|
| Quadrant D | 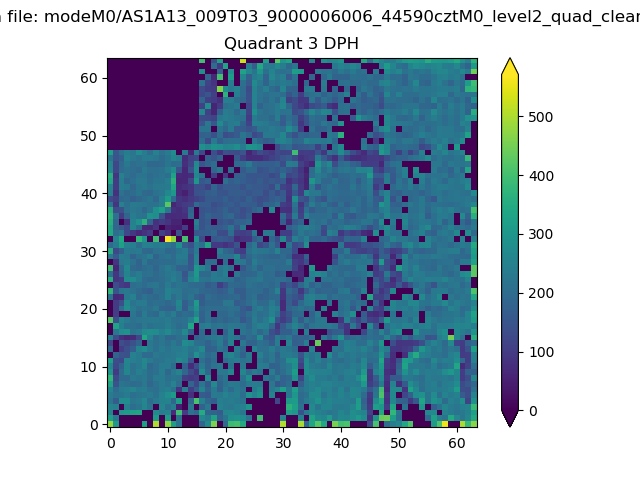 |
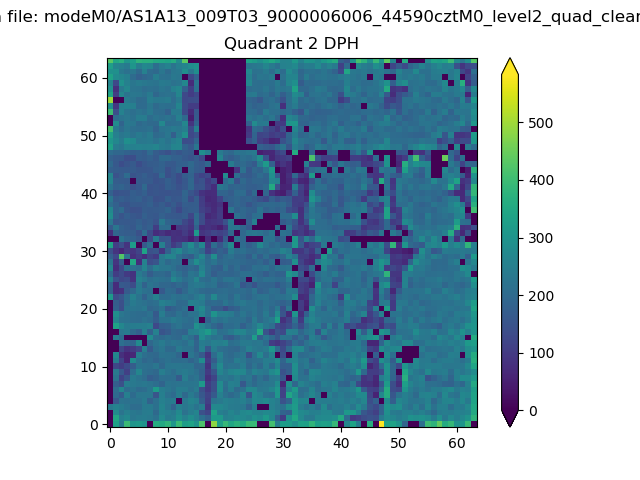 |
Quadrant C |
| Plot type | Count rate plots | Images |
|---|---|---|
| Comparison with Poisson distribution Blue bars denote a histogram of data divided into 1 sec bins. Red curve is a Poisson curve with rate = median count rate of data. |
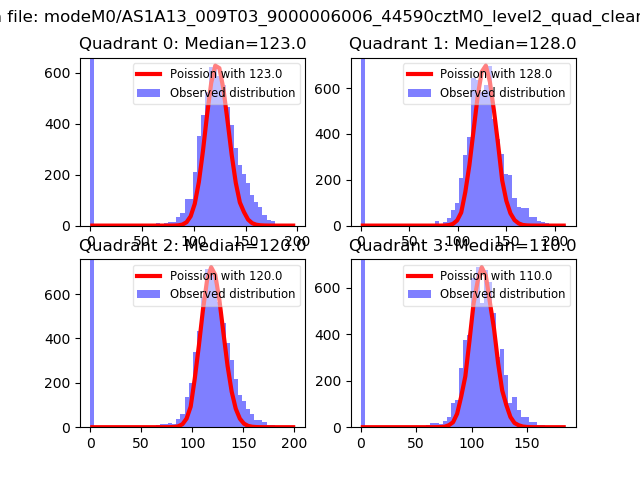 |
 |
| Quadrant-wise count rates Data is divided into 100 sec bins |
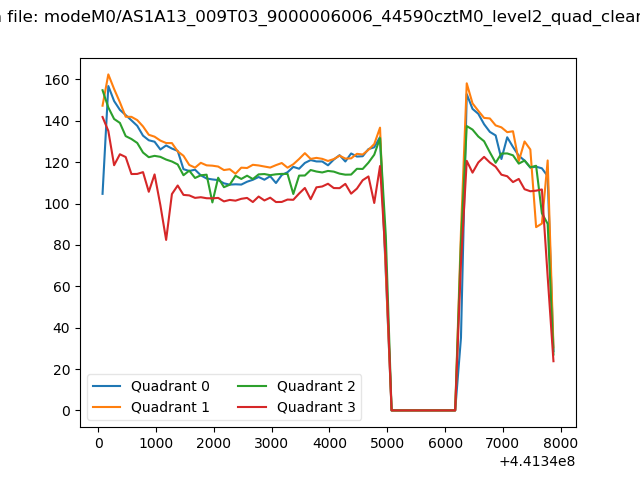 |
|
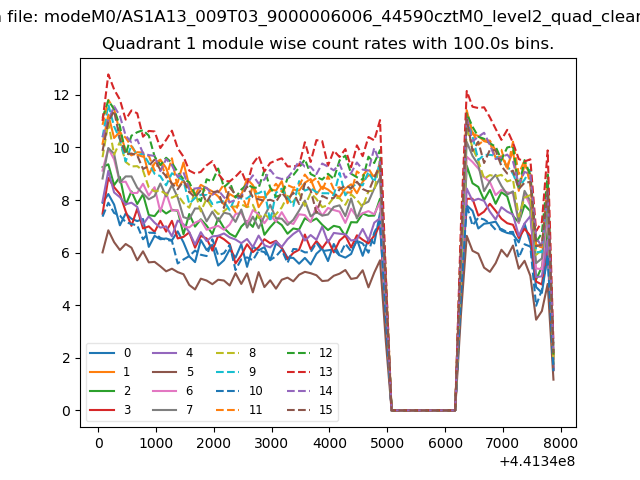
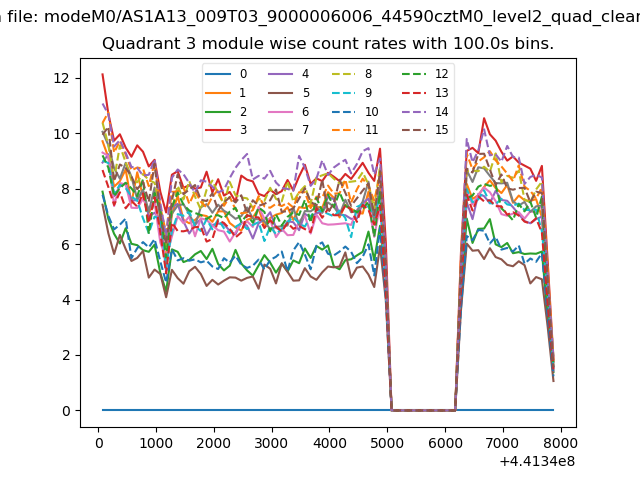
| Module-wise count rates for Quadrant A Data is divided into 100 sec bins |
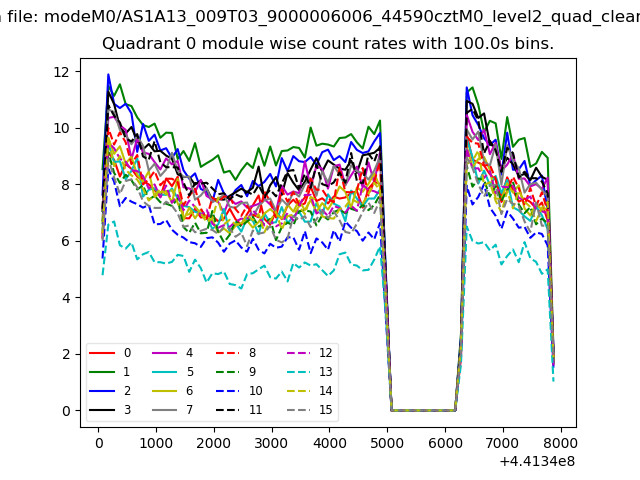 |
 |
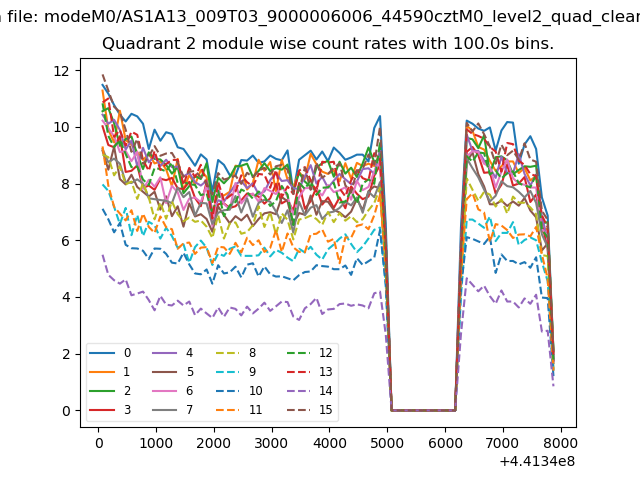
| Module-wise count rates for Quadrant B Data is divided into 100 sec bins |
 |
 |
| Module-wise count rates for Quadrant C Data is divided into 100 sec bins |
 |
 |
| Module-wise count rates for Quadrant D Data is divided into 100 sec bins |
 |
 |
| Parameter | Plot |
|---|---|
| CZT HV Monitor | 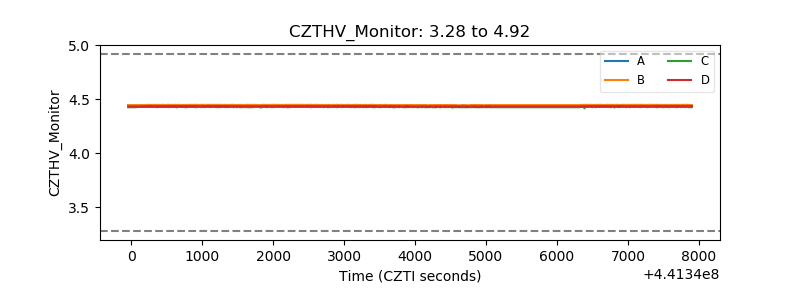 |
| D_VDD | 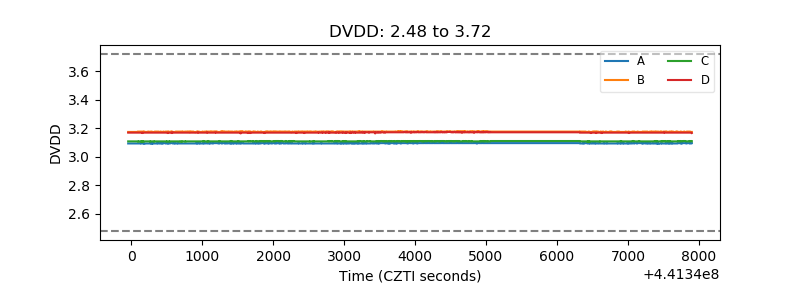 |
| Temperature 1 | 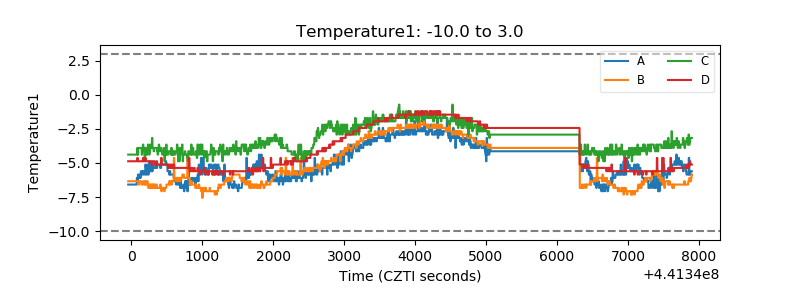 |
| Veto HV Monitor | 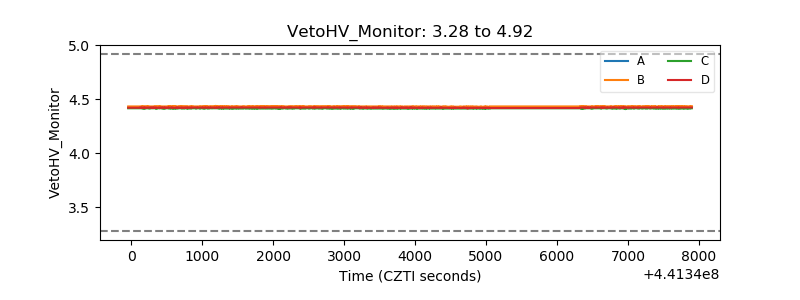 |
| Veto LLD | 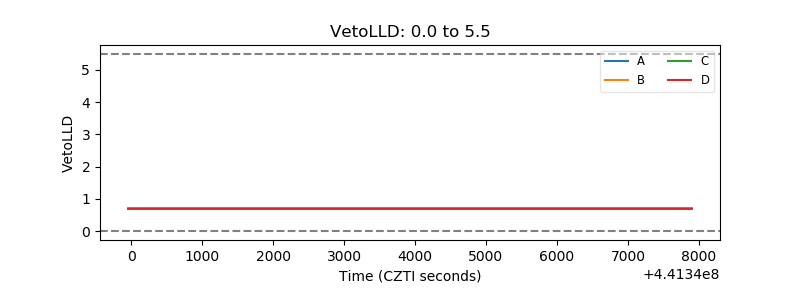 |
| Alpha Counter | 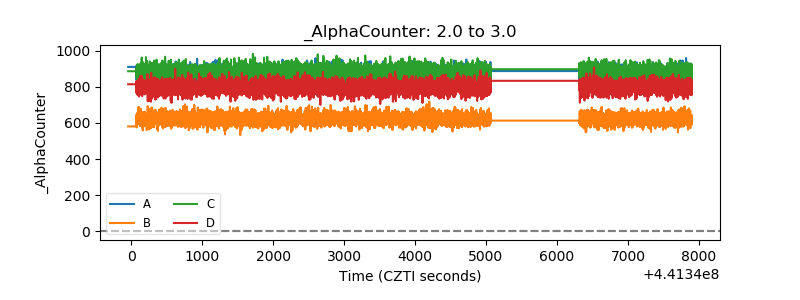 |
| _CPM_Rate | 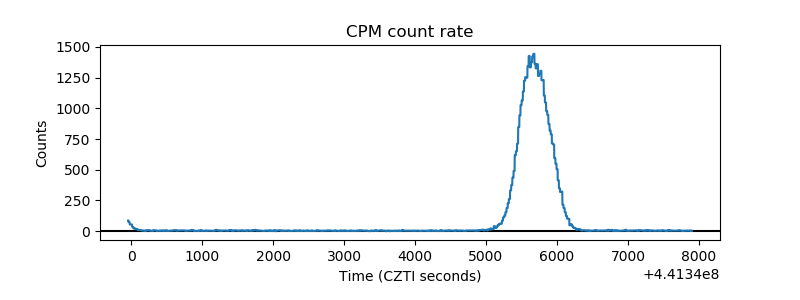 |
| CZT Counter | 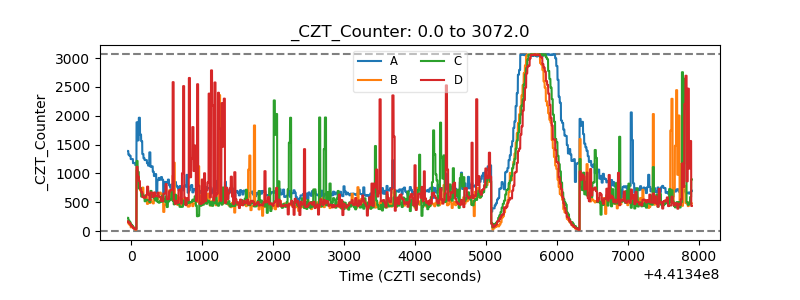 |
| +2.5 Volts monitor | 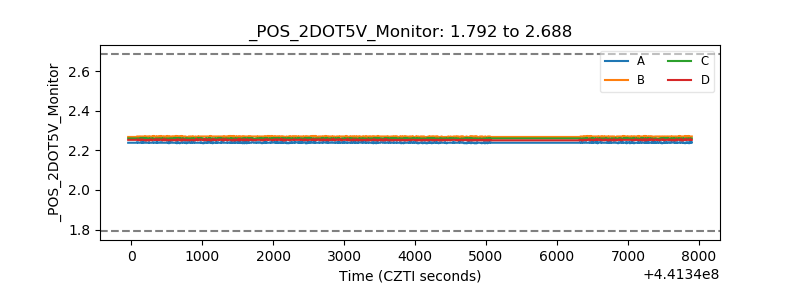 |
| +5 Volts monitor | 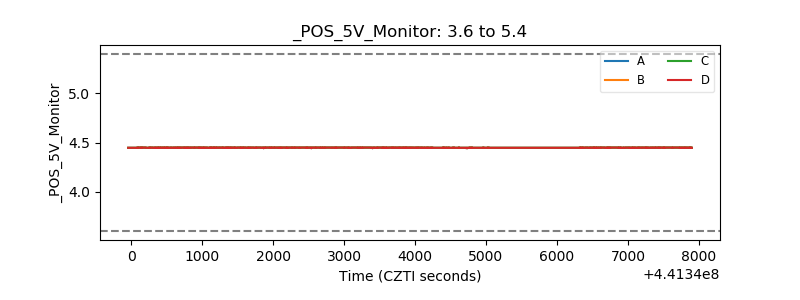 |
| _ROLL_ROT |  |
| _Roll_DEC | 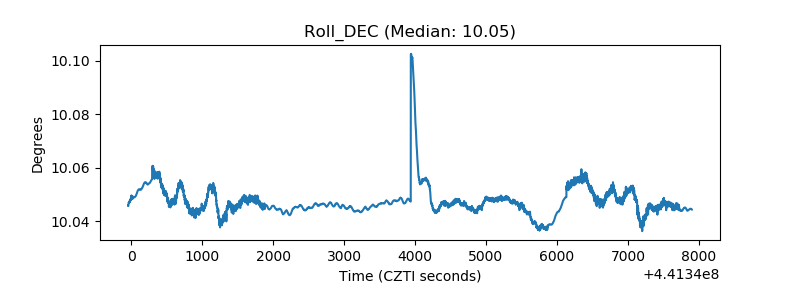 |
| _Roll_RA | 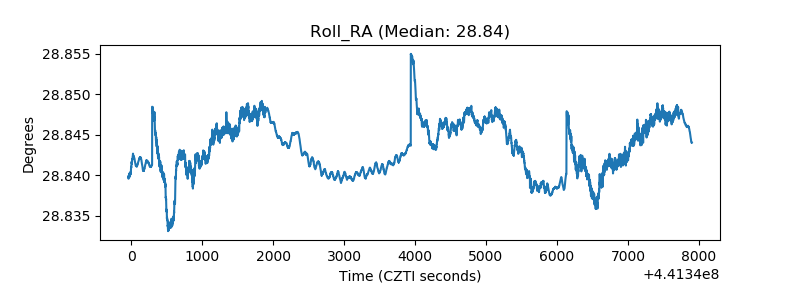 |
| Veto Counter | 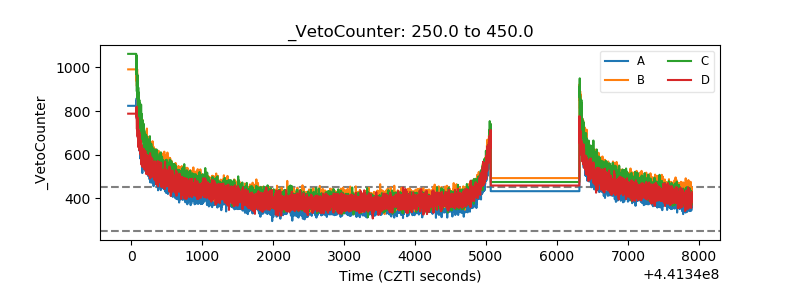 |