| Param | Original file | Final file |
|---|---|---|
| Filename | modeM0/AS1A13_009T03_9000006006_44591cztM0_level2.fits | modeM0/AS1A13_009T03_9000006006_44591cztM0_level2_quad_clean.evt |
| Size (bytes) | 450,167,040 | 105,073,920 |
| Size | 429.3 MB | 100.2 MB |
| Events in quadrant A | 4,618,058 | 713,474 |
| Events in quadrant B | 3,419,098 | 732,763 |
| Events in quadrant C | 3,729,845 | 688,844 |
| Events in quadrant D | 4,423,721 | 621,623 |
| Mode SS | |||
|---|---|---|---|
| Quadrant | BADHDUFLAG | Total packets | Discarded packets |
| A | 0 | 124 | 0 |
| B | 0 | 124 | 0 |
| C | 0 | 124 | 0 |
| D | 0 | 124 | 0 |
| Mode M9 | |||
|---|---|---|---|
| Quadrant | BADHDUFLAG | Total packets | Discarded packets |
| A | 0 | 11 | 0 |
| B | 0 | 11 | 0 |
| C | 0 | 11 | 0 |
| D | 0 | 11 | 0 |
| Mode M0 | |||
|---|---|---|---|
| Quadrant | BADHDUFLAG | Total packets | Discarded packets |
| A | 0 | 18913 | 3 |
| B | 0 | 13935 | 1 |
| C | 0 | 15050 | 1 |
| D | 0 | 17055 | 1 |
| Quadrant | Total seconds | Saturated seconds | Saturation percentage |
|---|---|---|---|
| A | 6086 | 171 | 2.809727% |
| B | 6087 | 270 | 4.435683% |
| C | 6087 | 282 | 4.632824% |
| D | 6087 | 411 | 6.752095% |
Noise dominated data is calculated using 1-second bins in cleaned event files. If a bin has >2000 counts, and if more than 50% of those come from <1% of pixels, then it is considered to be noise-dominated and hence unusable.
| Quadrant | # 1 sec bins | Bins with >0 counts | Bins with >2000 counts | High rate bins dominated by noise | Noise dominated (total time) | Noise dominated (detector-on time) | Marked lightcurve |
|---|---|---|---|---|---|---|---|
| A | 7237 | 6087 | 10 | 10 | 0.14% | 0.16% | 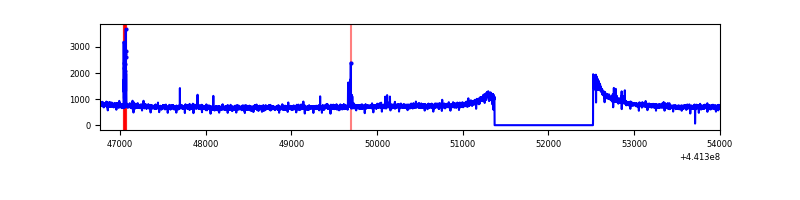 |
| B | 7238 | 6088 | 105 | 105 | 1.45% | 1.72% | 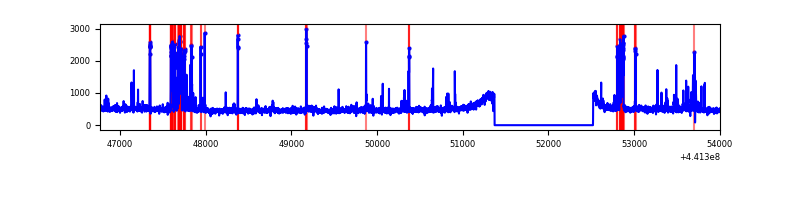 |
| C | 7238 | 6088 | 186 | 186 | 2.57% | 3.06% | 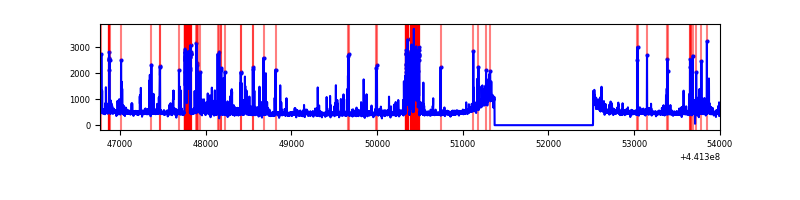 |
| D | 7238 | 6088 | 326 | 326 | 4.50% | 5.35% | 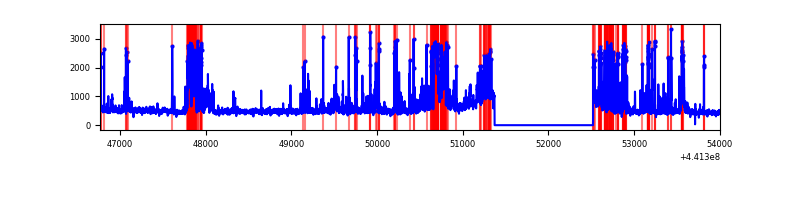 |
Top three noisy pixels from each quadrant. If the there are fewer than three noisy pixels in the level2.evt file, extra rows are filled as -1
| Pixel properties | Quadrant properties | ||||||
|---|---|---|---|---|---|---|---|
| Quadrant | DetID | PixID | Counts | Sigma | Mean | Median | Sigma |
| A | 10 | 83 | 1681550 | 10870.3 | 744 | 730 | 154.6 |
| A | 13 | 248 | 30535 | 192.76 | 744 | 730 | 154.6 |
| A | 4 | 0 | 20940 | 130.7 | 744 | 730 | 154.6 |
| B | 5 | 172 | 392724 | 2668.21 | 740 | 718 | 146.9 |
| B | 0 | 155 | 49588 | 332.64 | 740 | 718 | 146.9 |
| B | 0 | 186 | 20142 | 132.21 | 740 | 718 | 146.9 |
| C | 12 | 2 | 710141 | 4176.11 | 722 | 726 | 169.9 |
| C | 14 | 254 | 171576 | 1005.74 | 722 | 726 | 169.9 |
| C | 12 | 249 | 20023 | 113.6 | 722 | 726 | 169.9 |
| D | 13 | 249 | 839200 | 4783.42 | 708 | 691 | 175.3 |
| D | 2 | 249 | 344542 | 1961.56 | 708 | 691 | 175.3 |
| D | 1 | 52 | 270151 | 1537.18 | 708 | 691 | 175.3 |
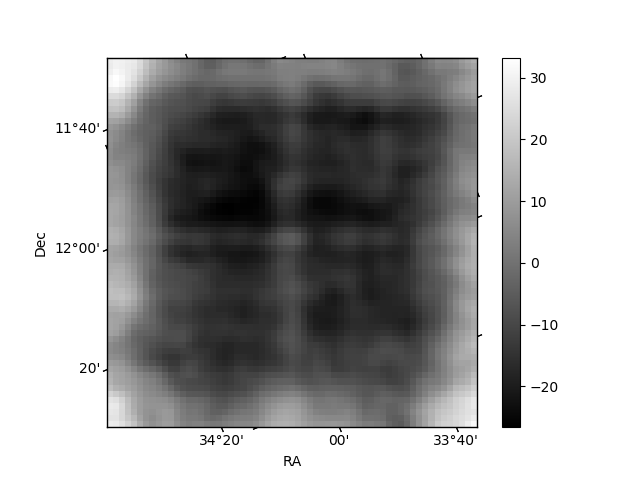
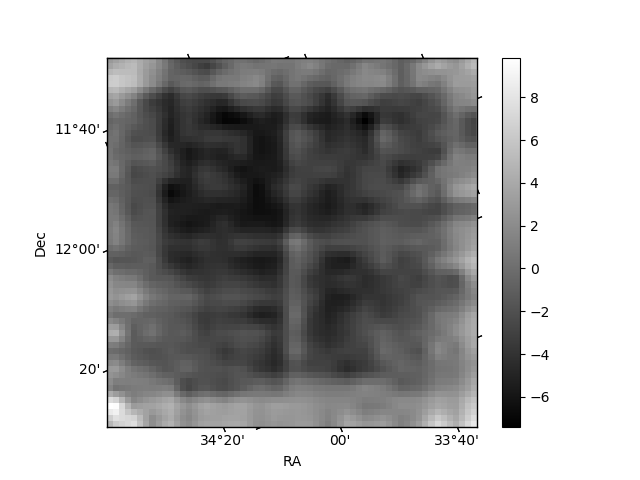
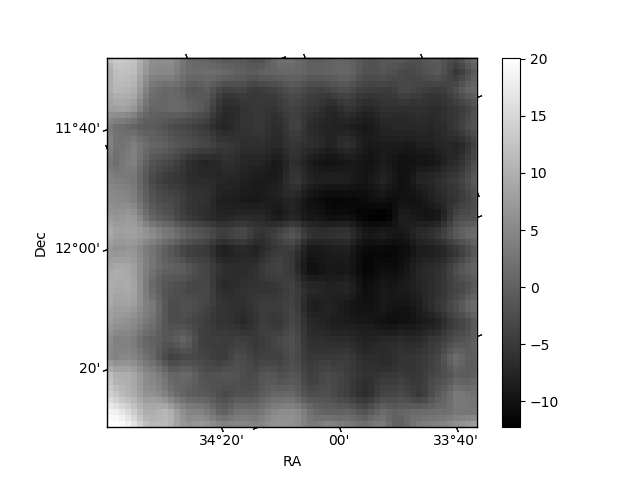
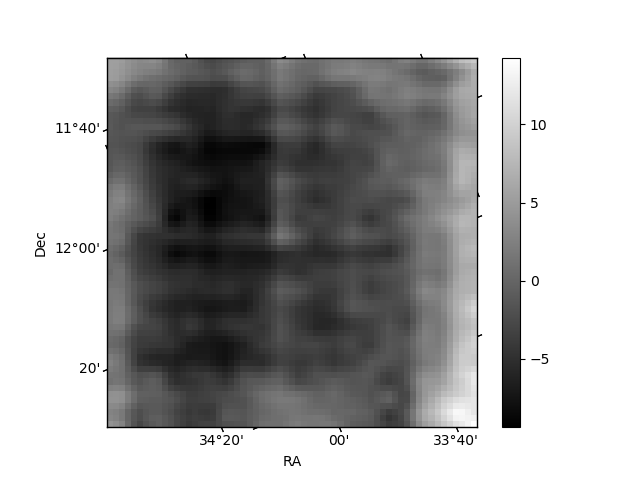
Histogram calculated using DETX and DETY for each event in the final _common_clean file
| Quadrant A | 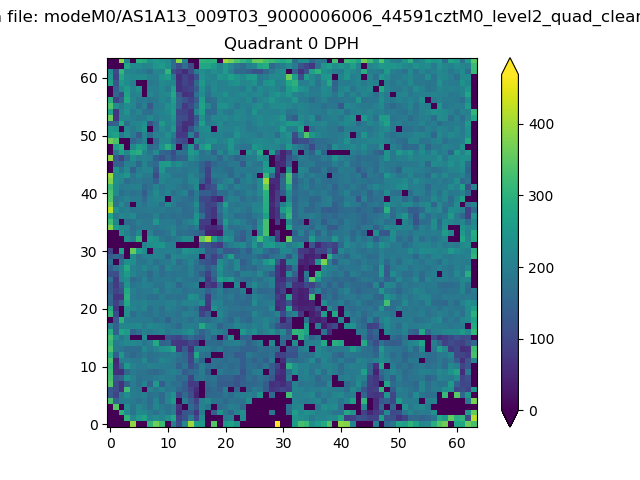 |
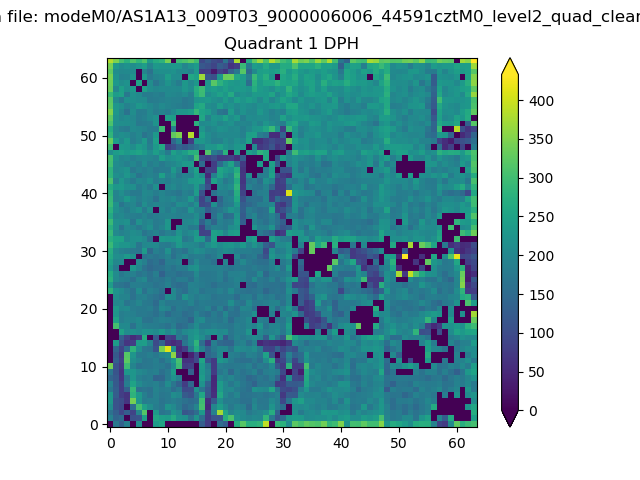 |
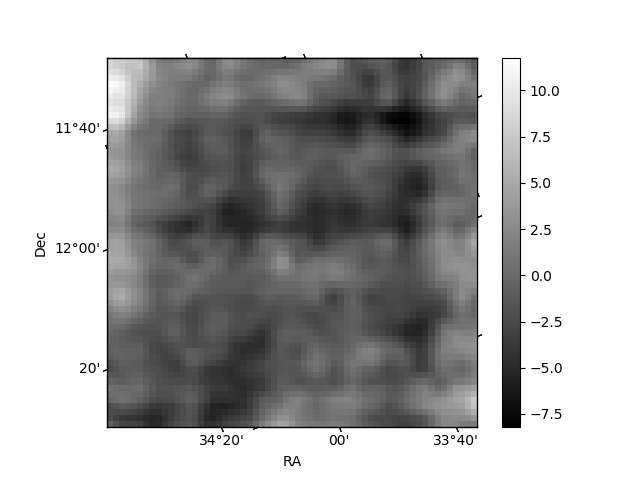
Quadrant B |
|---|---|---|---|
| Quadrant D | 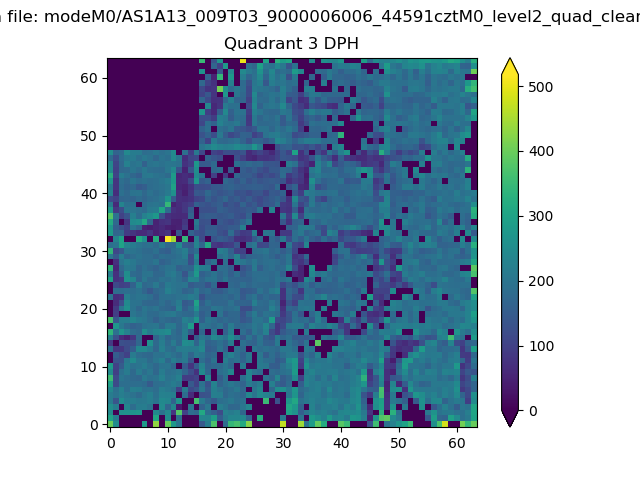 |
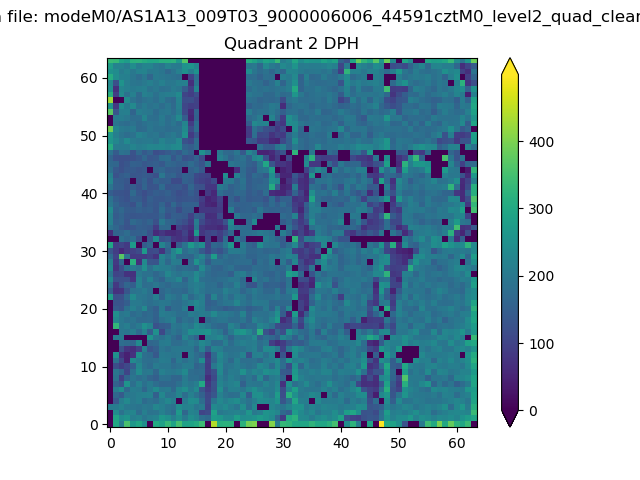 |
Quadrant C |
| Plot type | Count rate plots | Images |
|---|---|---|
| Comparison with Poisson distribution Blue bars denote a histogram of data divided into 1 sec bins. Red curve is a Poisson curve with rate = median count rate of data. |
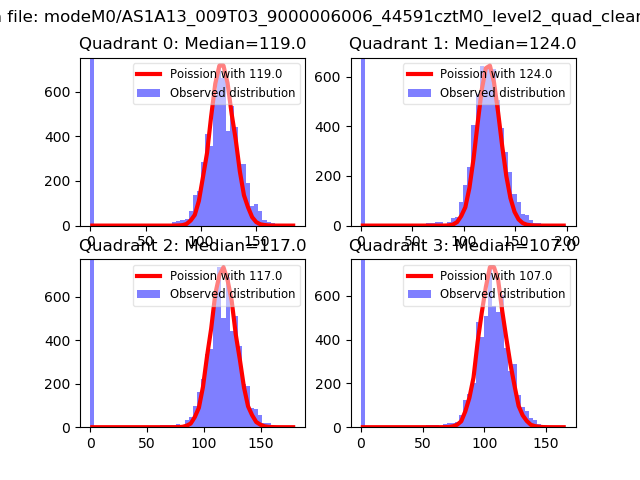 |
 |
| Quadrant-wise count rates Data is divided into 100 sec bins |
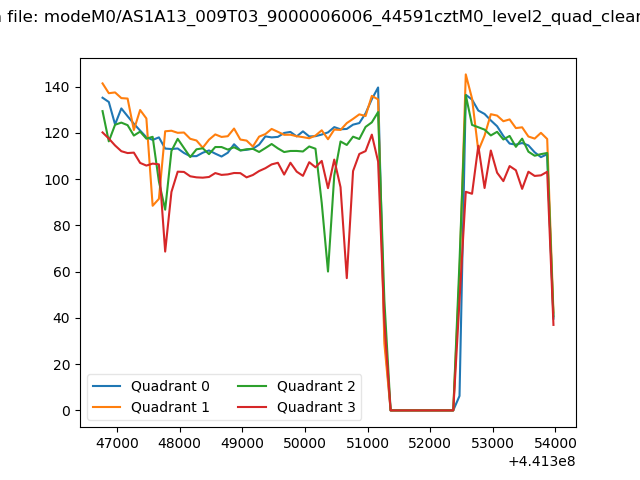 |
|
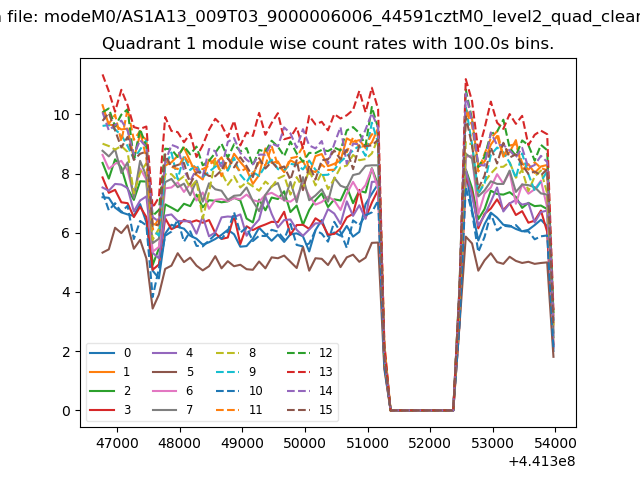
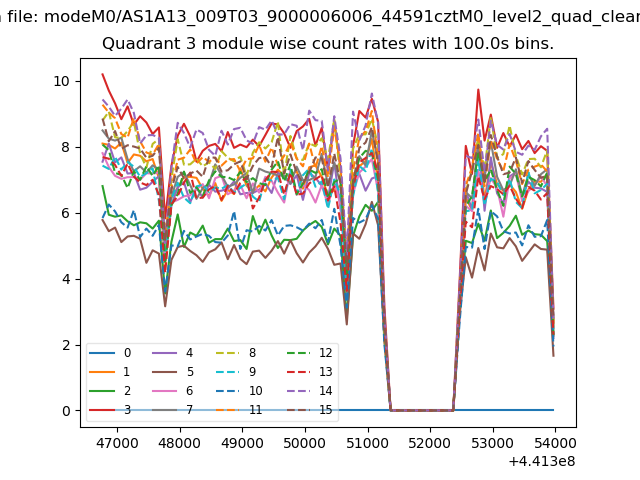
| Module-wise count rates for Quadrant A Data is divided into 100 sec bins |
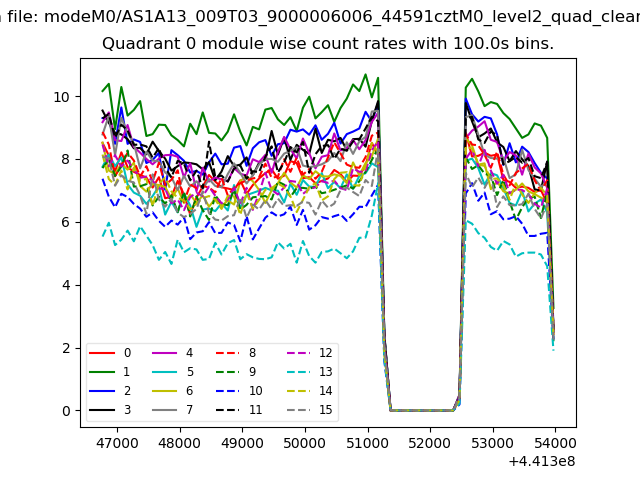 |
 |
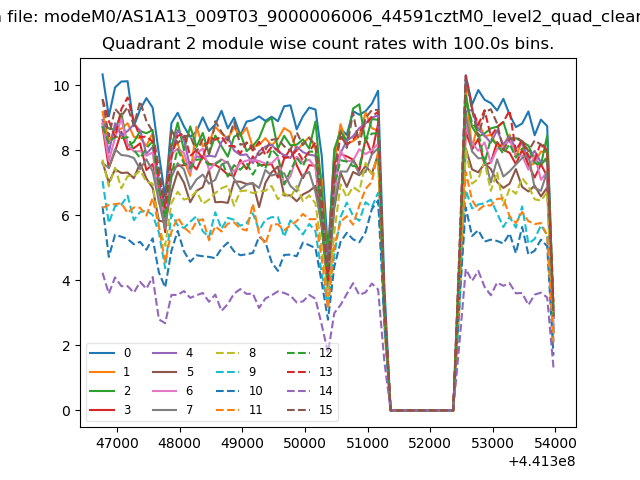
| Module-wise count rates for Quadrant B Data is divided into 100 sec bins |
 |
 |
| Module-wise count rates for Quadrant C Data is divided into 100 sec bins |
 |
 |
| Module-wise count rates for Quadrant D Data is divided into 100 sec bins |
 |
 |
| Parameter | Plot |
|---|---|
| CZT HV Monitor | 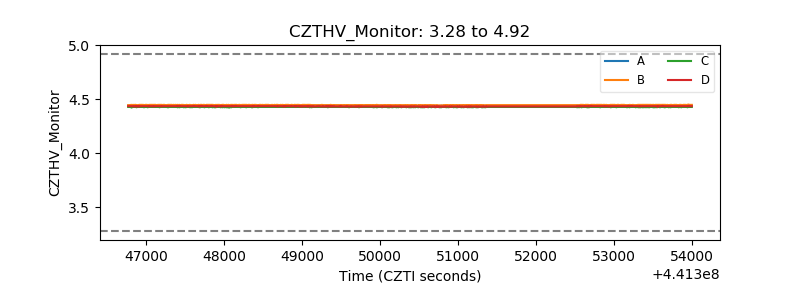 |
| D_VDD | 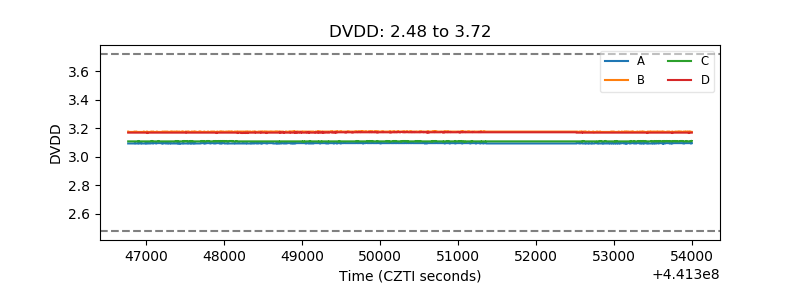 |
| Temperature 1 | 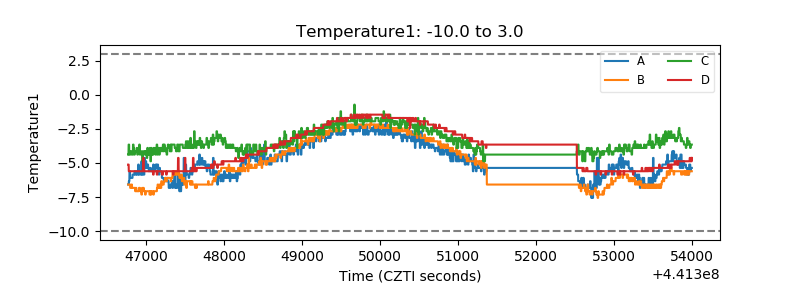 |
| Veto HV Monitor | 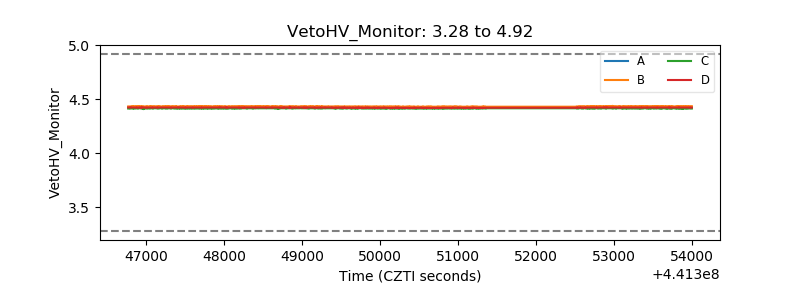 |
| Veto LLD | 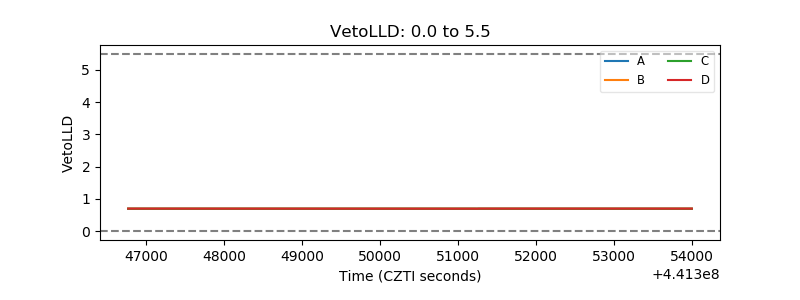 |
| Alpha Counter | 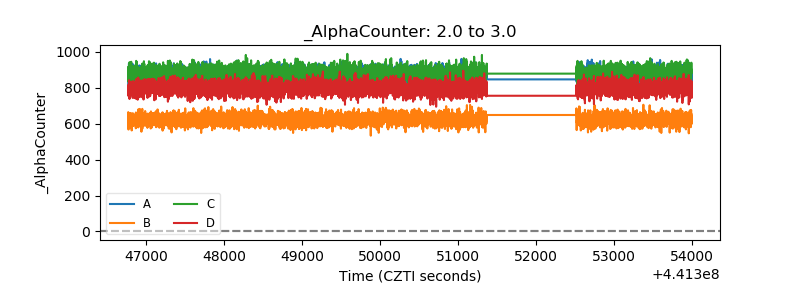 |
| _CPM_Rate | 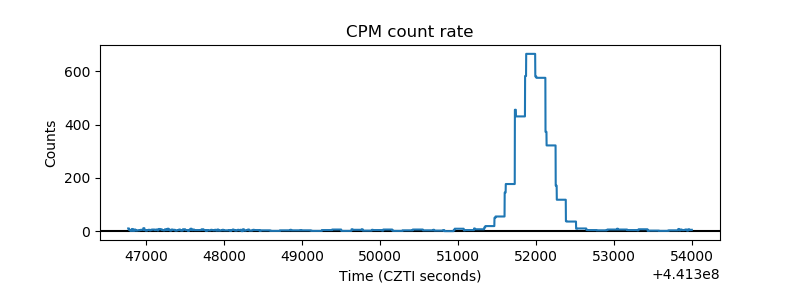 |
| CZT Counter | 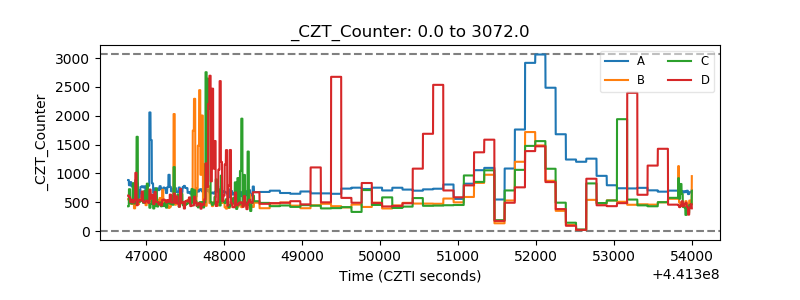 |
| +2.5 Volts monitor | 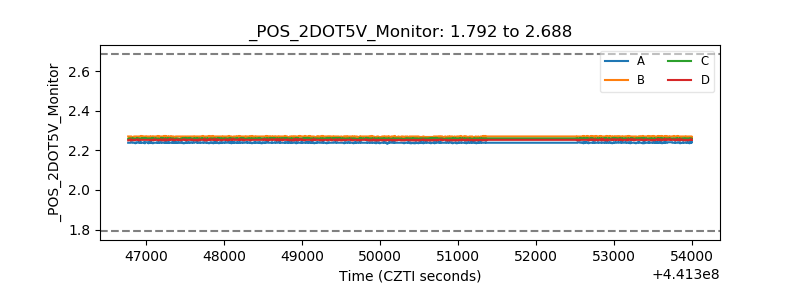 |
| +5 Volts monitor | 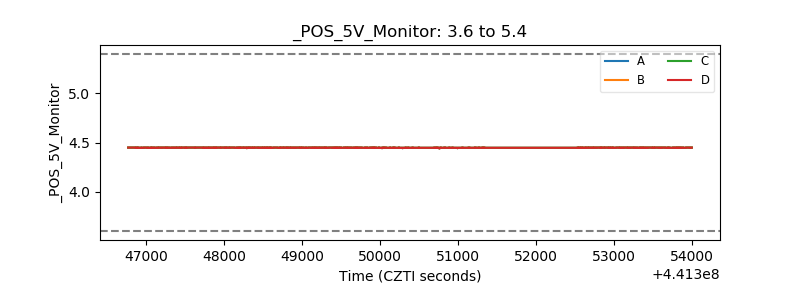 |
| _ROLL_ROT | 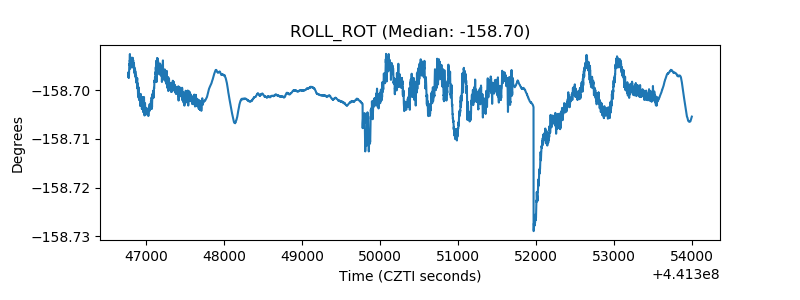 |
| _Roll_DEC | 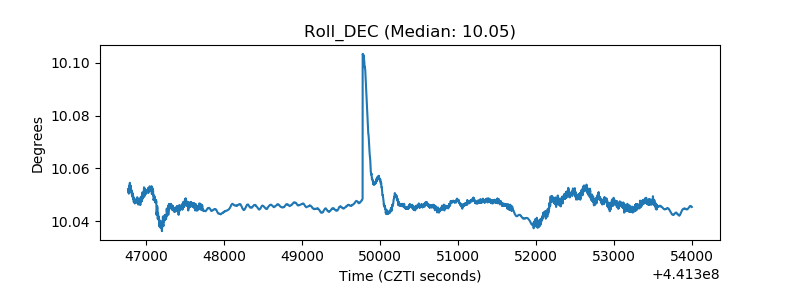 |
| _Roll_RA | 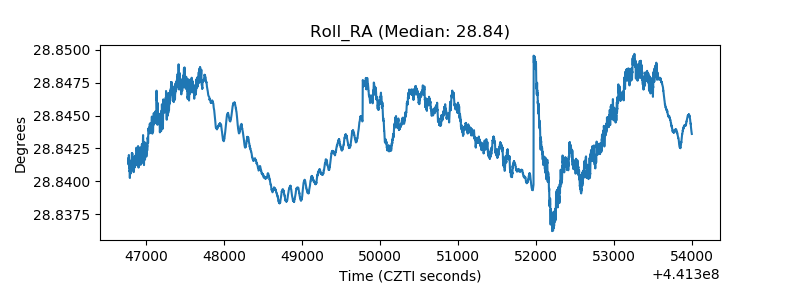 |
| Veto Counter | 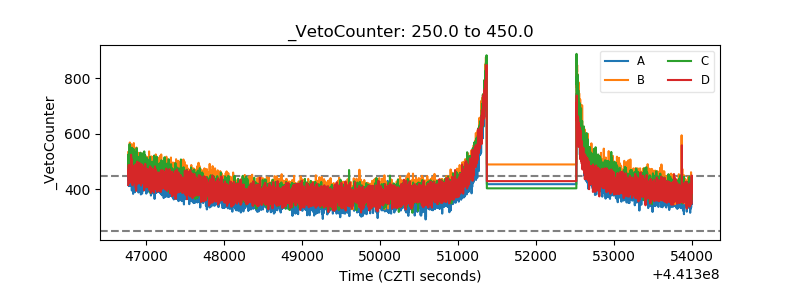 |