| Param | Original file | Final file |
|---|---|---|
| Filename | modeM0/AS1A13_009T03_9000006006_44592cztM0_level2.fits | modeM0/AS1A13_009T03_9000006006_44592cztM0_level2_quad_clean.evt |
| Size (bytes) | 572,166,720 | 105,632,640 |
| Size | 545.7 MB | 100.7 MB |
| Events in quadrant A | 7,001,831 | 627,936 |
| Events in quadrant B | 3,745,282 | 757,673 |
| Events in quadrant C | 4,310,104 | 725,003 |
| Events in quadrant D | 5,604,996 | 623,633 |
| Mode SS | |||
|---|---|---|---|
| Quadrant | BADHDUFLAG | Total packets | Discarded packets |
| A | 0 | 134 | 0 |
| B | 0 | 134 | 0 |
| C | 0 | 134 | 0 |
| D | 0 | 134 | 0 |
| Mode M9 | |||
|---|---|---|---|
| Quadrant | BADHDUFLAG | Total packets | Discarded packets |
| A | 0 | 10 | 0 |
| B | 0 | 10 | 0 |
| C | 0 | 10 | 0 |
| D | 0 | 10 | 0 |
| Mode M0 | |||
|---|---|---|---|
| Quadrant | BADHDUFLAG | Total packets | Discarded packets |
| A | 0 | 26177 | 1 |
| B | 0 | 15492 | 3 |
| C | 0 | 17251 | 1 |
| D | 0 | 21168 | 1 |
| Quadrant | Total seconds | Saturated seconds | Saturation percentage |
|---|---|---|---|
| A | 6663 | 1261 | 18.925409% |
| B | 6663 | 382 | 5.733153% |
| C | 6663 | 370 | 5.553054% |
| D | 6663 | 783 | 11.751463% |
Noise dominated data is calculated using 1-second bins in cleaned event files. If a bin has >2000 counts, and if more than 50% of those come from <1% of pixels, then it is considered to be noise-dominated and hence unusable.
| Quadrant | # 1 sec bins | Bins with >0 counts | Bins with >2000 counts | High rate bins dominated by noise | Noise dominated (total time) | Noise dominated (detector-on time) | Marked lightcurve |
|---|---|---|---|---|---|---|---|
| A | 7629 | 6664 | 728 | 728 | 9.54% | 10.92% | 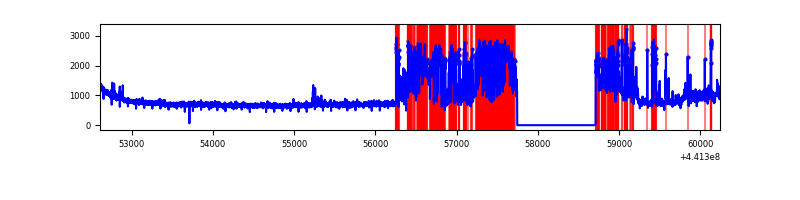 |
| B | 7629 | 6664 | 189 | 189 | 2.48% | 2.84% | 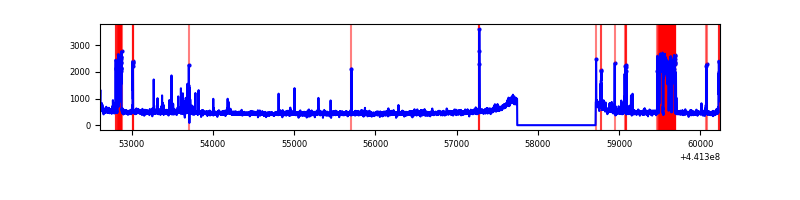 |
| C | 7629 | 6664 | 284 | 284 | 3.72% | 4.26% | 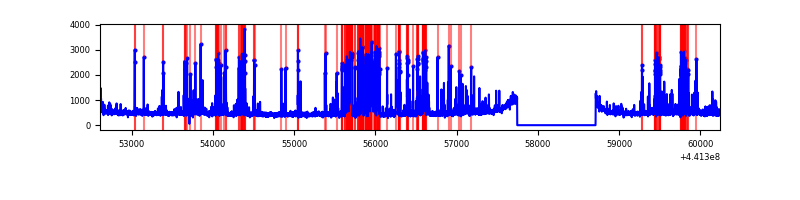 |
| D | 7629 | 6664 | 689 | 689 | 9.03% | 10.34% | 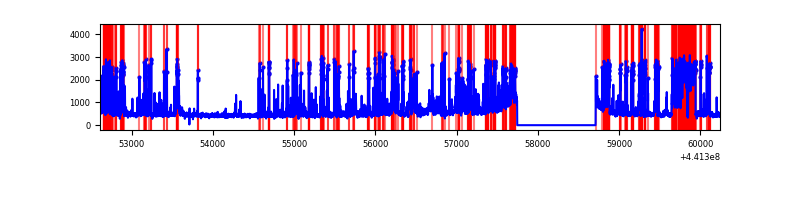 |
Top three noisy pixels from each quadrant. If the there are fewer than three noisy pixels in the level2.evt file, extra rows are filled as -1
| Pixel properties | Quadrant properties | ||||||
|---|---|---|---|---|---|---|---|
| Quadrant | DetID | PixID | Counts | Sigma | Mean | Median | Sigma |
| A | 15 | 223 | 2517238 | 17172.58 | 710 | 696 | 146.5 |
| A | 10 | 83 | 1706123 | 11637.63 | 710 | 696 | 146.5 |
| A | 13 | 248 | 24929 | 165.36 | 710 | 696 | 146.5 |
| B | 5 | 172 | 554535 | 3535.23 | 786 | 761 | 156.6 |
| B | 0 | 155 | 35507 | 221.81 | 786 | 761 | 156.6 |
| B | 12 | 111 | 20022 | 122.96 | 786 | 761 | 156.6 |
| C | 12 | 2 | 1010312 | 5512.24 | 771 | 778 | 183.1 |
| C | 14 | 254 | 232156 | 1263.37 | 771 | 778 | 183.1 |
| C | 12 | 249 | 32068 | 170.85 | 771 | 778 | 183.1 |
| D | 13 | 249 | 2110788 | 11267.68 | 739 | 717 | 187.3 |
| D | 1 | 52 | 164563 | 874.93 | 739 | 717 | 187.3 |
| D | 2 | 249 | 104021 | 551.64 | 739 | 717 | 187.3 |
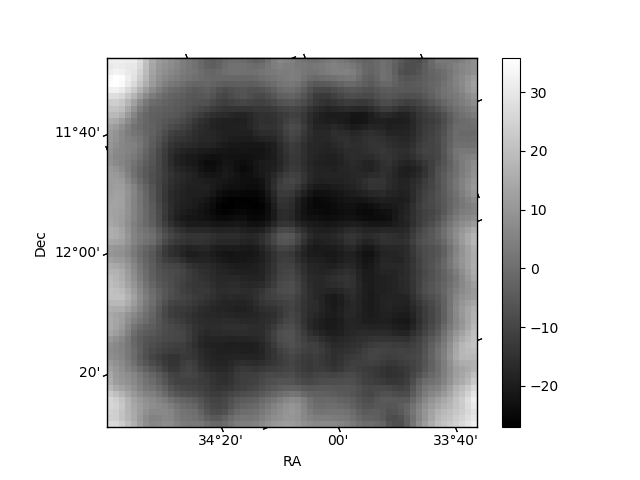
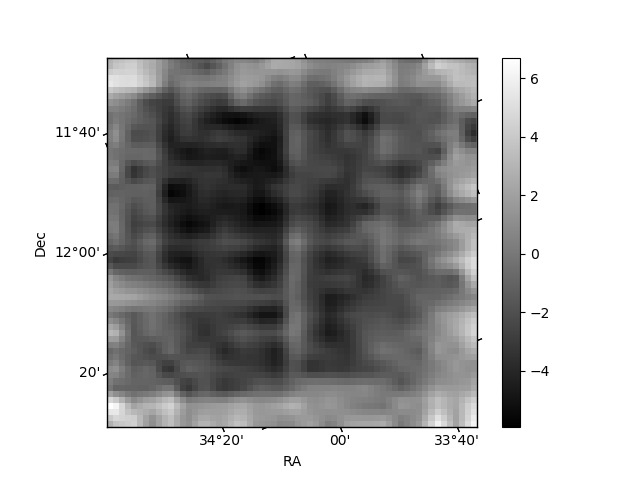
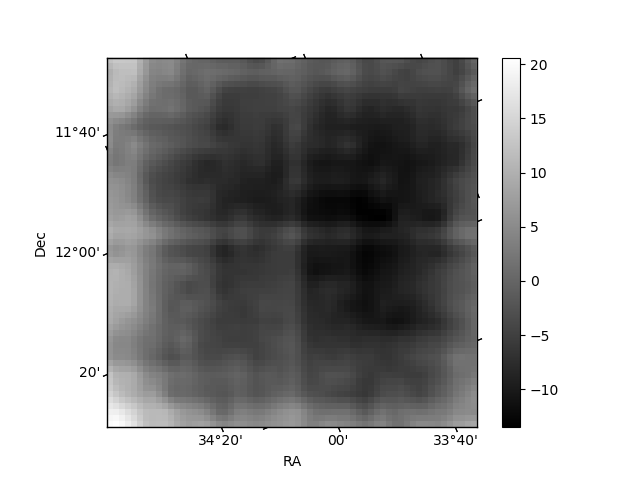
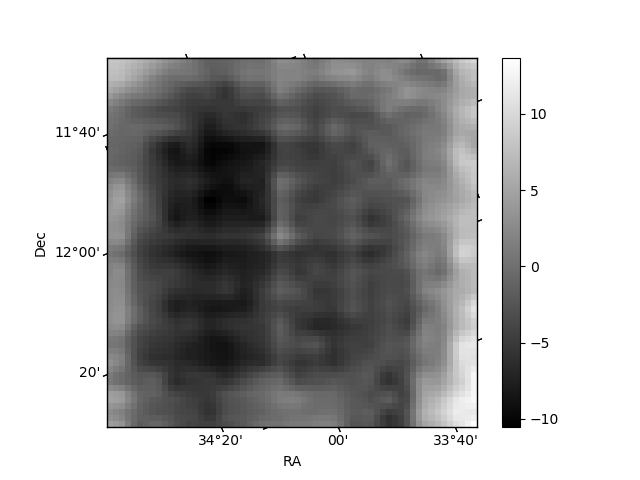
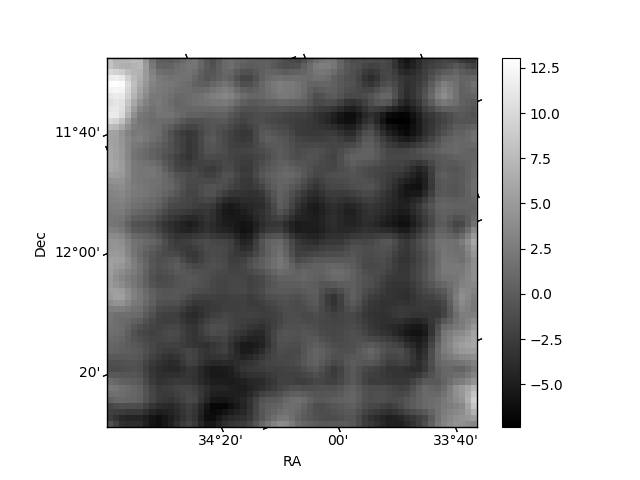
Histogram calculated using DETX and DETY for each event in the final _common_clean file
| Quadrant A | 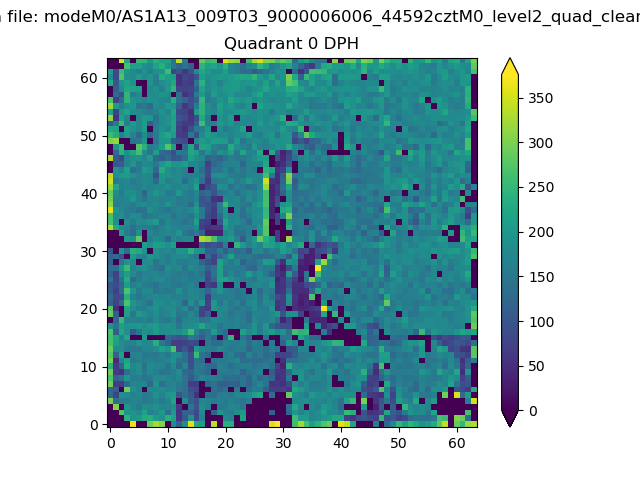 |
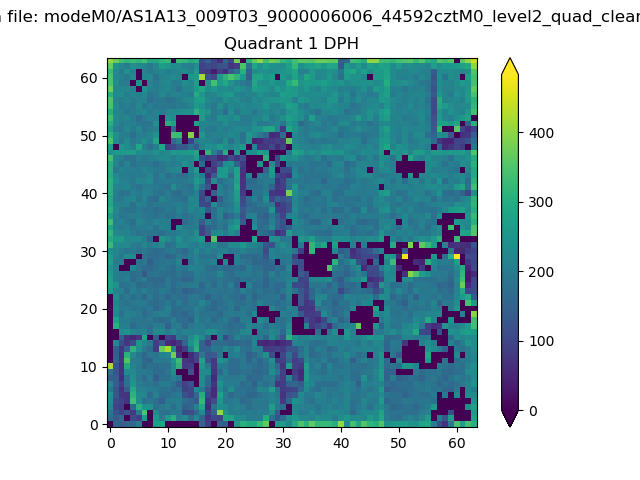 |
Quadrant B |
|---|---|---|---|
| Quadrant D | 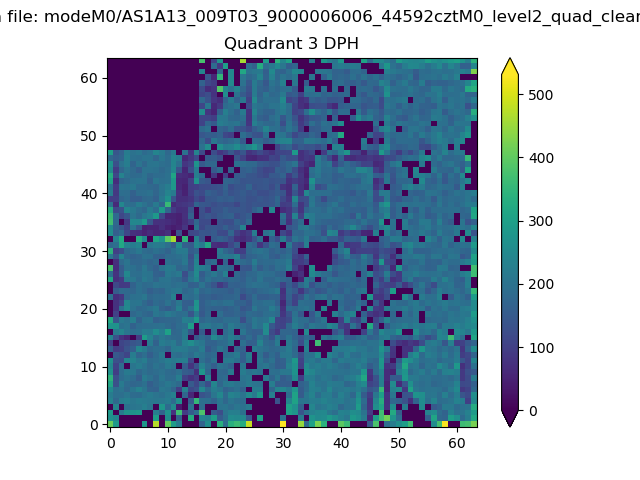 |
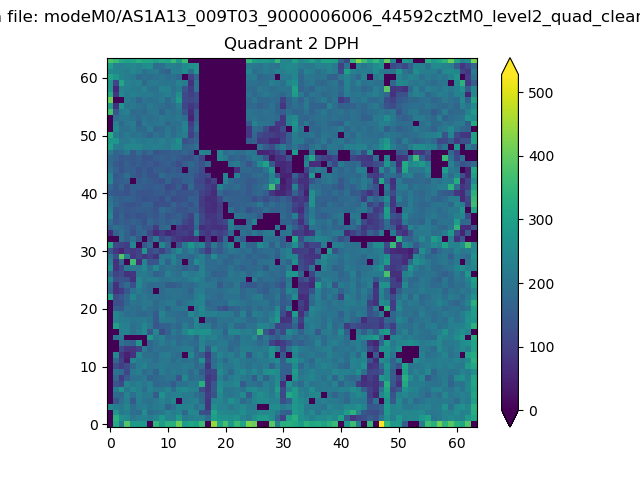 |
Quadrant C |
| Plot type | Count rate plots | Images |
|---|---|---|
| Comparison with Poisson distribution Blue bars denote a histogram of data divided into 1 sec bins. Red curve is a Poisson curve with rate = median count rate of data. |
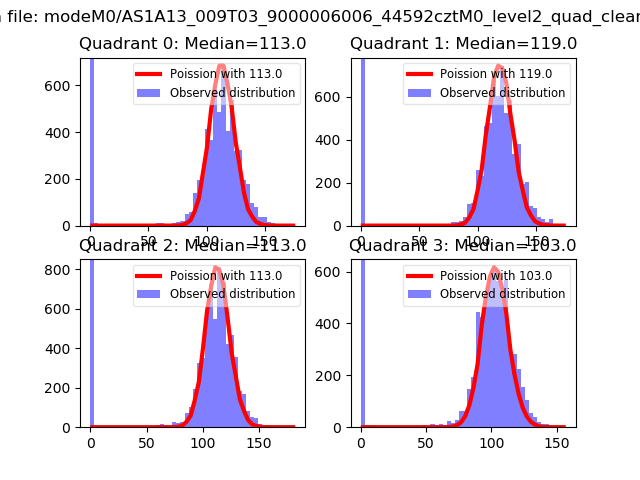 |
 |
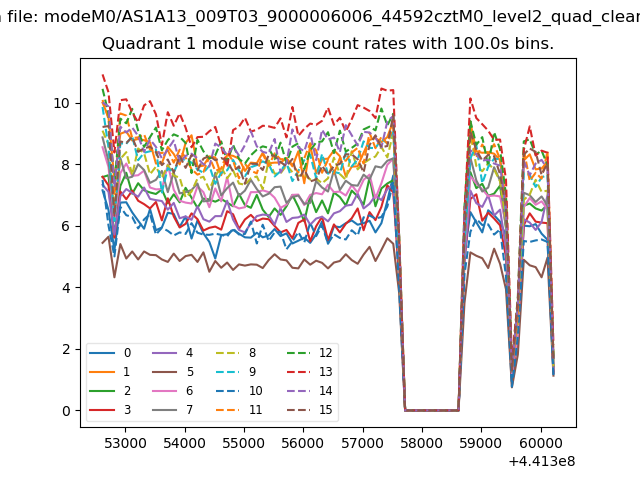
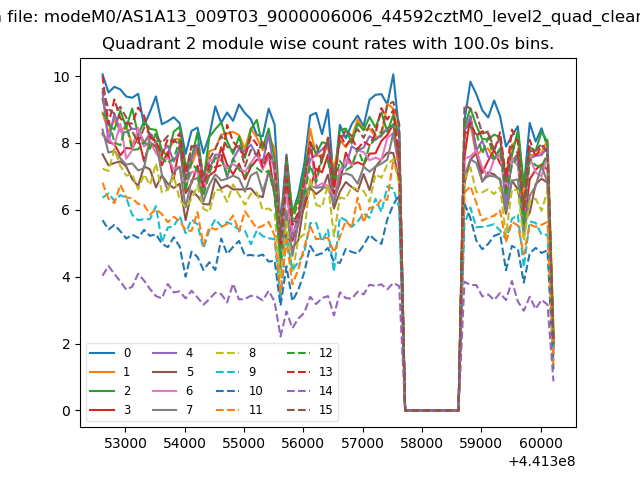
| Quadrant-wise count rates Data is divided into 100 sec bins |
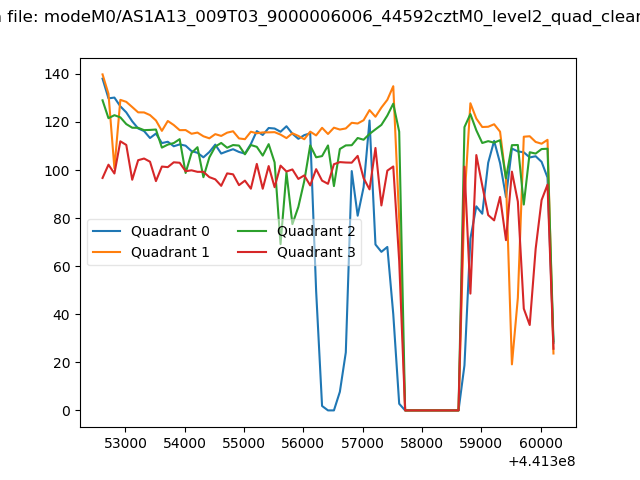 |
|
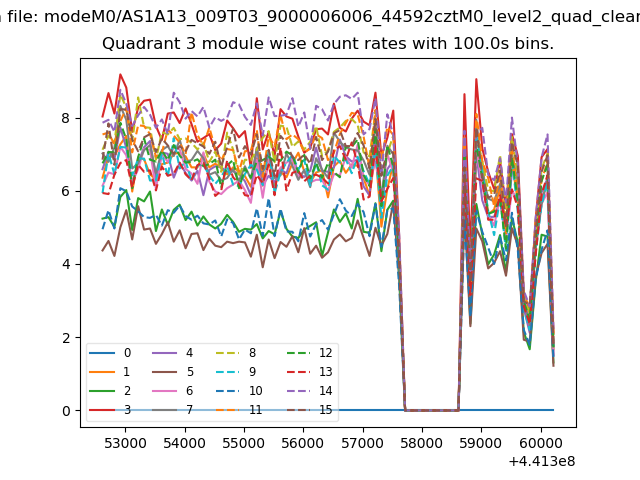
| Module-wise count rates for Quadrant A Data is divided into 100 sec bins |
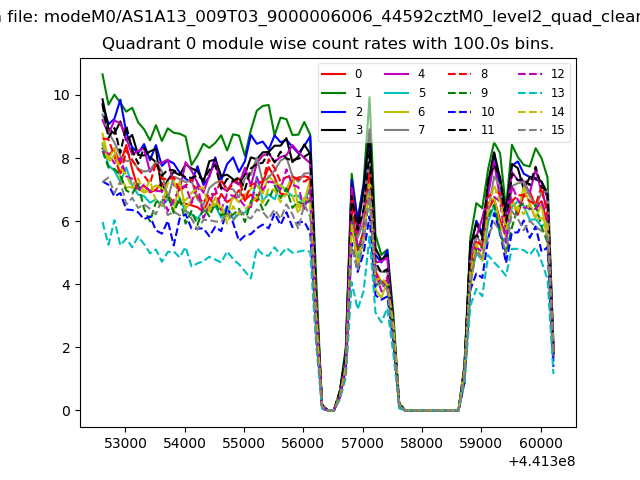 |
 |
| Module-wise count rates for Quadrant B Data is divided into 100 sec bins |
 |
 |
| Module-wise count rates for Quadrant C Data is divided into 100 sec bins |
 |
 |
| Module-wise count rates for Quadrant D Data is divided into 100 sec bins |
 |
 |
| Parameter | Plot |
|---|---|
| CZT HV Monitor |  |
| D_VDD | 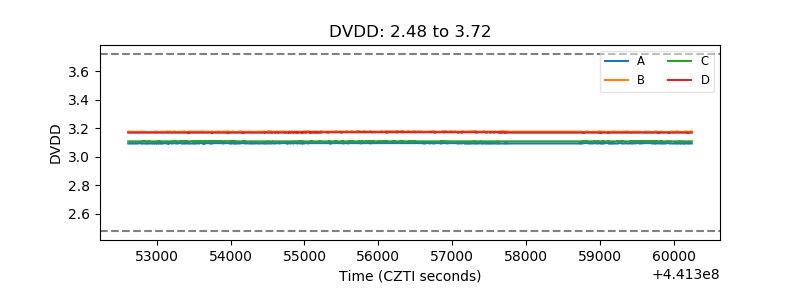 |
| Temperature 1 | 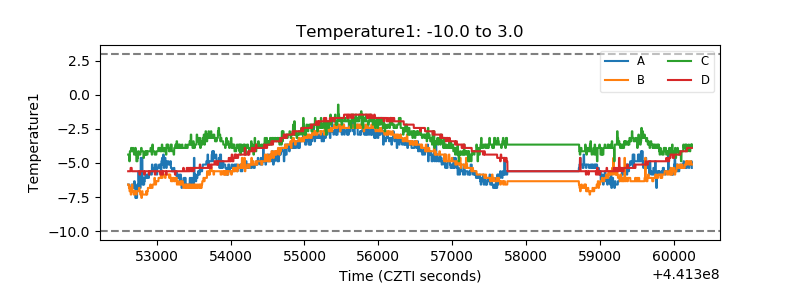 |
| Veto HV Monitor | 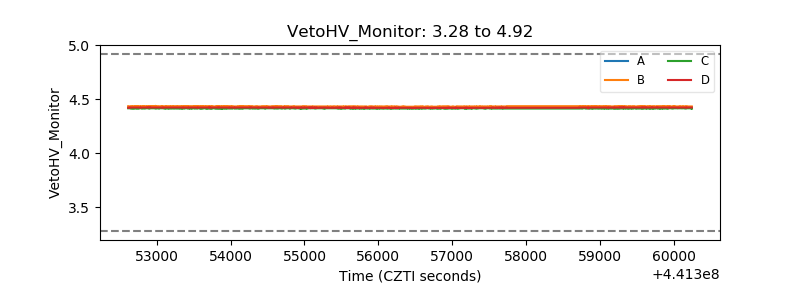 |
| Veto LLD | 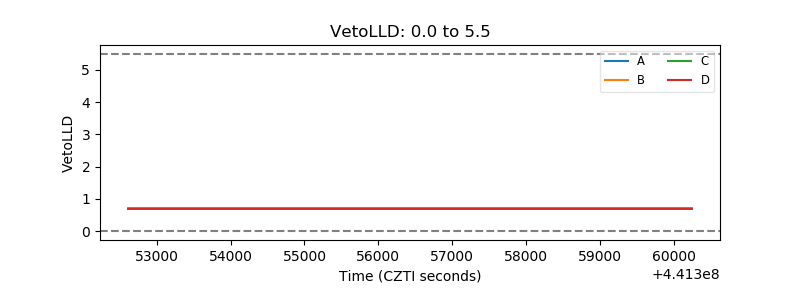 |
| Alpha Counter | 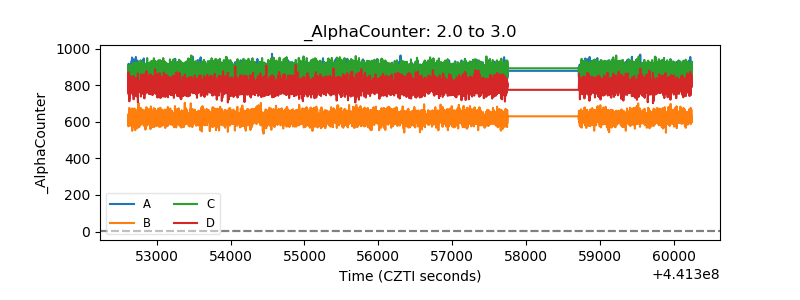 |
| _CPM_Rate | 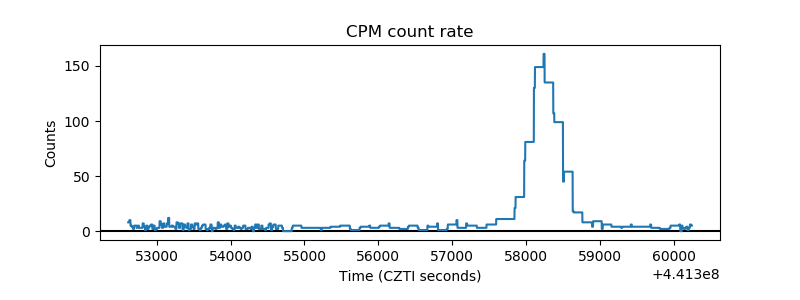 |
| CZT Counter | 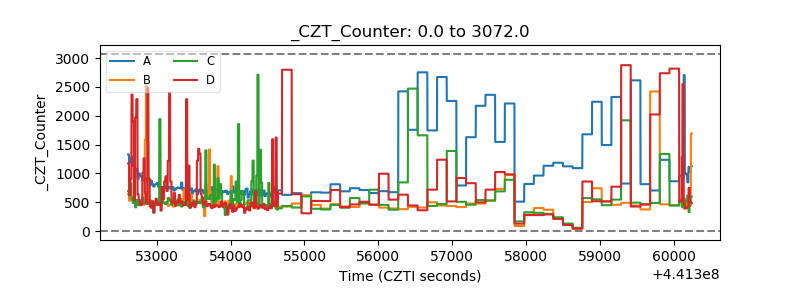 |
| +2.5 Volts monitor | 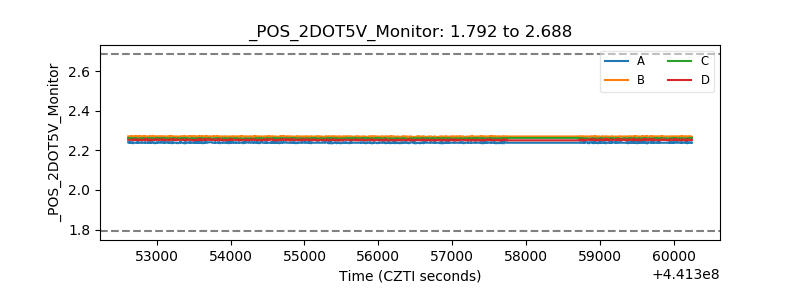 |
| +5 Volts monitor | 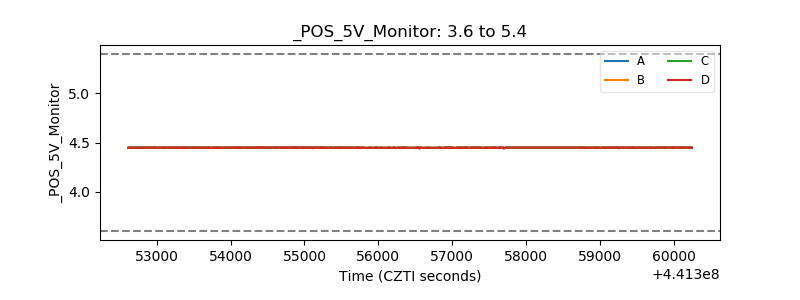 |
| _ROLL_ROT | 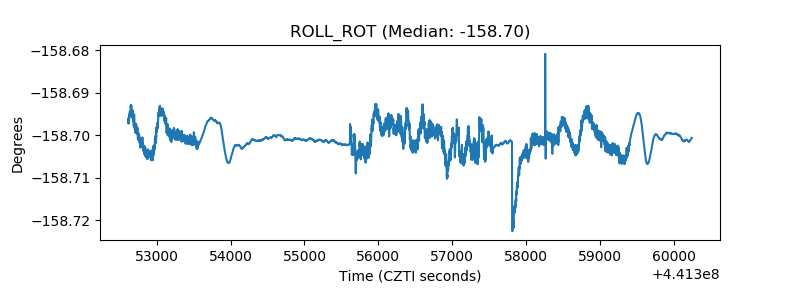 |
| _Roll_DEC | 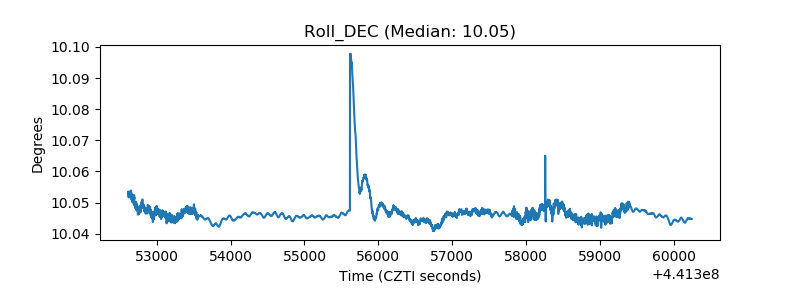 |
| _Roll_RA | 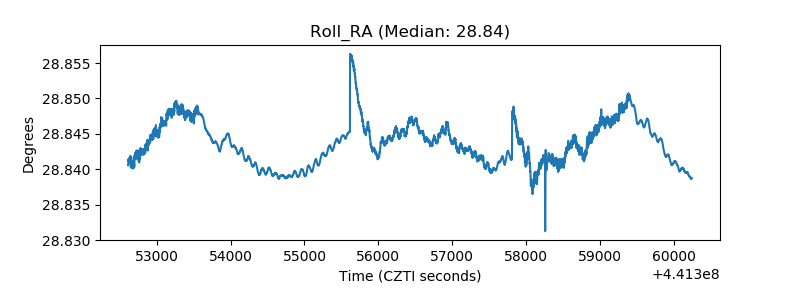 |
| Veto Counter | 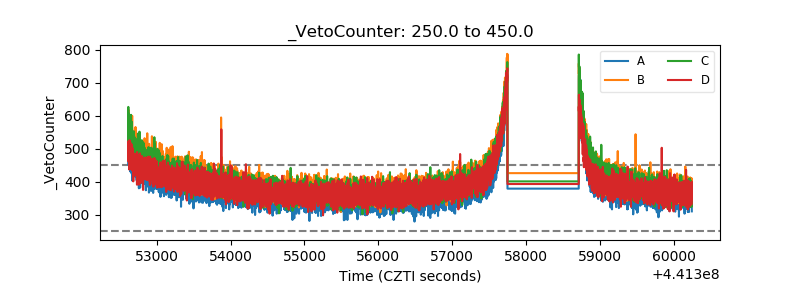 |