| Param | Original file | Final file |
|---|---|---|
| Filename | modeM0/AS1A13_009T03_9000006006_44593cztM0_level2.fits | modeM0/AS1A13_009T03_9000006006_44593cztM0_level2_quad_clean.evt |
| Size (bytes) | 615,827,520 | 113,578,560 |
| Size | 587.3 MB | 108.3 MB |
| Events in quadrant A | 8,052,526 | 707,037 |
| Events in quadrant B | 4,217,095 | 781,030 |
| Events in quadrant C | 4,649,487 | 760,579 |
| Events in quadrant D | 5,310,046 | 681,456 |
| Mode SS | |||
|---|---|---|---|
| Quadrant | BADHDUFLAG | Total packets | Discarded packets |
| A | 0 | 150 | 0 |
| B | 0 | 150 | 0 |
| C | 0 | 150 | 0 |
| D | 0 | 150 | 0 |
| Mode M9 | |||
|---|---|---|---|
| Quadrant | BADHDUFLAG | Total packets | Discarded packets |
| A | 0 | 7 | 0 |
| B | 0 | 8 | 0 |
| C | 0 | 8 | 0 |
| D | 0 | 8 | 0 |
| Mode M0 | |||
|---|---|---|---|
| Quadrant | BADHDUFLAG | Total packets | Discarded packets |
| A | 0 | 29132 | 11 |
| B | 0 | 17461 | 3 |
| C | 0 | 18879 | 7 |
| D | 0 | 20641 | 3 |
| Quadrant | Total seconds | Saturated seconds | Saturation percentage |
|---|---|---|---|
| A | 7303 | 1143 | 15.651102% |
| B | 7304 | 576 | 7.886090% |
| C | 7303 | 482 | 6.600027% |
| D | 7304 | 607 | 8.310515% |
Noise dominated data is calculated using 1-second bins in cleaned event files. If a bin has >2000 counts, and if more than 50% of those come from <1% of pixels, then it is considered to be noise-dominated and hence unusable.
| Quadrant | # 1 sec bins | Bins with >0 counts | Bins with >2000 counts | High rate bins dominated by noise | Noise dominated (total time) | Noise dominated (detector-on time) | Marked lightcurve |
|---|---|---|---|---|---|---|---|
| A | 7804 | 7303 | 394 | 394 | 5.05% | 5.40% | 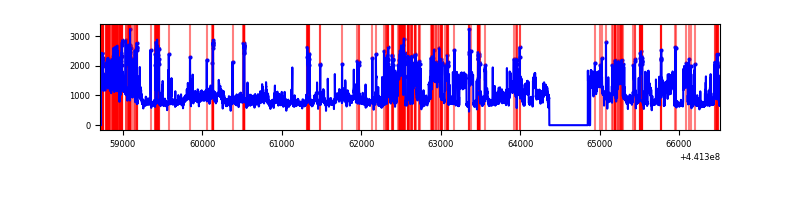 |
| B | 7804 | 7304 | 243 | 243 | 3.11% | 3.33% | 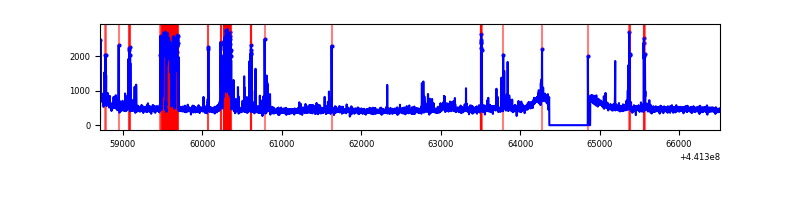 |
| C | 7803 | 7303 | 341 | 341 | 4.37% | 4.67% | 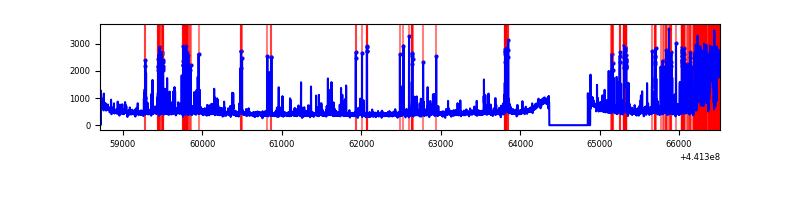 |
| D | 7804 | 7305 | 446 | 446 | 5.72% | 6.11% | 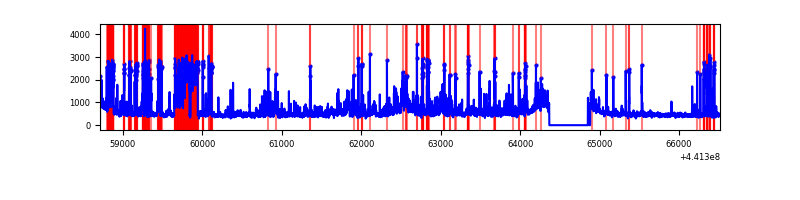 |
Top three noisy pixels from each quadrant. If the there are fewer than three noisy pixels in the level2.evt file, extra rows are filled as -1
| Pixel properties | Quadrant properties | ||||||
|---|---|---|---|---|---|---|---|
| Quadrant | DetID | PixID | Counts | Sigma | Mean | Median | Sigma |
| A | 15 | 223 | 2910310 | 17087.4 | 816 | 798 | 170.3 |
| A | 10 | 83 | 1888490 | 11086.31 | 816 | 798 | 170.3 |
| A | 13 | 248 | 53949 | 312.15 | 816 | 798 | 170.3 |
| B | 5 | 172 | 763682 | 4498.86 | 843 | 814 | 169.6 |
| B | 0 | 155 | 41743 | 241.37 | 843 | 814 | 169.6 |
| B | 4 | 216 | 28385 | 162.59 | 843 | 814 | 169.6 |
| C | 12 | 2 | 1218445 | 6197.14 | 833 | 839 | 196.5 |
| C | 14 | 254 | 147836 | 748.16 | 833 | 839 | 196.5 |
| C | 3 | 233 | 12089 | 57.26 | 833 | 839 | 196.5 |
| D | 13 | 249 | 1301151 | 6274.69 | 822 | 796 | 207.2 |
| D | 1 | 52 | 426173 | 2052.6 | 822 | 796 | 207.2 |
| D | 7 | 96 | 112121 | 537.18 | 822 | 796 | 207.2 |
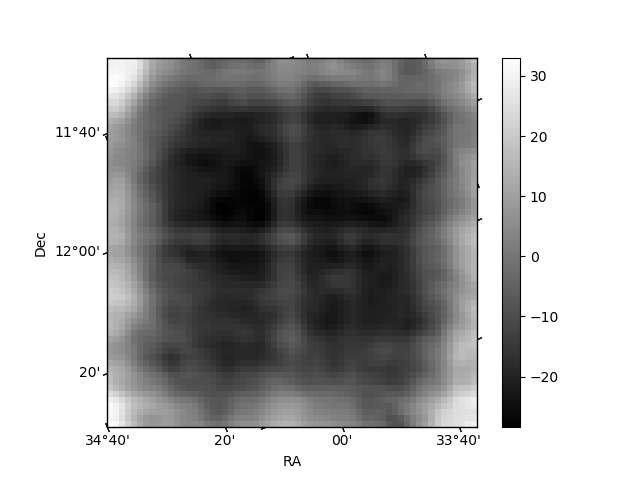
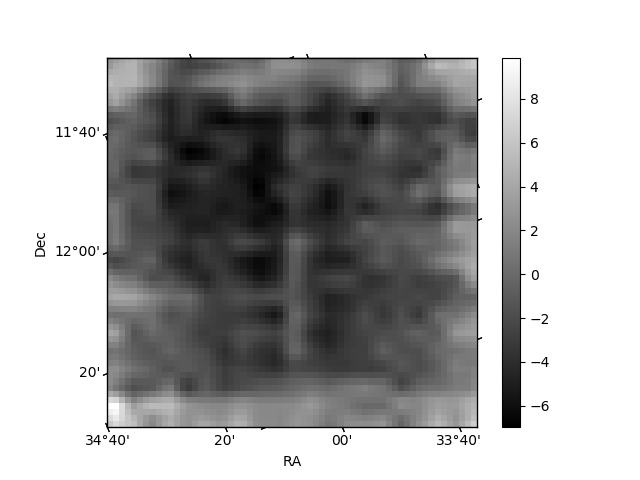
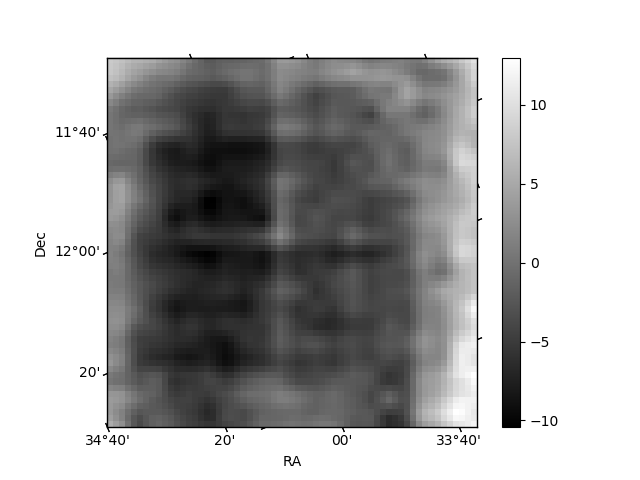
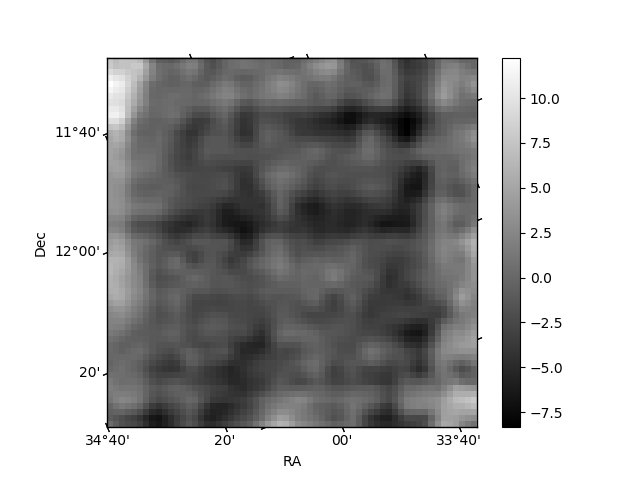
Histogram calculated using DETX and DETY for each event in the final _common_clean file
| Quadrant A | 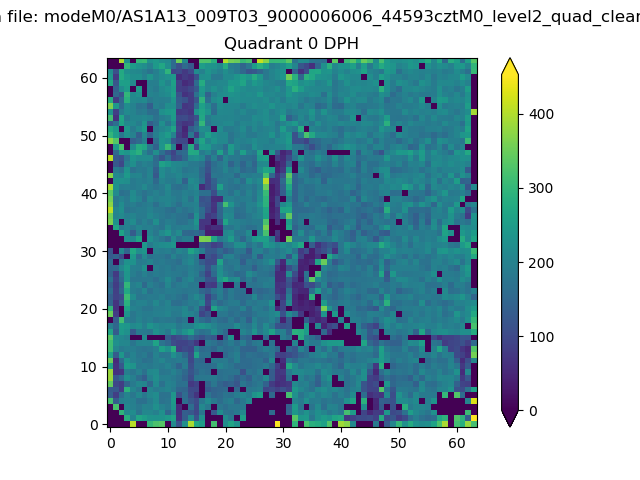 |
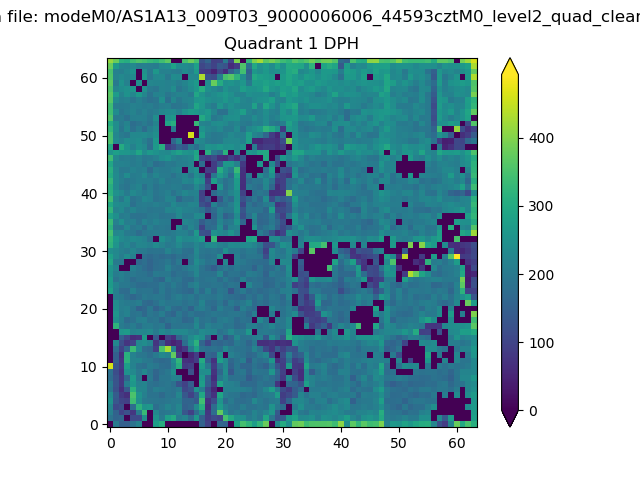 |
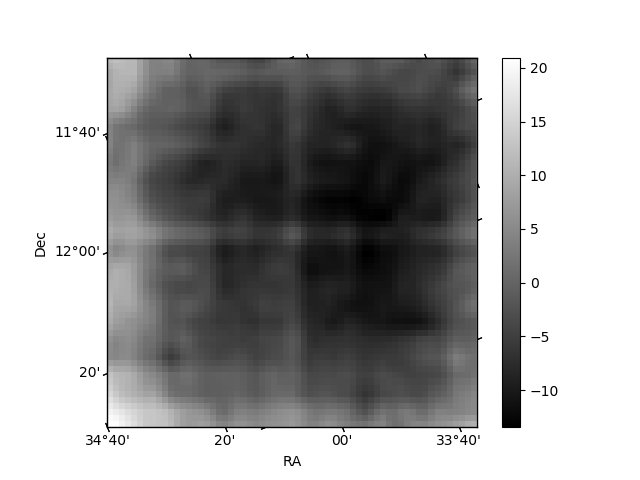
Quadrant B |
|---|---|---|---|
| Quadrant D | 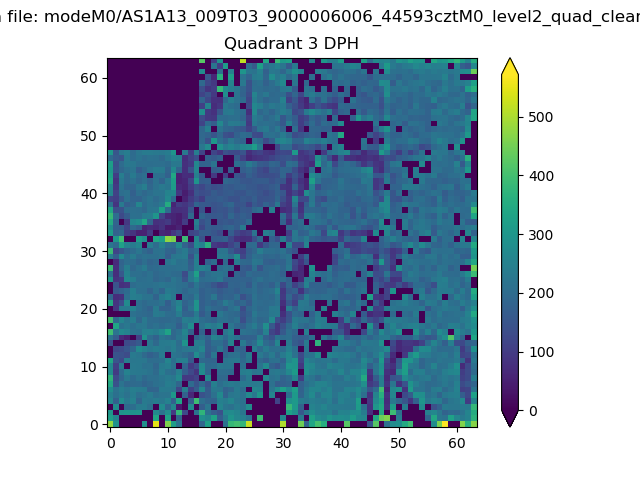 |
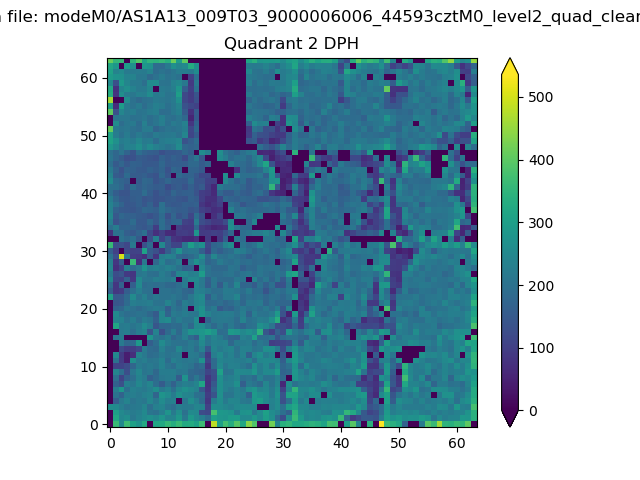 |
Quadrant C |
| Plot type | Count rate plots | Images |
|---|---|---|
| Comparison with Poisson distribution Blue bars denote a histogram of data divided into 1 sec bins. Red curve is a Poisson curve with rate = median count rate of data. |
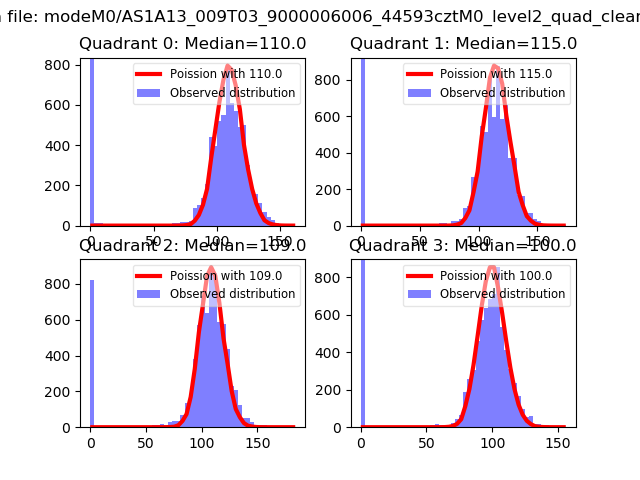 |
 |
| Quadrant-wise count rates Data is divided into 100 sec bins |
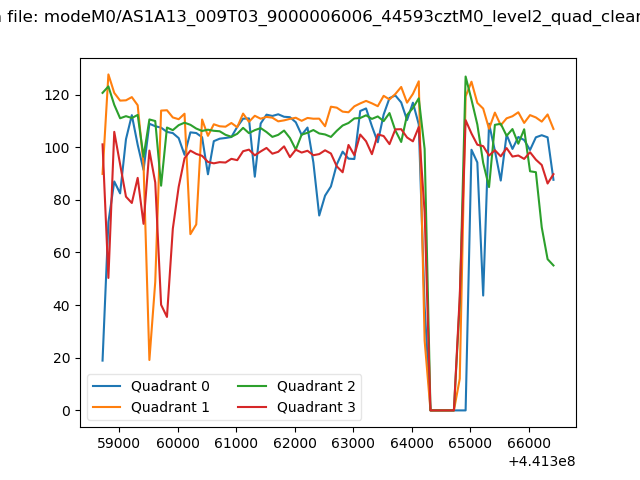 |
|
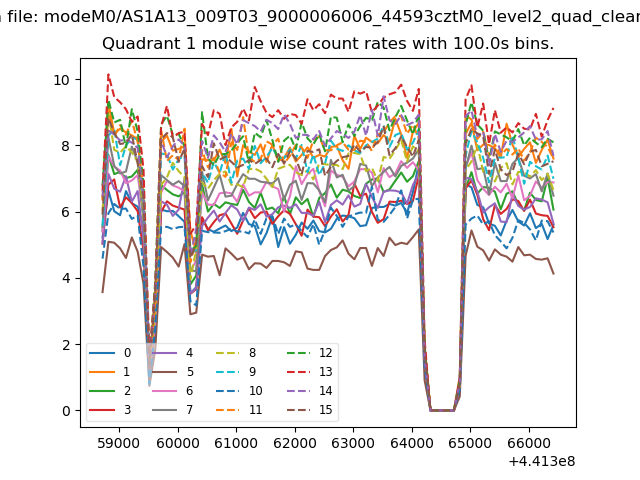
| Module-wise count rates for Quadrant A Data is divided into 100 sec bins |
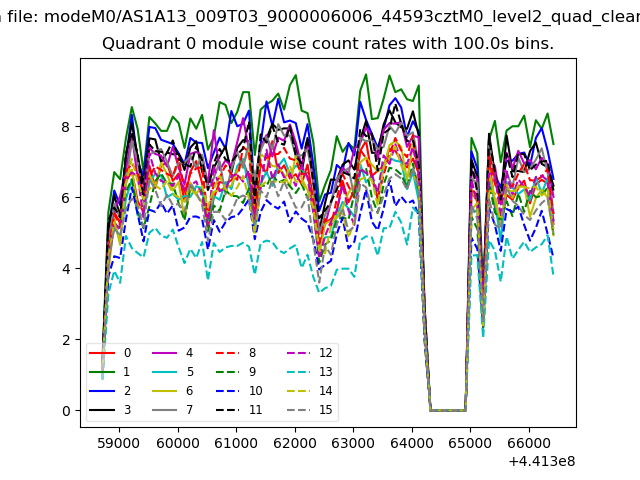 |
 |
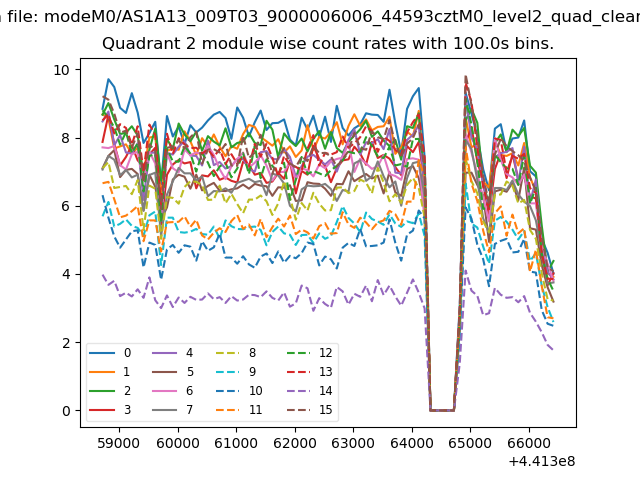
| Module-wise count rates for Quadrant B Data is divided into 100 sec bins |
 |
 |
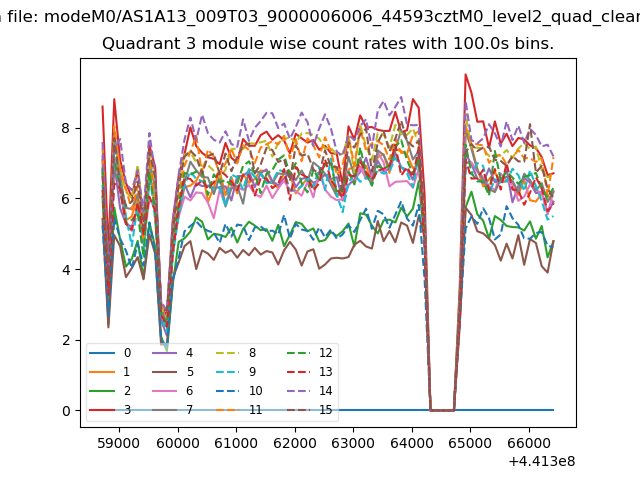
| Module-wise count rates for Quadrant C Data is divided into 100 sec bins |
 |
 |
| Module-wise count rates for Quadrant D Data is divided into 100 sec bins |
 |
 |
| Parameter | Plot |
|---|---|
| CZT HV Monitor | 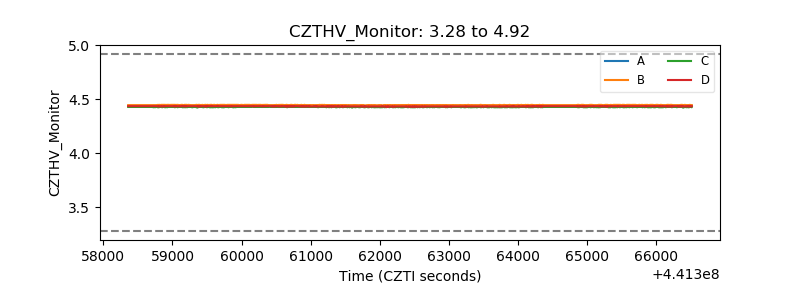 |
| D_VDD | 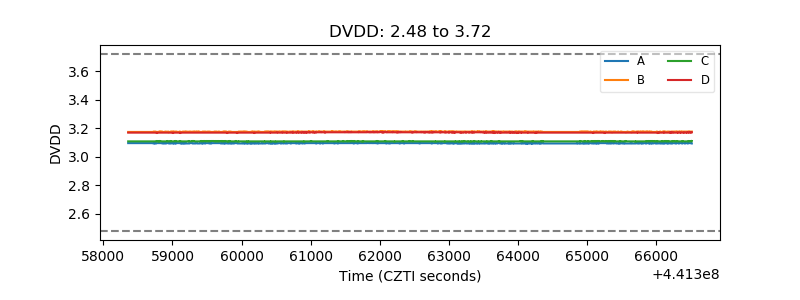 |
| Temperature 1 | 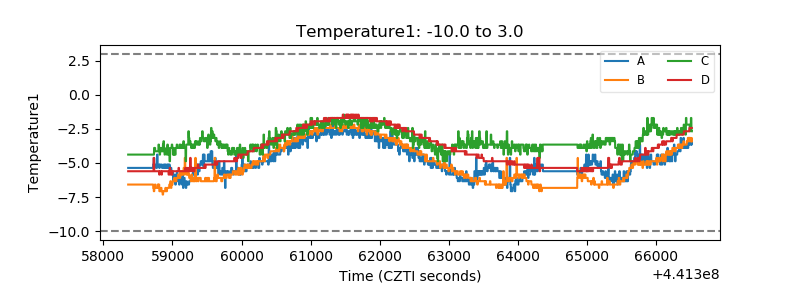 |
| Veto HV Monitor | 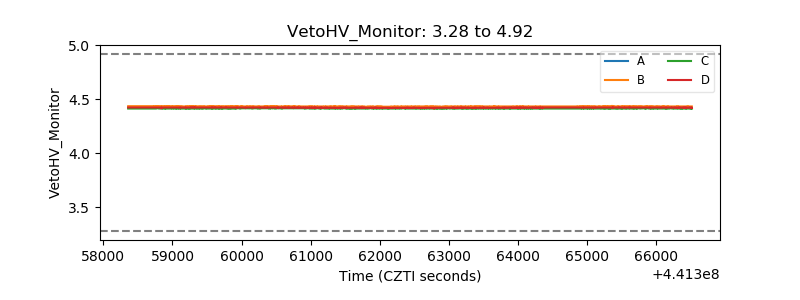 |
| Veto LLD | 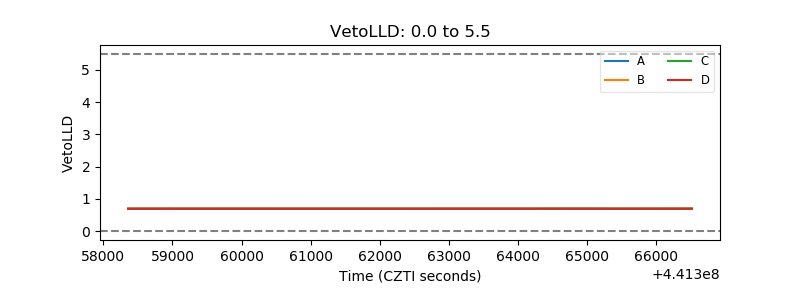 |
| Alpha Counter | 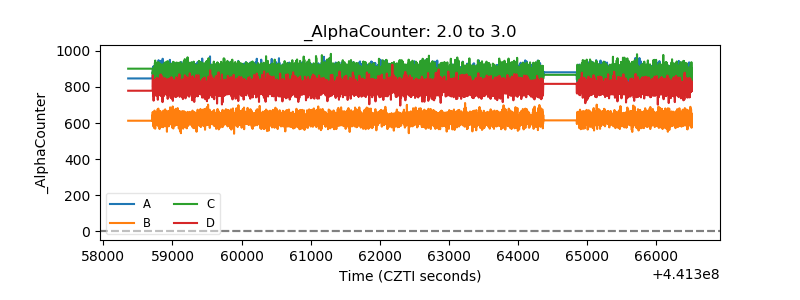 |
| _CPM_Rate | 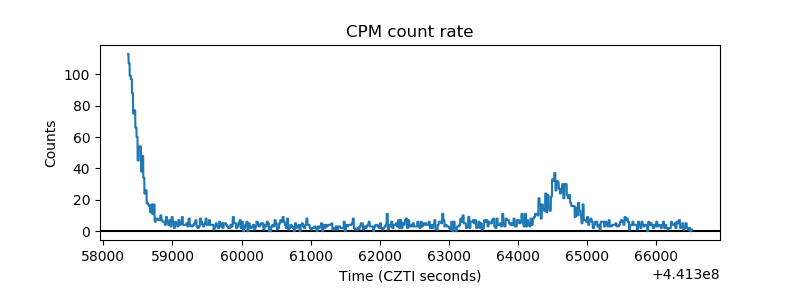 |
| CZT Counter | 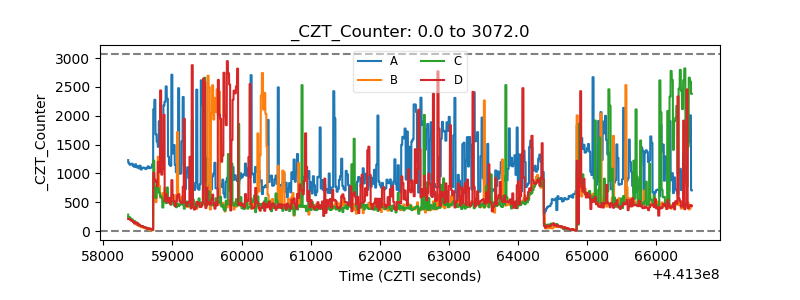 |
| +2.5 Volts monitor | 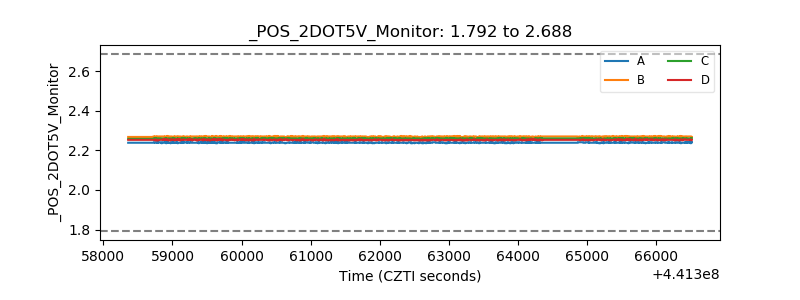 |
| +5 Volts monitor | 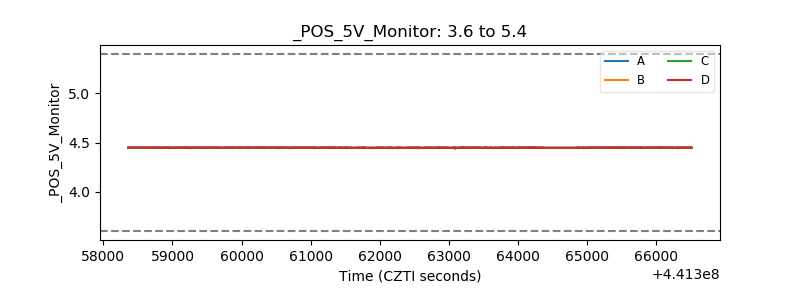 |
| _ROLL_ROT | 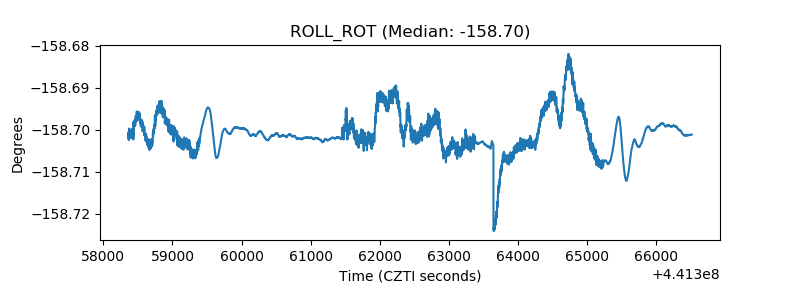 |
| _Roll_DEC | 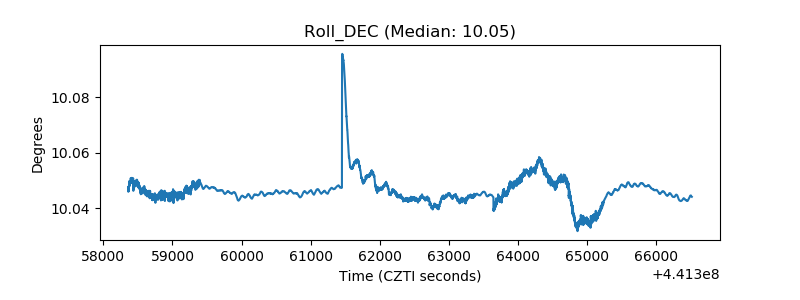 |
| _Roll_RA | 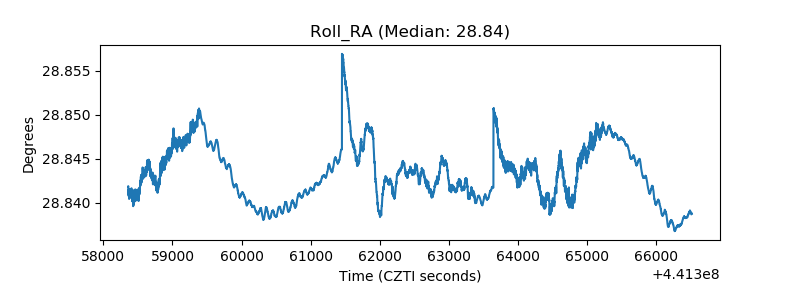 |
| Veto Counter | 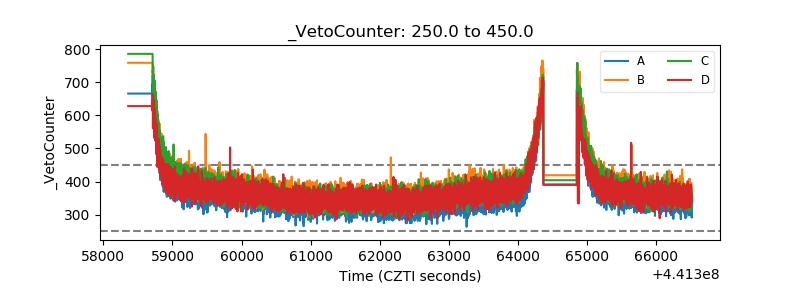 |