| Param | Original file | Final file |
|---|---|---|
| Filename | modeM0/AS1A13_009T03_9000006006_44595cztM0_level2.fits | modeM0/AS1A13_009T03_9000006006_44595cztM0_level2_quad_clean.evt |
| Size (bytes) | 629,475,840 | 115,968,960 |
| Size | 600.3 MB | 110.6 MB |
| Events in quadrant A | 6,523,860 | 795,805 |
| Events in quadrant B | 5,441,582 | 770,928 |
| Events in quadrant C | 4,408,906 | 755,164 |
| Events in quadrant D | 6,355,493 | 675,891 |
| Mode SS | |||
|---|---|---|---|
| Quadrant | BADHDUFLAG | Total packets | Discarded packets |
| A | 0 | 148 | 0 |
| B | 0 | 148 | 0 |
| C | 0 | 148 | 0 |
| D | 0 | 148 | 0 |
| Mode M0 | |||
|---|---|---|---|
| Quadrant | BADHDUFLAG | Total packets | Discarded packets |
| A | 0 | 24991 | 1 |
| B | 0 | 21172 | 0 |
| C | 0 | 18389 | 0 |
| D | 0 | 23728 | 0 |
| Quadrant | Total seconds | Saturated seconds | Saturation percentage |
|---|---|---|---|
| A | 7375 | 201 | 2.725424% |
| B | 7376 | 636 | 8.622560% |
| C | 7376 | 300 | 4.067245% |
| D | 7376 | 661 | 8.961497% |
Noise dominated data is calculated using 1-second bins in cleaned event files. If a bin has >2000 counts, and if more than 50% of those come from <1% of pixels, then it is considered to be noise-dominated and hence unusable.
| Quadrant | # 1 sec bins | Bins with >0 counts | Bins with >2000 counts | High rate bins dominated by noise | Noise dominated (total time) | Noise dominated (detector-on time) | Marked lightcurve |
|---|---|---|---|---|---|---|---|
| A | 7375 | 7375 | 113 | 113 | 1.53% | 1.53% | 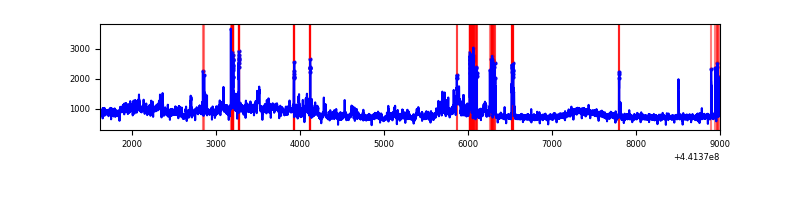 |
| B | 7376 | 7376 | 455 | 455 | 6.17% | 6.17% | 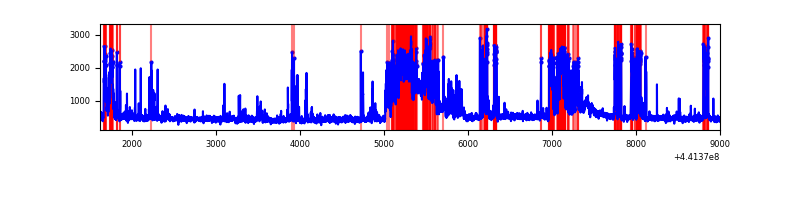 |
| C | 7376 | 7376 | 272 | 272 | 3.69% | 3.69% | 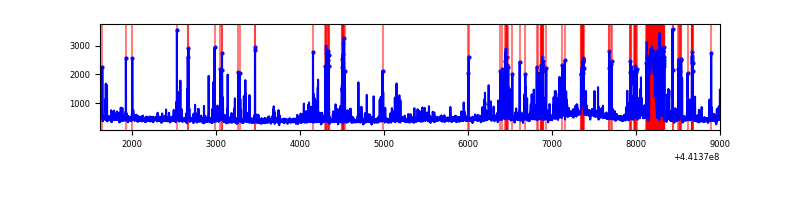 |
| D | 7376 | 7376 | 731 | 731 | 9.91% | 9.91% | 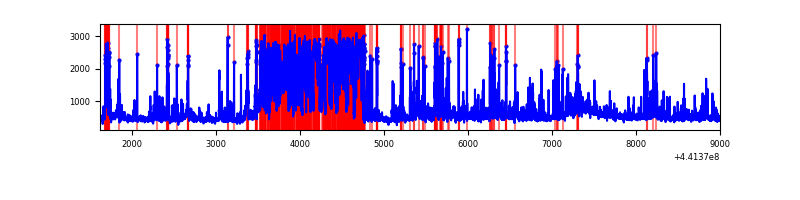 |
Top three noisy pixels from each quadrant. If the there are fewer than three noisy pixels in the level2.evt file, extra rows are filled as -1
| Pixel properties | Quadrant properties | ||||||
|---|---|---|---|---|---|---|---|
| Quadrant | DetID | PixID | Counts | Sigma | Mean | Median | Sigma |
| A | 10 | 83 | 1825894 | 10405.19 | 843 | 826 | 175.4 |
| A | 15 | 223 | 1303319 | 7425.85 | 843 | 826 | 175.4 |
| A | 13 | 248 | 60529 | 340.38 | 843 | 826 | 175.4 |
| B | 14 | 167 | 1014280 | 6227.63 | 816 | 792 | 162.7 |
| B | 5 | 172 | 983599 | 6039.11 | 816 | 792 | 162.7 |
| B | 0 | 155 | 56407 | 341.74 | 816 | 792 | 162.7 |
| C | 12 | 2 | 1077687 | 5684.65 | 807 | 812 | 189.4 |
| C | 14 | 254 | 134991 | 708.31 | 807 | 812 | 189.4 |
| C | 2 | 14 | 14656 | 73.08 | 807 | 812 | 189.4 |
| D | 8 | 48 | 1874985 | 9181.98 | 805 | 781 | 204.1 |
| D | 13 | 249 | 662853 | 3243.58 | 805 | 781 | 204.1 |
| D | 1 | 52 | 340449 | 1664.08 | 805 | 781 | 204.1 |
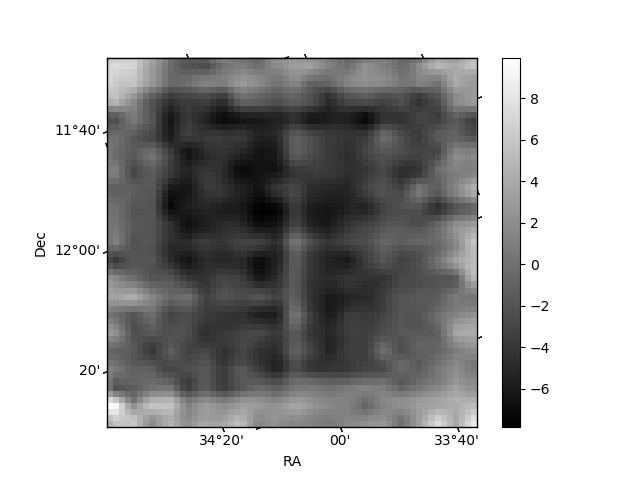
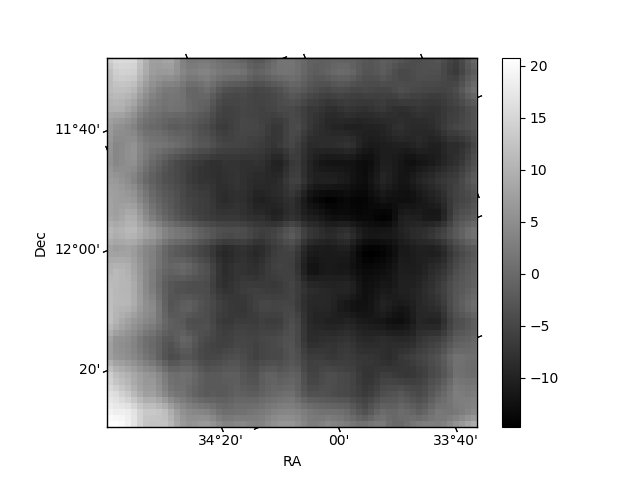
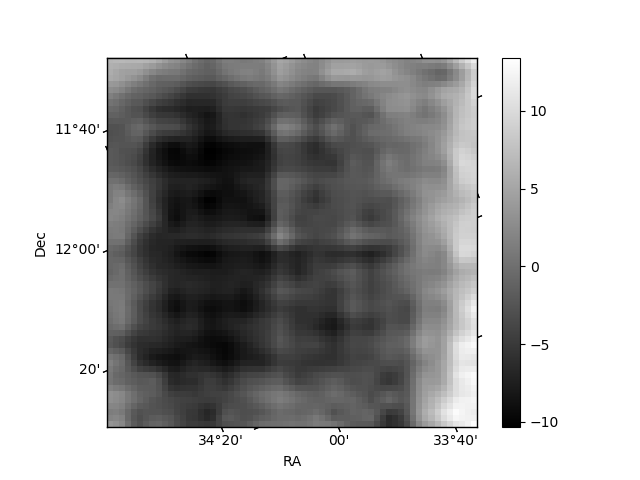
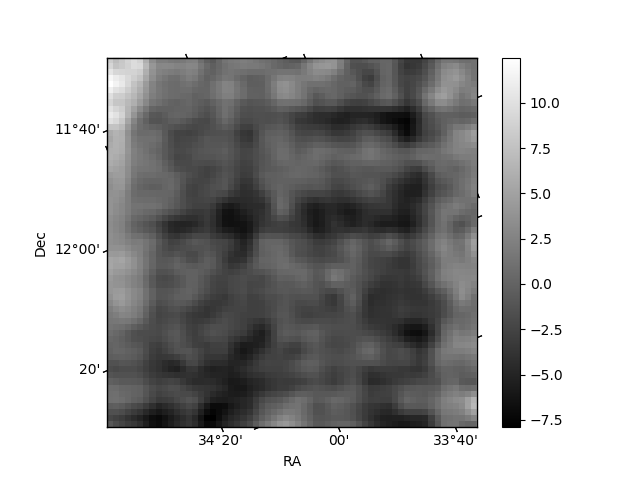
Histogram calculated using DETX and DETY for each event in the final _common_clean file
| Quadrant A | 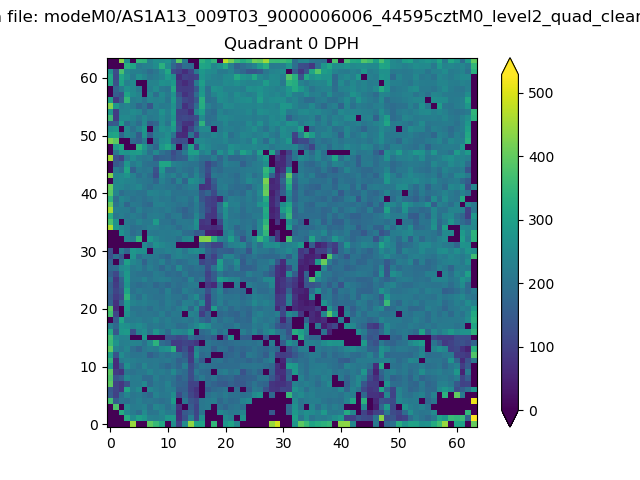 |
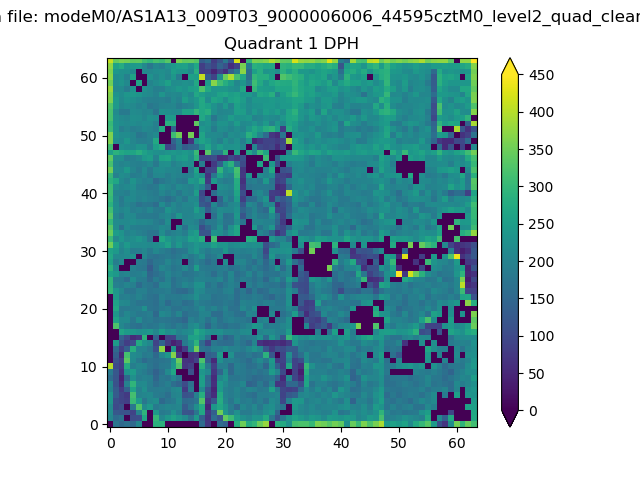 |
Quadrant B |
|---|---|---|---|
| Quadrant D | 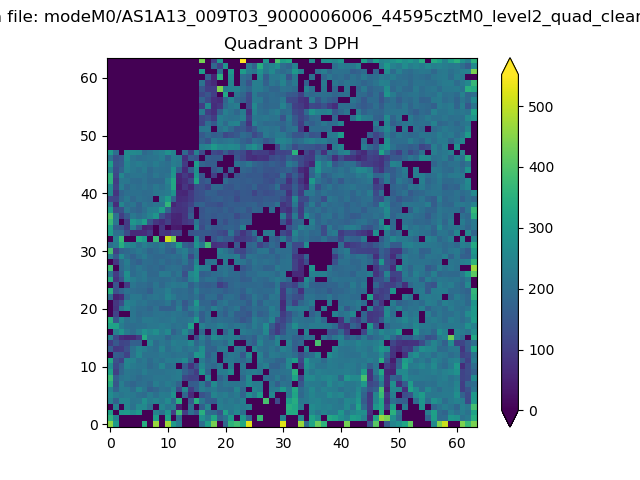 |
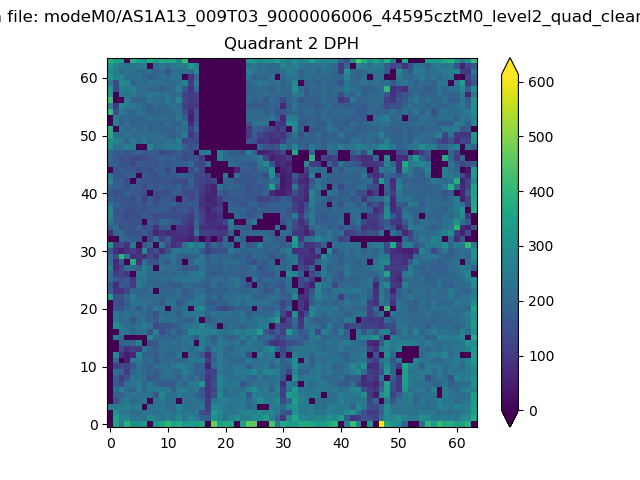 |
Quadrant C |
| Plot type | Count rate plots | Images |
|---|---|---|
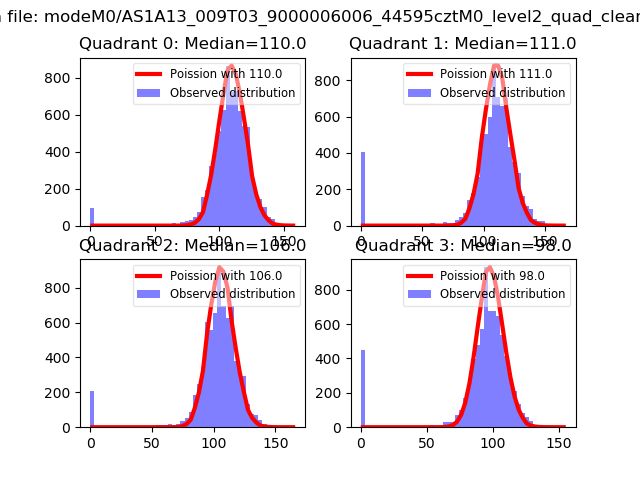
| Comparison with Poisson distribution Blue bars denote a histogram of data divided into 1 sec bins. Red curve is a Poisson curve with rate = median count rate of data. |
 |
 |
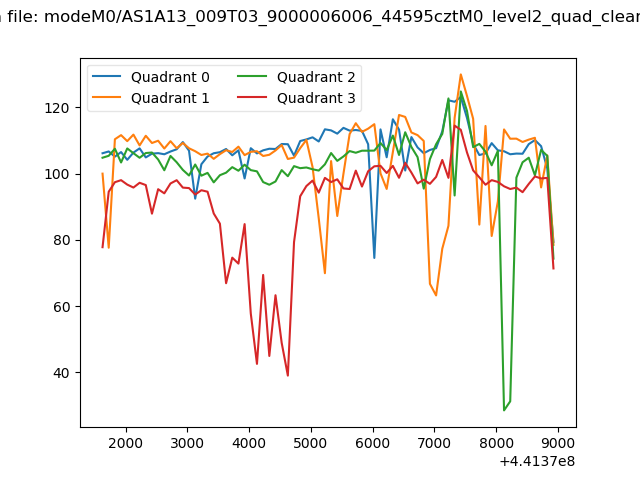
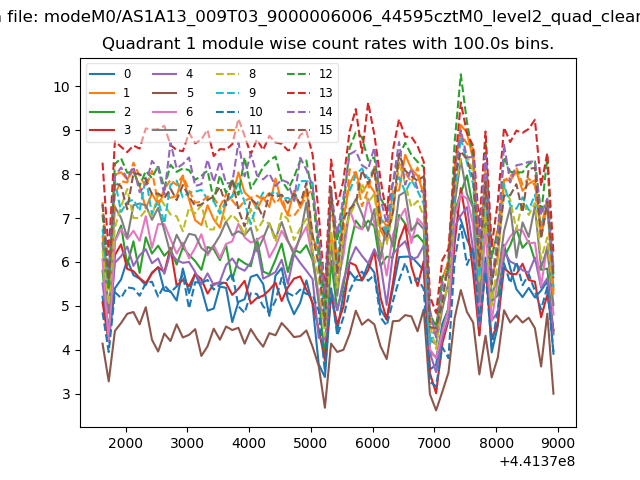
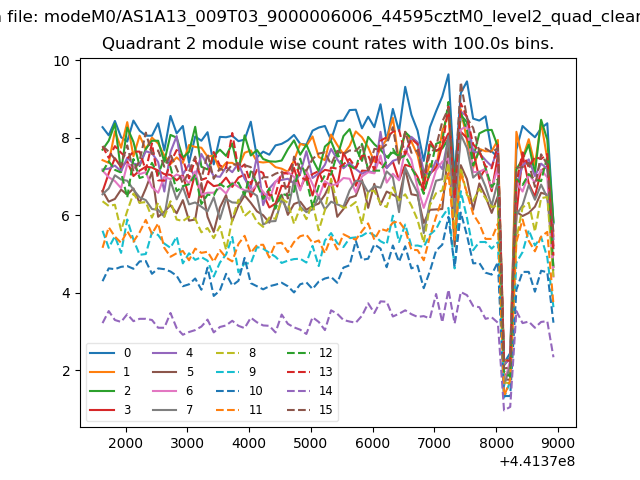
| Quadrant-wise count rates Data is divided into 100 sec bins |
 |
|
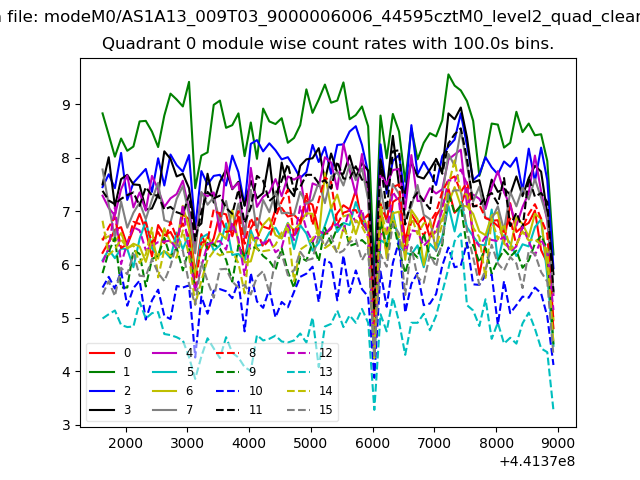
| Module-wise count rates for Quadrant A Data is divided into 100 sec bins |
 |
 |
| Module-wise count rates for Quadrant B Data is divided into 100 sec bins |
 |
 |
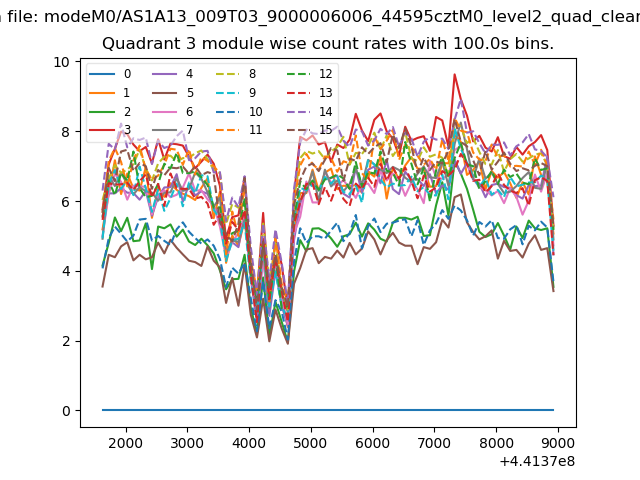
| Module-wise count rates for Quadrant C Data is divided into 100 sec bins |
 |
 |
| Module-wise count rates for Quadrant D Data is divided into 100 sec bins |
 |
 |
| Parameter | Plot |
|---|---|
| CZT HV Monitor | 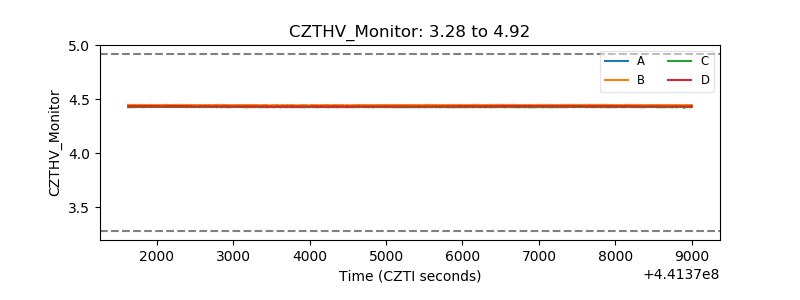 |
| D_VDD | 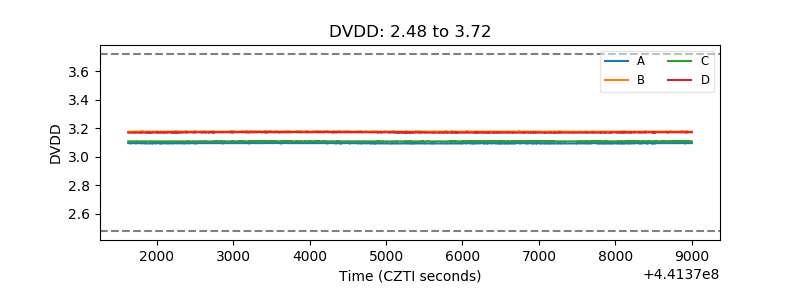 |
| Temperature 1 | 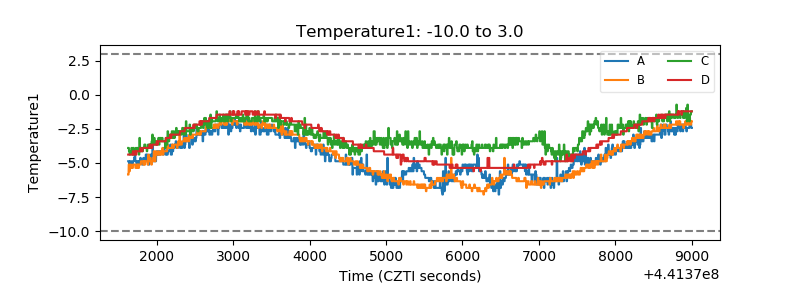 |
| Veto HV Monitor |  |
| Veto LLD | 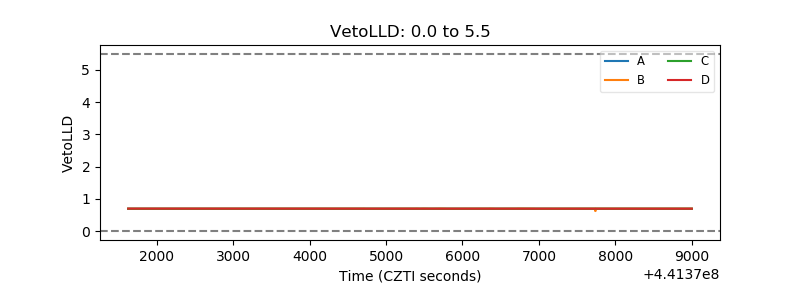 |
| Alpha Counter | 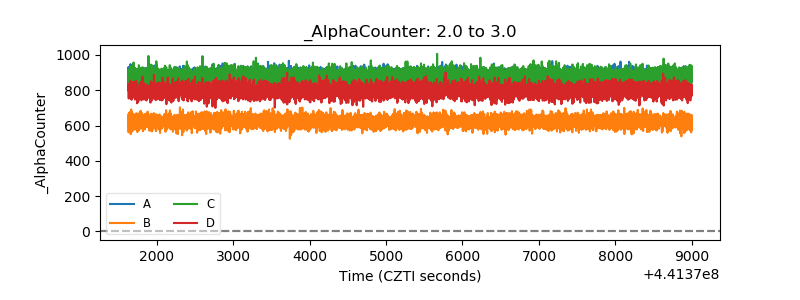 |
| _CPM_Rate | 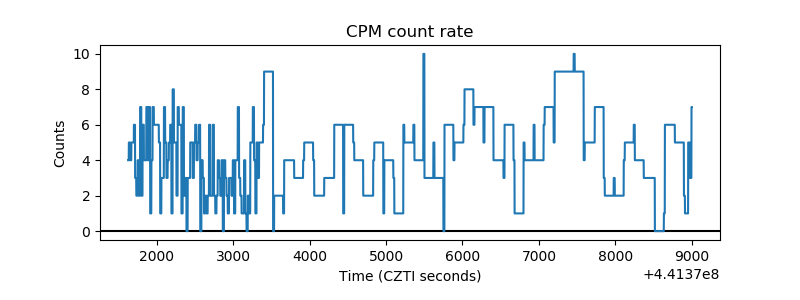 |
| CZT Counter | 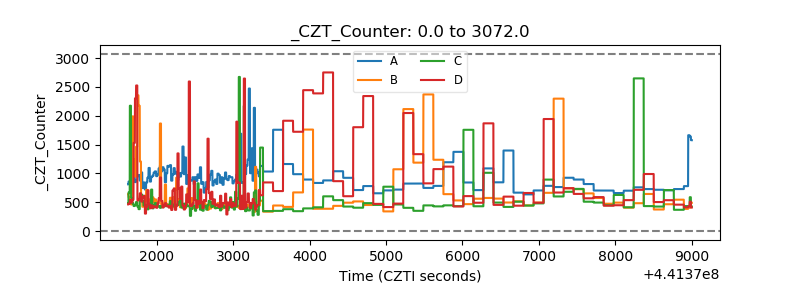 |
| +2.5 Volts monitor | 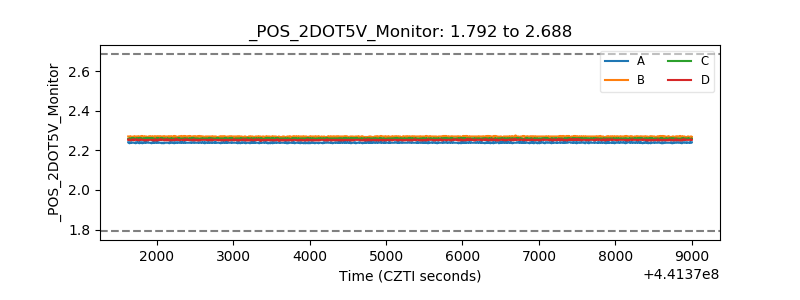 |
| +5 Volts monitor | 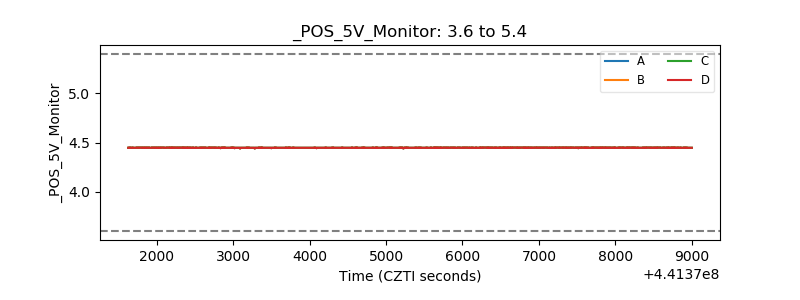 |
| _ROLL_ROT | 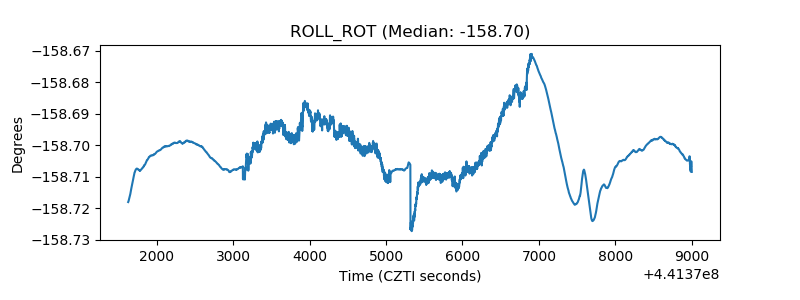 |
| _Roll_DEC | 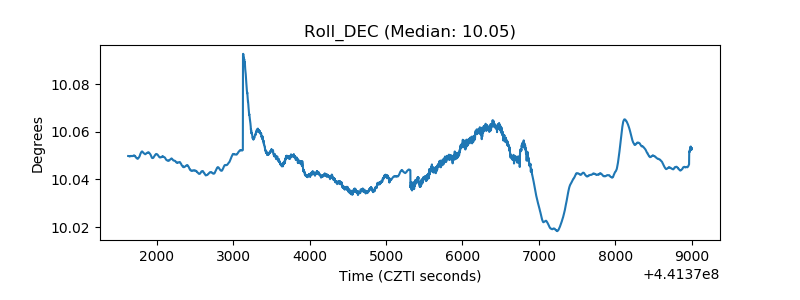 |
| _Roll_RA | 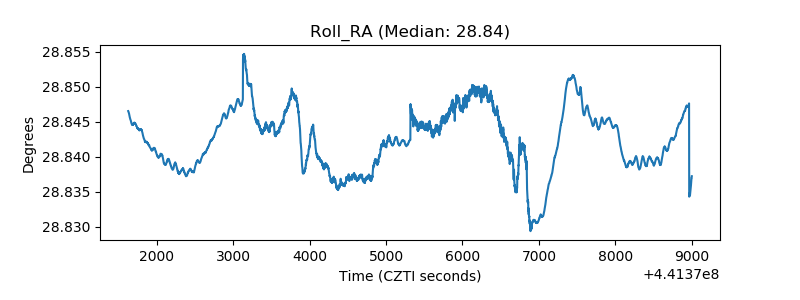 |
| Veto Counter | 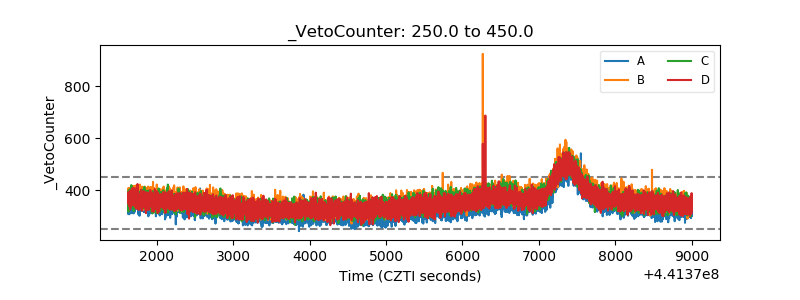 |