| Param | Original file | Final file |
|---|---|---|
| Filename | modeM0/AS1A13_009T03_9000006006_44598cztM0_level2.fits | modeM0/AS1A13_009T03_9000006006_44598cztM0_level2_quad_clean.evt |
| Size (bytes) | 659,381,760 | 109,641,600 |
| Size | 628.8 MB | 104.6 MB |
| Events in quadrant A | 5,439,599 | 780,572 |
| Events in quadrant B | 8,686,555 | 584,245 |
| Events in quadrant C | 3,901,682 | 764,899 |
| Events in quadrant D | 5,813,958 | 681,492 |
| Mode SS | |||
|---|---|---|---|
| Quadrant | BADHDUFLAG | Total packets | Discarded packets |
| A | 0 | 148 | 0 |
| B | 0 | 148 | 0 |
| C | 0 | 148 | 0 |
| D | 0 | 148 | 0 |
| Mode M9 | |||
|---|---|---|---|
| Quadrant | BADHDUFLAG | Total packets | Discarded packets |
| A | 0 | 3 | 0 |
| B | 0 | 3 | 0 |
| C | 0 | 3 | 0 |
| D | 0 | 3 | 0 |
| Mode M0 | |||
|---|---|---|---|
| Quadrant | BADHDUFLAG | Total packets | Discarded packets |
| A | 0 | 22341 | 1 |
| B | 0 | 30703 | 3 |
| C | 0 | 16837 | 7 |
| D | 0 | 22205 | 5 |
| Quadrant | Total seconds | Saturated seconds | Saturation percentage |
|---|---|---|---|
| A | 7303 | 248 | 3.395865% |
| B | 7303 | 2224 | 30.453238% |
| C | 7302 | 150 | 2.054232% |
| D | 7303 | 519 | 7.106668% |
Noise dominated data is calculated using 1-second bins in cleaned event files. If a bin has >2000 counts, and if more than 50% of those come from <1% of pixels, then it is considered to be noise-dominated and hence unusable.
| Quadrant | # 1 sec bins | Bins with >0 counts | Bins with >2000 counts | High rate bins dominated by noise | Noise dominated (total time) | Noise dominated (detector-on time) | Marked lightcurve |
|---|---|---|---|---|---|---|---|
| A | 7603 | 7303 | 18 | 18 | 0.24% | 0.25% | 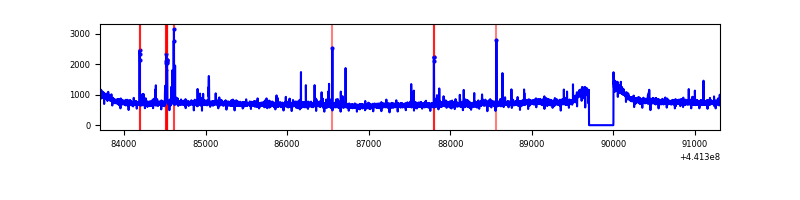 |
| B | 7604 | 7304 | 1917 | 1917 | 25.21% | 26.25% | 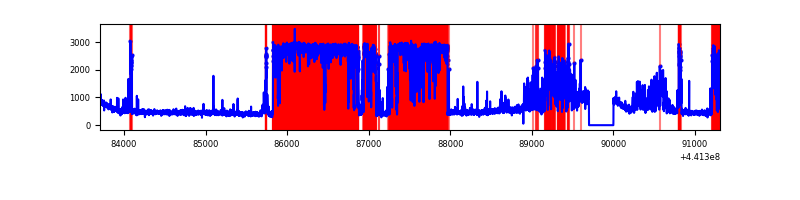 |
| C | 7604 | 7303 | 59 | 59 | 0.78% | 0.81% | 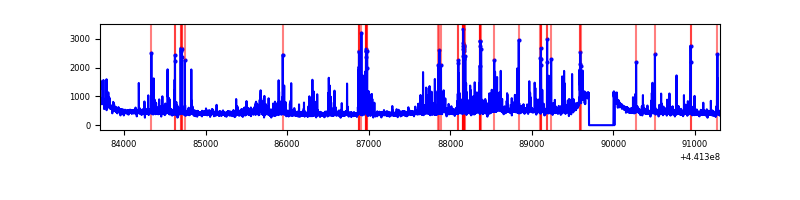 |
| D | 7602 | 7302 | 446 | 446 | 5.87% | 6.11% | 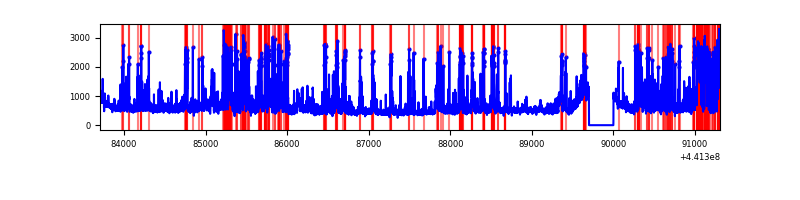 |
Top three noisy pixels from each quadrant. If the there are fewer than three noisy pixels in the level2.evt file, extra rows are filled as -1
| Pixel properties | Quadrant properties | ||||||
|---|---|---|---|---|---|---|---|
| Quadrant | DetID | PixID | Counts | Sigma | Mean | Median | Sigma |
| A | 10 | 83 | 1922049 | 10678.54 | 858 | 840 | 179.9 |
| A | 15 | 223 | 124238 | 685.88 | 858 | 840 | 179.9 |
| A | 13 | 248 | 42442 | 231.23 | 858 | 840 | 179.9 |
| B | 14 | 167 | 5670784 | 38897.09 | 718 | 696 | 145.8 |
| B | 5 | 172 | 108533 | 739.77 | 718 | 696 | 145.8 |
| B | 0 | 186 | 44785 | 302.45 | 718 | 696 | 145.8 |
| C | 12 | 2 | 376104 | 1904.04 | 829 | 836 | 197.1 |
| C | 12 | 250 | 150029 | 756.98 | 829 | 836 | 197.1 |
| C | 14 | 254 | 94934 | 477.44 | 829 | 836 | 197.1 |
| D | 13 | 249 | 1211635 | 5835.36 | 818 | 792 | 207.5 |
| D | 1 | 52 | 493219 | 2373.13 | 818 | 792 | 207.5 |
| D | 4 | 232 | 283136 | 1360.69 | 818 | 792 | 207.5 |
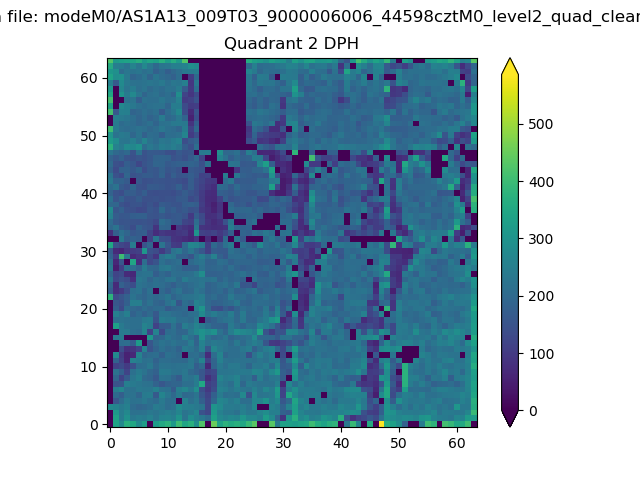
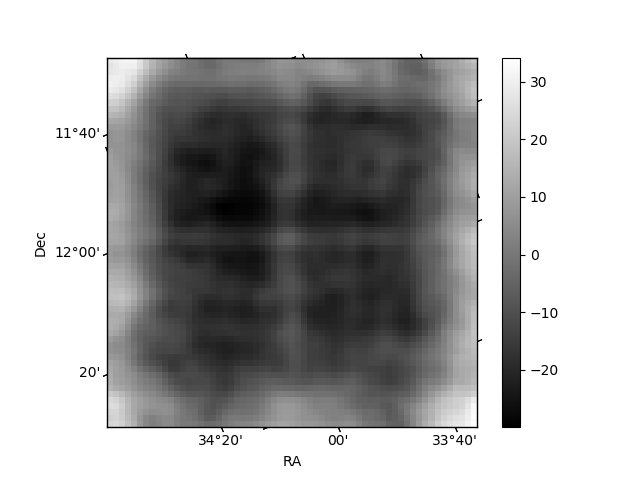
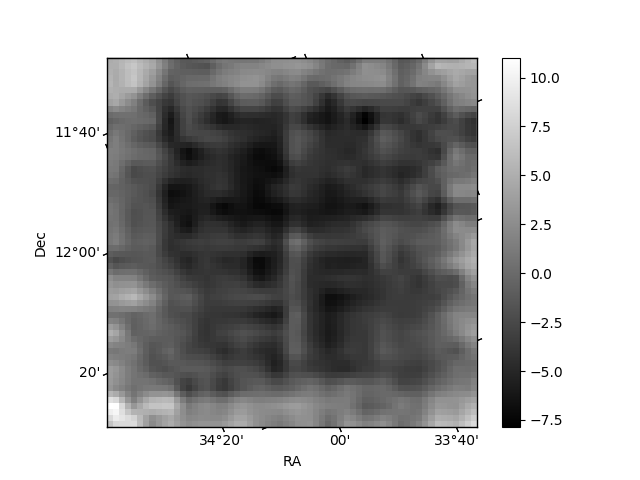
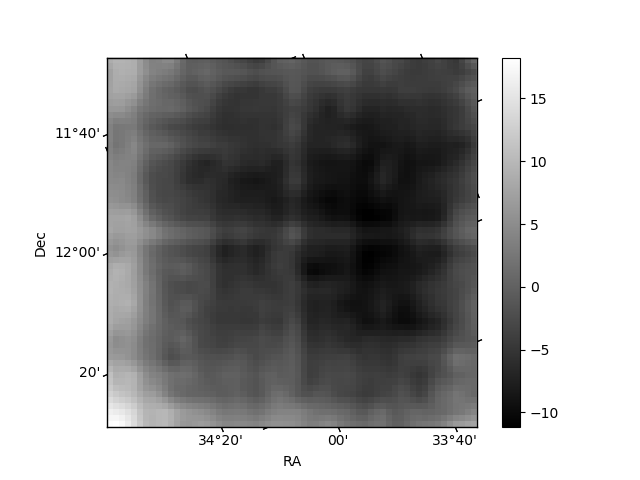
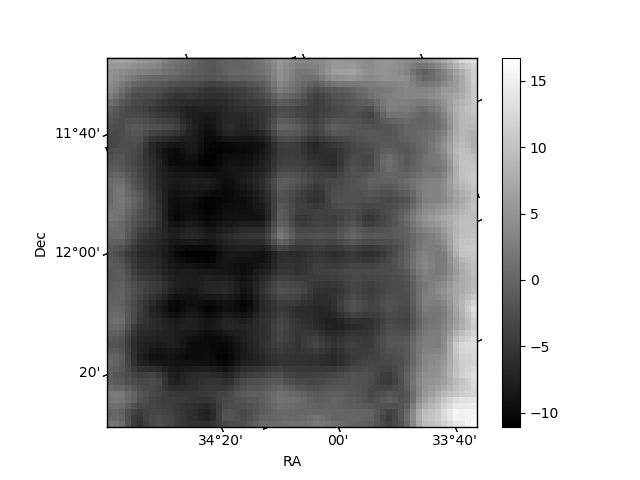
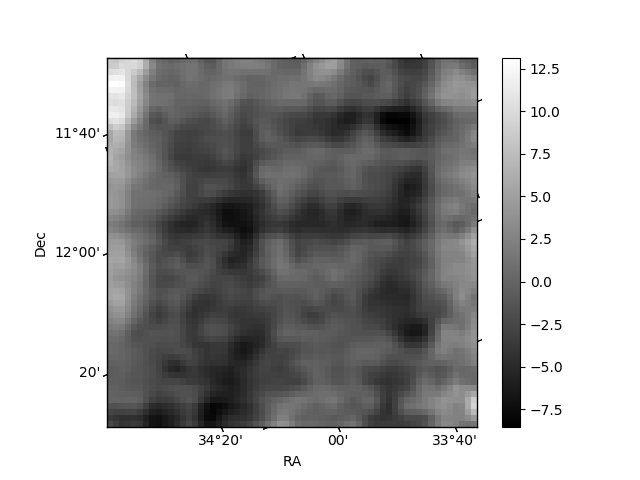
Histogram calculated using DETX and DETY for each event in the final _common_clean file
| Quadrant A | 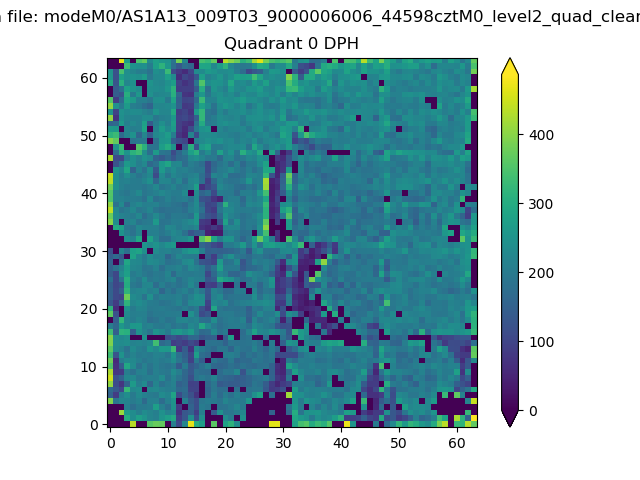 |
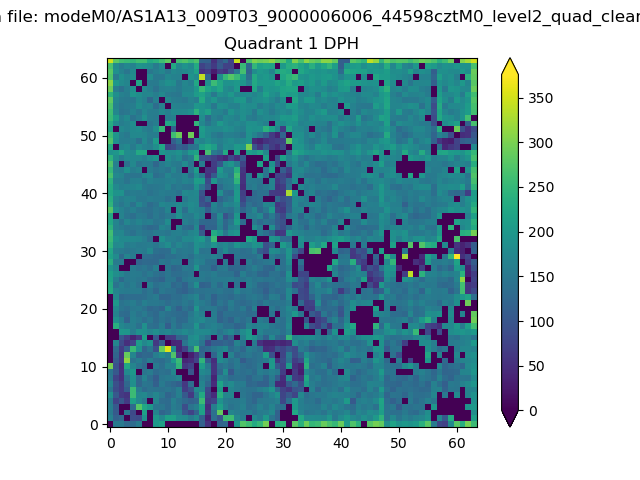 |
Quadrant B |
|---|---|---|---|
| Quadrant D | 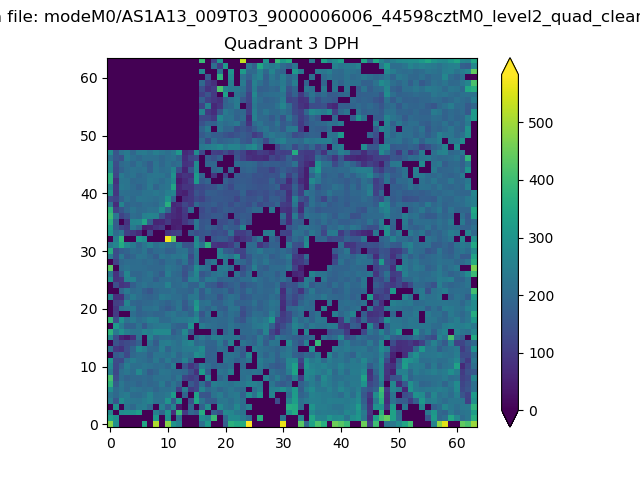 |
 |
Quadrant C |
| Plot type | Count rate plots | Images |
|---|---|---|
| Comparison with Poisson distribution Blue bars denote a histogram of data divided into 1 sec bins. Red curve is a Poisson curve with rate = median count rate of data. |
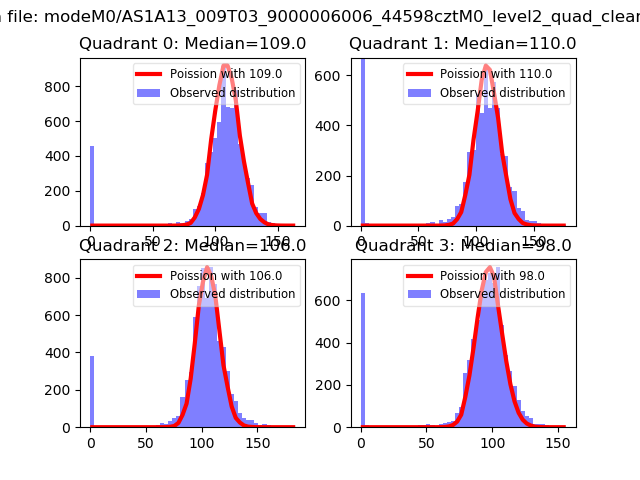 |
 |
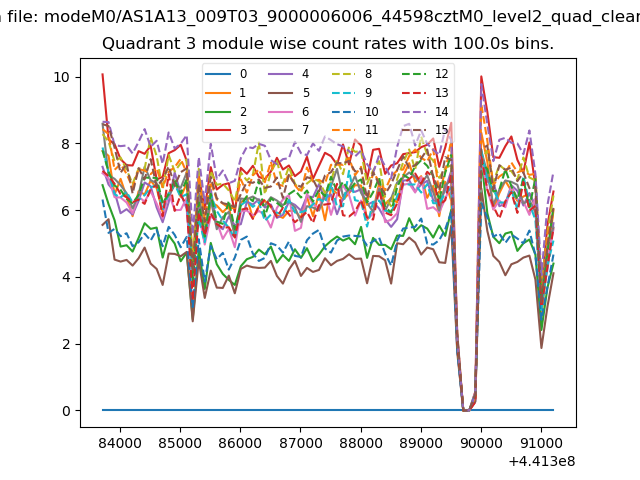
| Quadrant-wise count rates Data is divided into 100 sec bins |
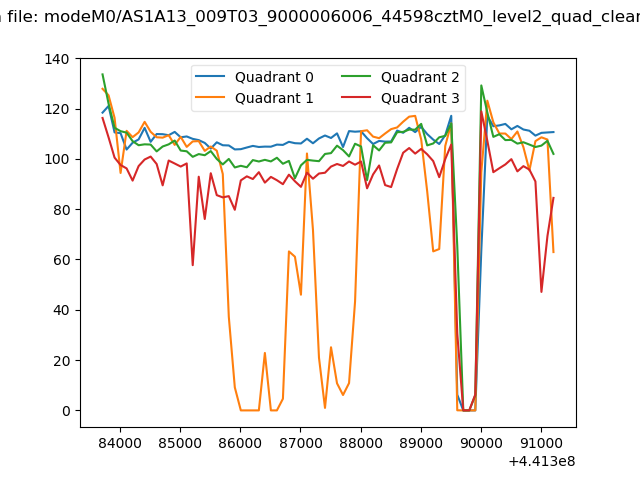 |
|
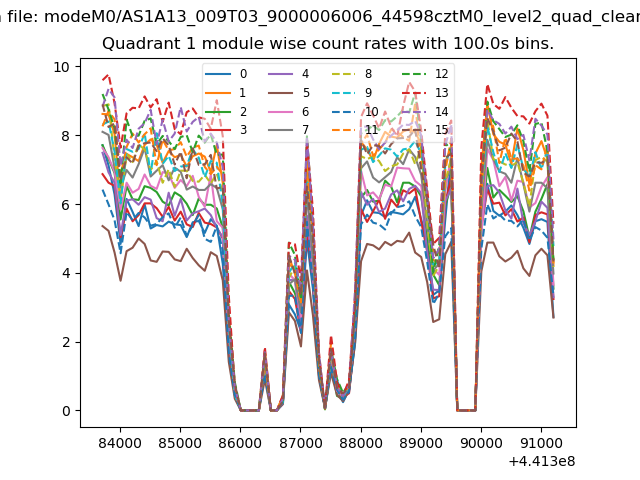
| Module-wise count rates for Quadrant A Data is divided into 100 sec bins |
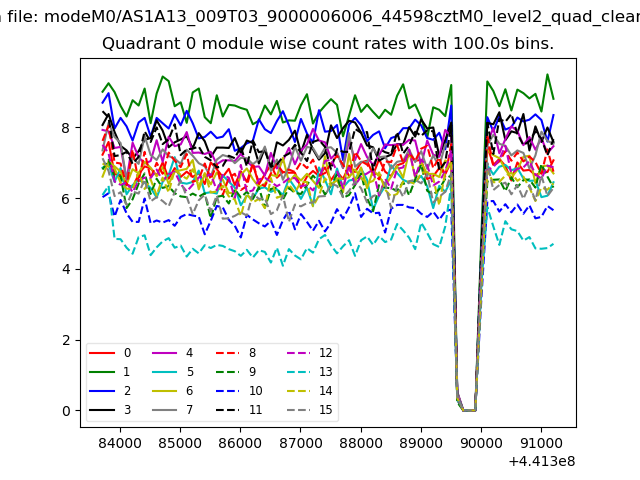 |
 |
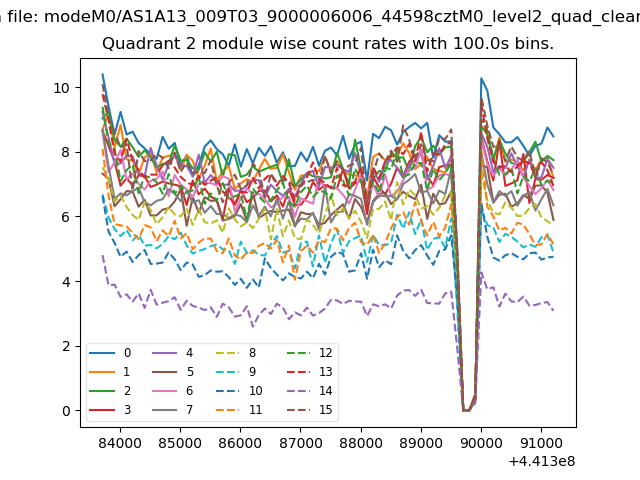
| Module-wise count rates for Quadrant B Data is divided into 100 sec bins |
 |
 |
| Module-wise count rates for Quadrant C Data is divided into 100 sec bins |
 |
 |
| Module-wise count rates for Quadrant D Data is divided into 100 sec bins |
 |
 |
| Parameter | Plot |
|---|---|
| CZT HV Monitor |  |
| D_VDD | 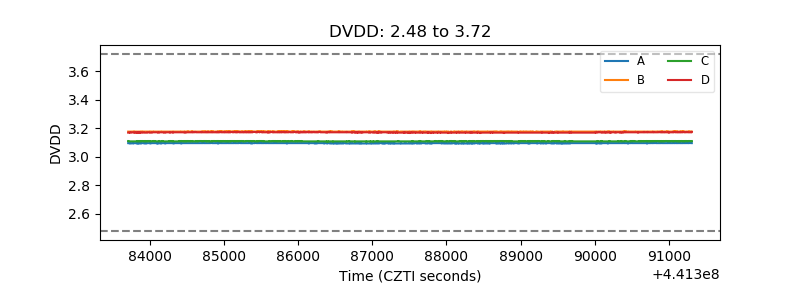 |
| Temperature 1 | 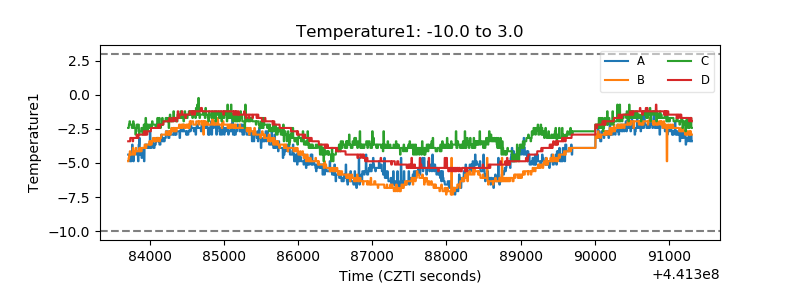 |
| Veto HV Monitor | 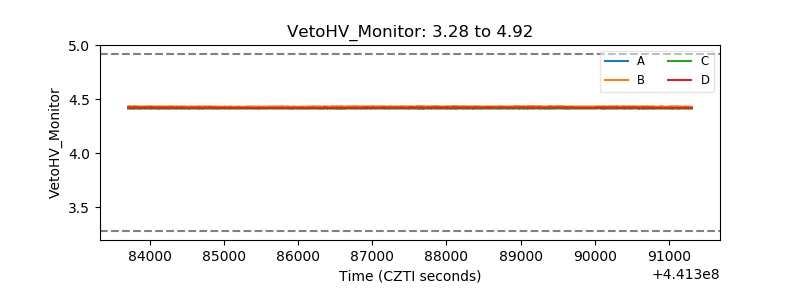 |
| Veto LLD | 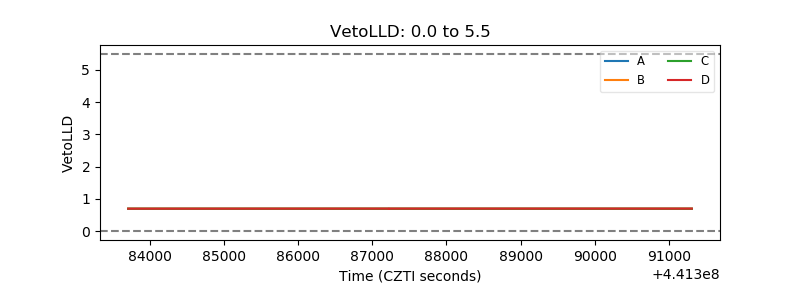 |
| Alpha Counter | 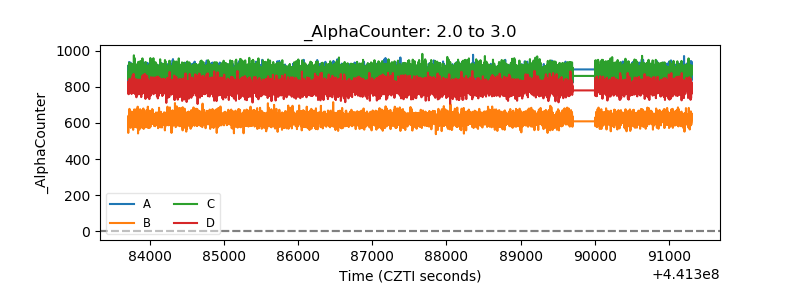 |
| _CPM_Rate | 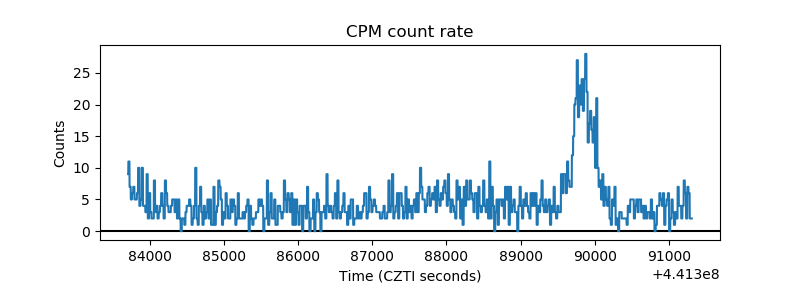 |
| CZT Counter | 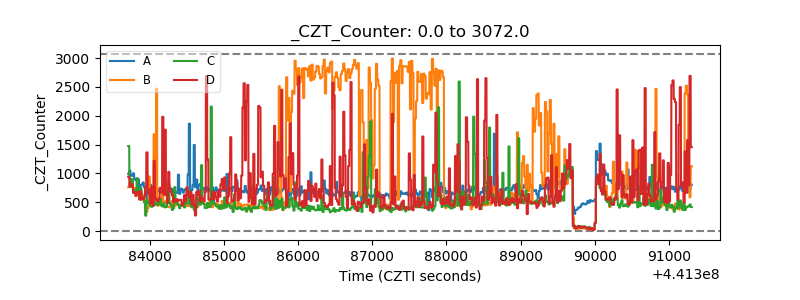 |
| +2.5 Volts monitor | 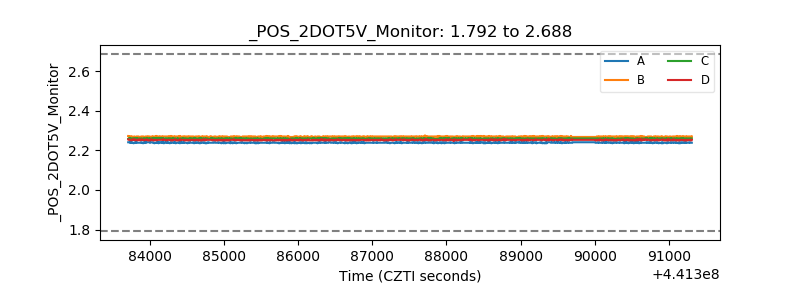 |
| +5 Volts monitor | 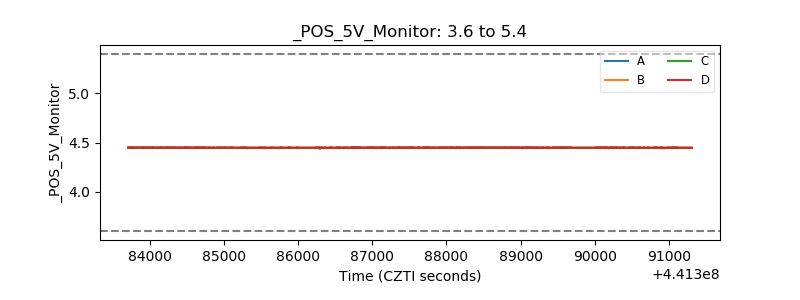 |
| _ROLL_ROT | 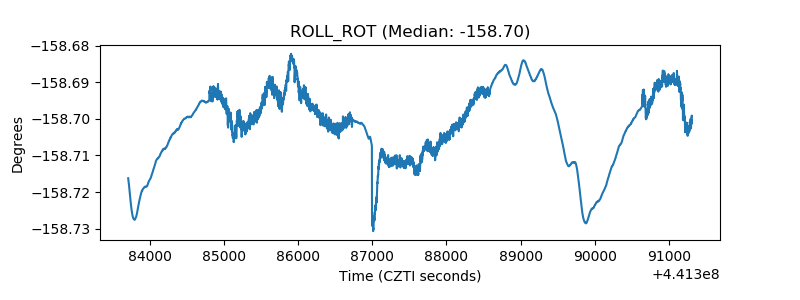 |
| _Roll_DEC | 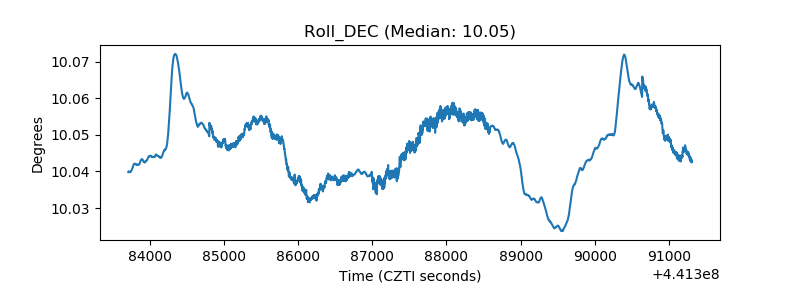 |
| _Roll_RA | 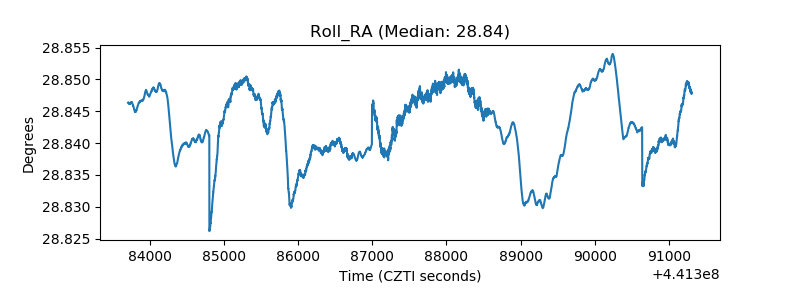 |
| Veto Counter | 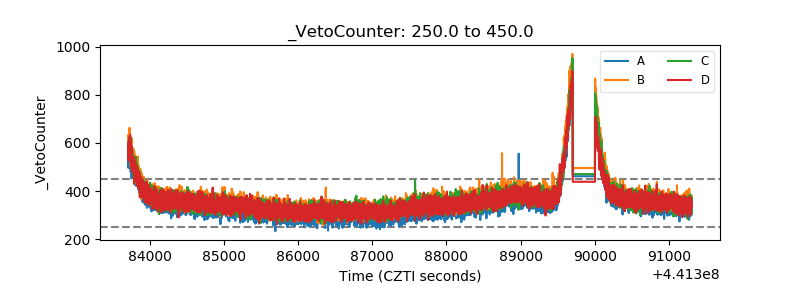 |