| Param | Original file | Final file |
|---|---|---|
| Filename | modeM0/AS1A13_009T03_9000006006_44599cztM0_level2.fits | modeM0/AS1A13_009T03_9000006006_44599cztM0_level2_quad_clean.evt |
| Size (bytes) | 1,061,939,520 | 181,330,560 |
| Size | 1012.7 MB | 172.9 MB |
| Events in quadrant A | 10,205,354 | 1,268,923 |
| Events in quadrant B | 12,404,569 | 1,062,119 |
| Events in quadrant C | 6,113,152 | 1,241,048 |
| Events in quadrant D | 9,654,211 | 1,083,034 |
| Mode SS | |||
|---|---|---|---|
| Quadrant | BADHDUFLAG | Total packets | Discarded packets |
| A | 0 | 246 | 0 |
| B | 0 | 246 | 0 |
| C | 0 | 246 | 0 |
| D | 0 | 246 | 0 |
| Mode M9 | |||
|---|---|---|---|
| Quadrant | BADHDUFLAG | Total packets | Discarded packets |
| A | 0 | 13 | 0 |
| B | 0 | 13 | 0 |
| C | 0 | 13 | 0 |
| D | 0 | 13 | 0 |
| Mode M0 | |||
|---|---|---|---|
| Quadrant | BADHDUFLAG | Total packets | Discarded packets |
| A | 0 | 39918 | 2 |
| B | 0 | 45094 | 2 |
| C | 0 | 26899 | 2 |
| D | 0 | 37177 | 2 |
| Quadrant | Total seconds | Saturated seconds | Saturation percentage |
|---|---|---|---|
| A | 12061 | 431 | 3.573501% |
| B | 12061 | 2512 | 20.827460% |
| C | 12060 | 188 | 1.558872% |
| D | 12060 | 992 | 8.225539% |
Noise dominated data is calculated using 1-second bins in cleaned event files. If a bin has >2000 counts, and if more than 50% of those come from <1% of pixels, then it is considered to be noise-dominated and hence unusable.
| Quadrant | # 1 sec bins | Bins with >0 counts | Bins with >2000 counts | High rate bins dominated by noise | Noise dominated (total time) | Noise dominated (detector-on time) | Marked lightcurve |
|---|---|---|---|---|---|---|---|
| A | 13476 | 12061 | 191 | 191 | 1.42% | 1.58% | 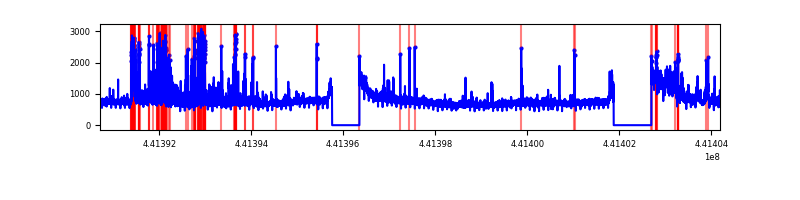 |
| B | 13475 | 12060 | 2271 | 2271 | 16.85% | 18.83% | 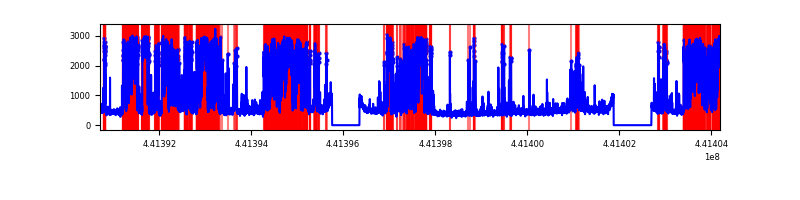 |
| C | 13475 | 12060 | 126 | 126 | 0.94% | 1.04% | 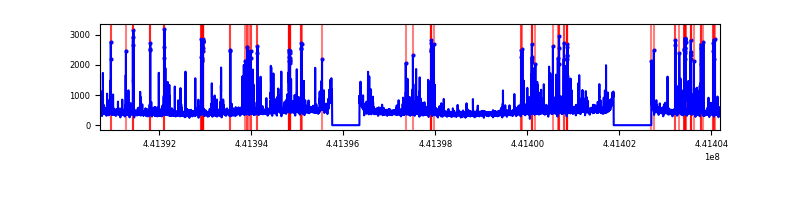 |
| D | 13475 | 12061 | 977 | 977 | 7.25% | 8.10% | 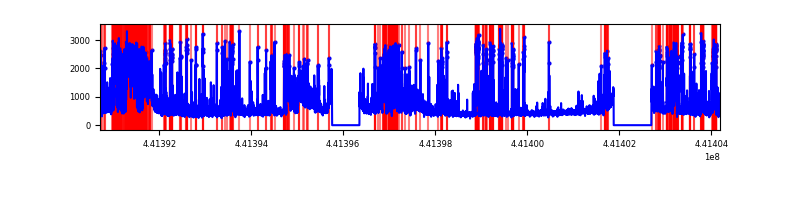 |
Top three noisy pixels from each quadrant. If the there are fewer than three noisy pixels in the level2.evt file, extra rows are filled as -1
| Pixel properties | Quadrant properties | ||||||
|---|---|---|---|---|---|---|---|
| Quadrant | DetID | PixID | Counts | Sigma | Mean | Median | Sigma |
| A | 10 | 83 | 3273739 | 11819.34 | 1336 | 1306 | 276.9 |
| A | 15 | 223 | 1608299 | 5804.12 | 1336 | 1306 | 276.9 |
| A | 13 | 248 | 109104 | 389.34 | 1336 | 1306 | 276.9 |
| B | 14 | 167 | 7144455 | 29124.69 | 1228 | 1190 | 245.3 |
| B | 5 | 172 | 192417 | 779.67 | 1228 | 1190 | 245.3 |
| B | 0 | 219 | 142388 | 575.69 | 1228 | 1190 | 245.3 |
| C | 12 | 2 | 654597 | 2112.71 | 1310 | 1317 | 309.2 |
| C | 14 | 254 | 189621 | 608.98 | 1310 | 1317 | 309.2 |
| C | 12 | 250 | 113594 | 363.1 | 1310 | 1317 | 309.2 |
| D | 13 | 249 | 2502979 | 7808.96 | 1279 | 1243 | 320.4 |
| D | 1 | 52 | 753491 | 2348.08 | 1279 | 1243 | 320.4 |
| D | 5 | 222 | 581785 | 1812.11 | 1279 | 1243 | 320.4 |
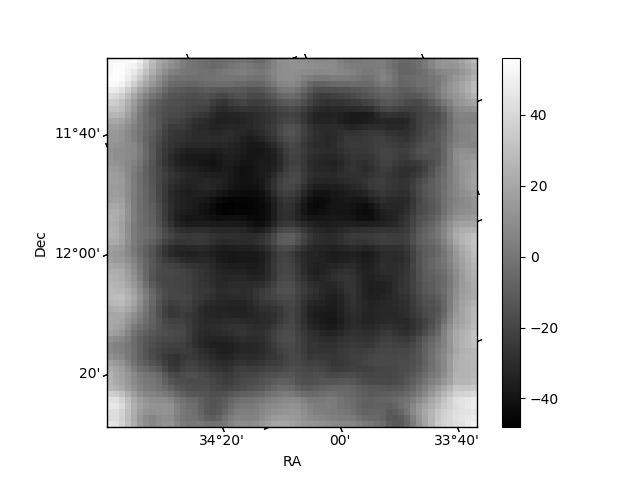
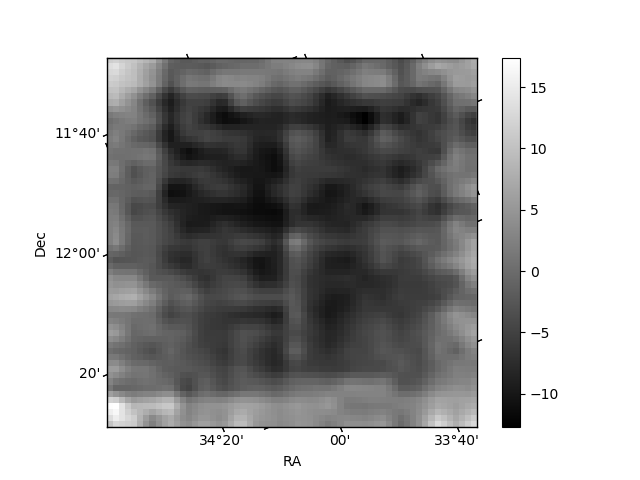
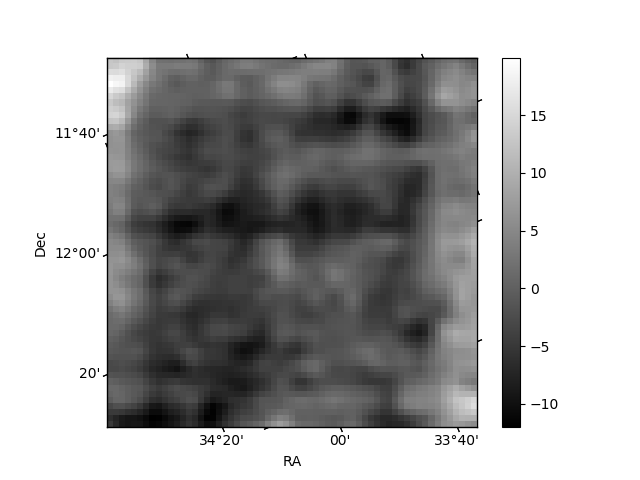
Histogram calculated using DETX and DETY for each event in the final _common_clean file
| Quadrant A | 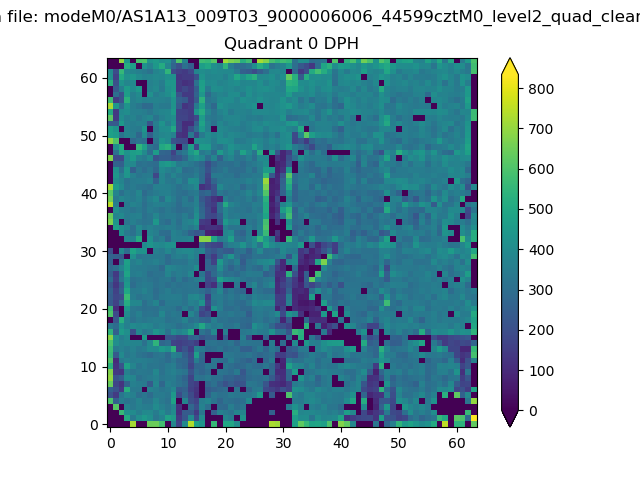 |
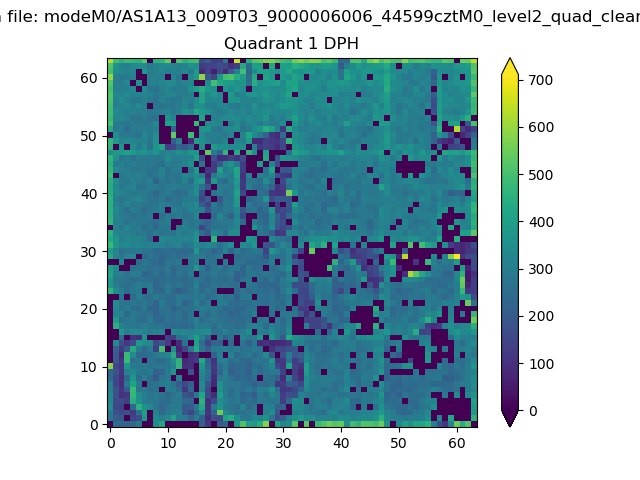 |
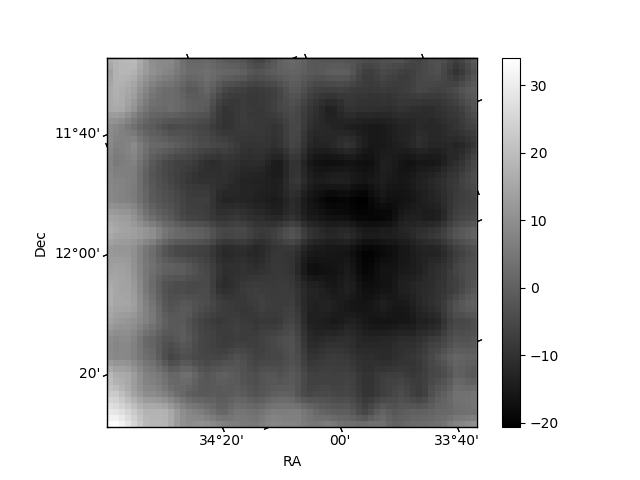
Quadrant B |
|---|---|---|---|
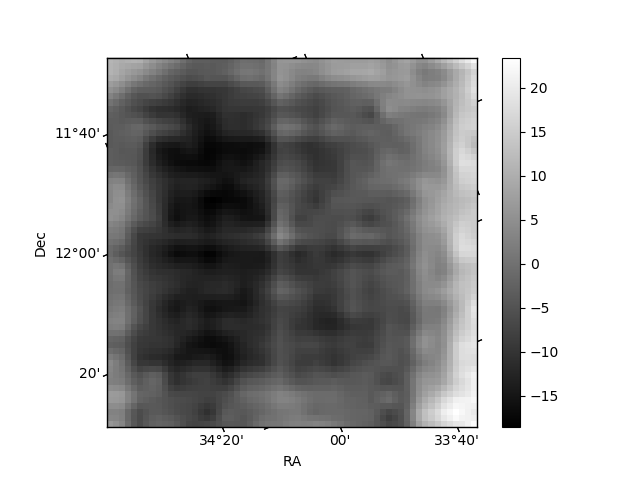
| Quadrant D | 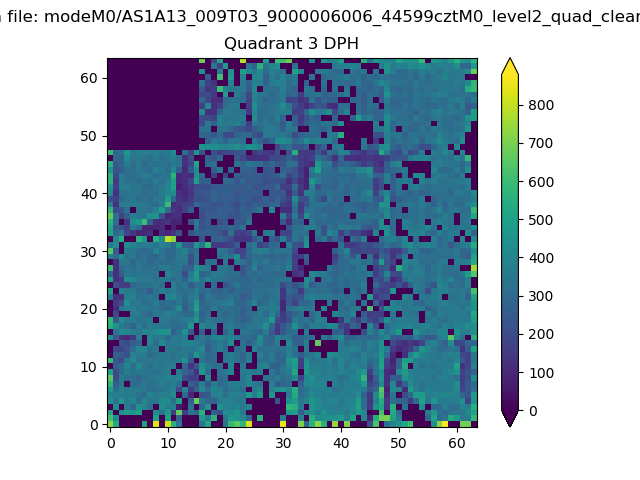 |
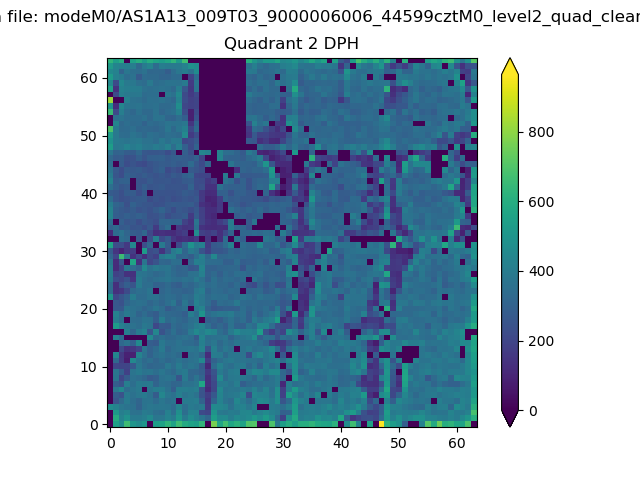 |
Quadrant C |
| Plot type | Count rate plots | Images |
|---|---|---|
| Comparison with Poisson distribution Blue bars denote a histogram of data divided into 1 sec bins. Red curve is a Poisson curve with rate = median count rate of data. |
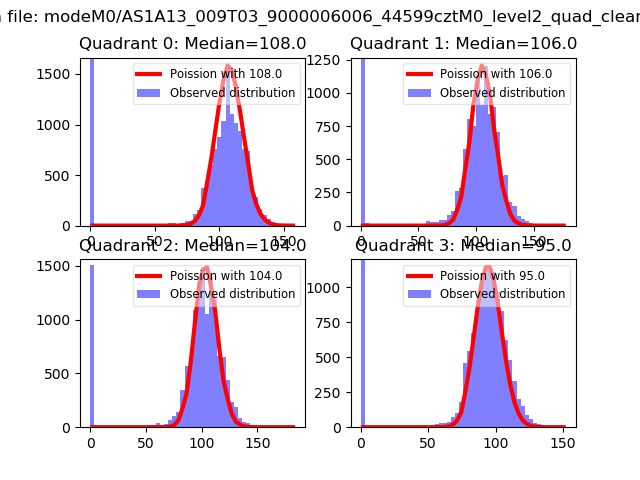 |
 |
| Quadrant-wise count rates Data is divided into 100 sec bins |
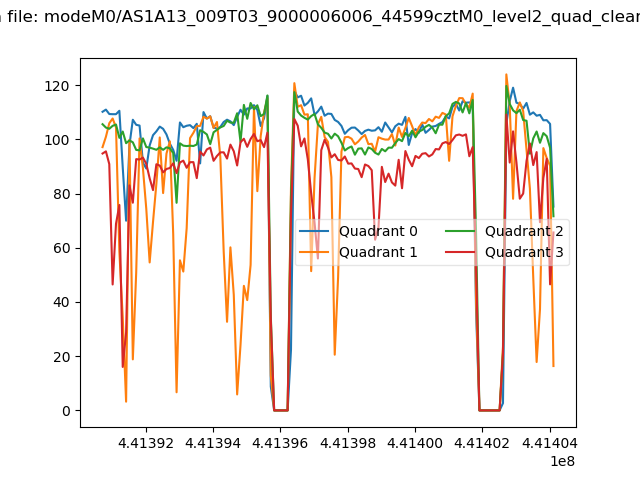 |
|
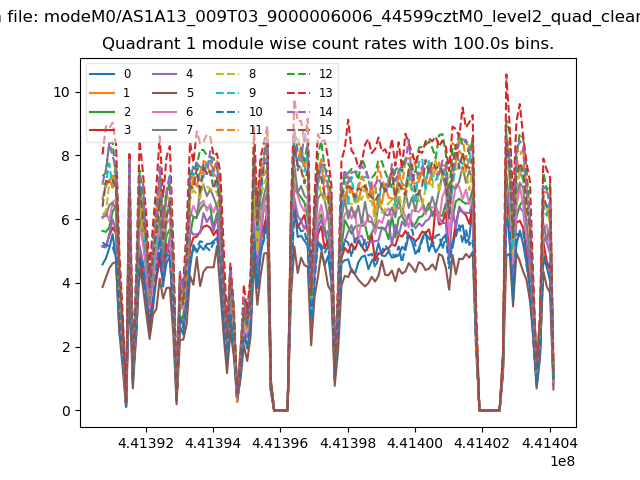
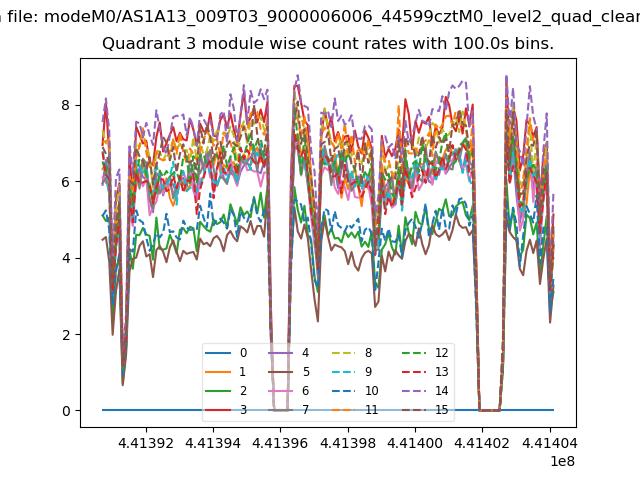
| Module-wise count rates for Quadrant A Data is divided into 100 sec bins |
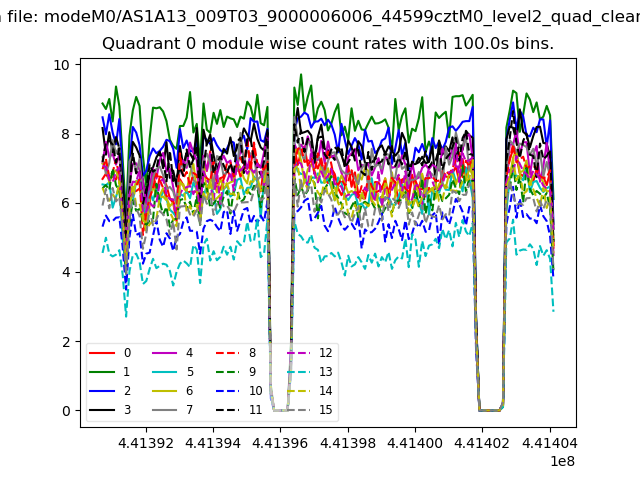 |
 |
| Module-wise count rates for Quadrant B Data is divided into 100 sec bins |
 |
 |
| Module-wise count rates for Quadrant C Data is divided into 100 sec bins |
 |
 |
| Module-wise count rates for Quadrant D Data is divided into 100 sec bins |
 |
 |
| Parameter | Plot |
|---|---|
| CZT HV Monitor | 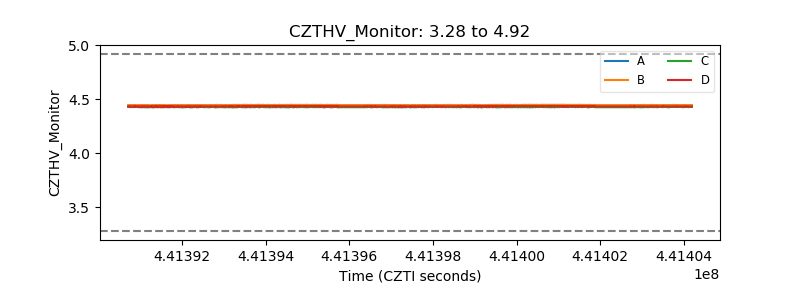 |
| D_VDD | 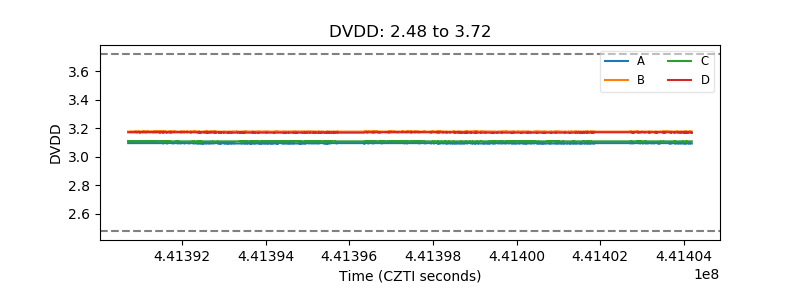 |
| Temperature 1 | 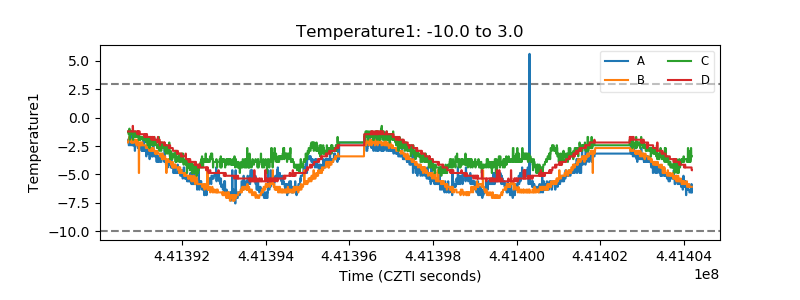 |
| Veto HV Monitor | 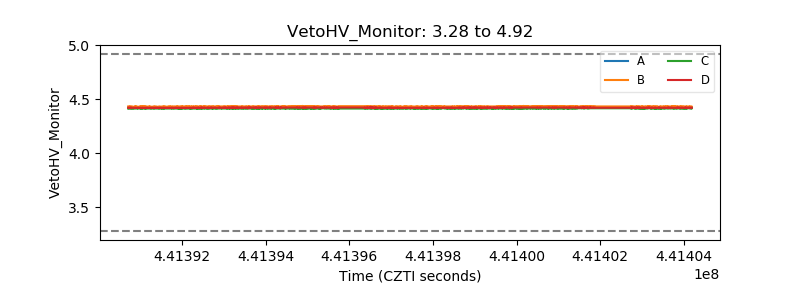 |
| Veto LLD | 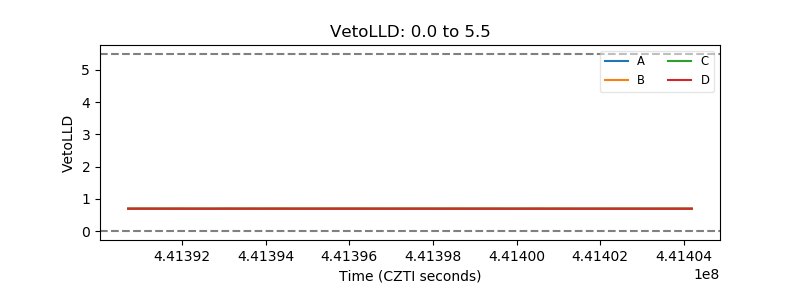 |
| Alpha Counter | 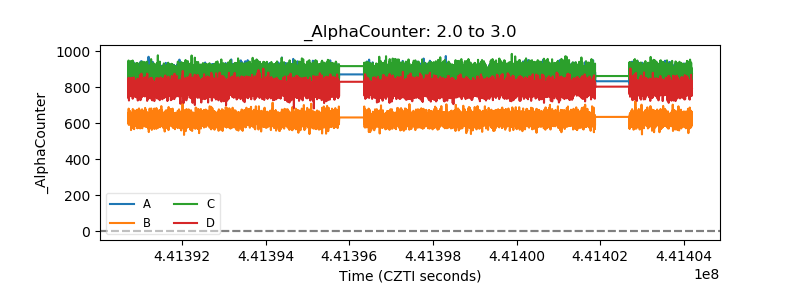 |
| _CPM_Rate | 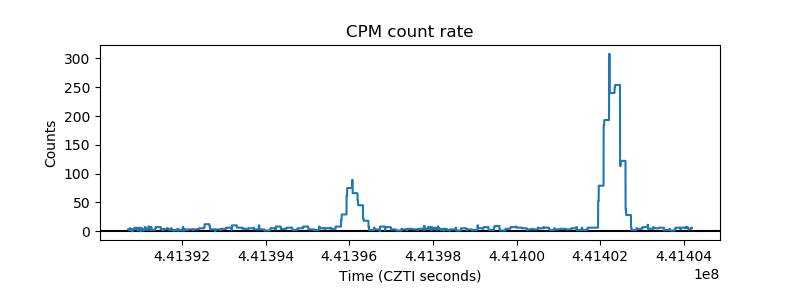 |
| CZT Counter | 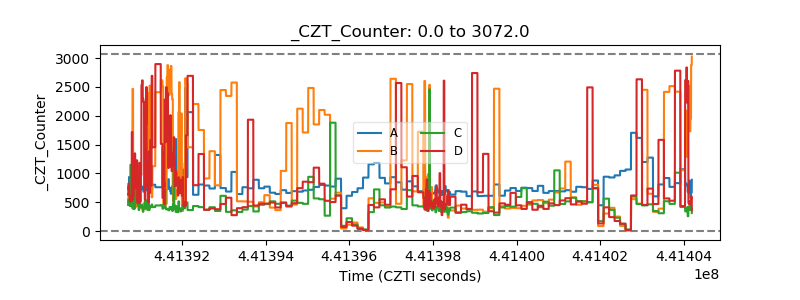 |
| +2.5 Volts monitor | 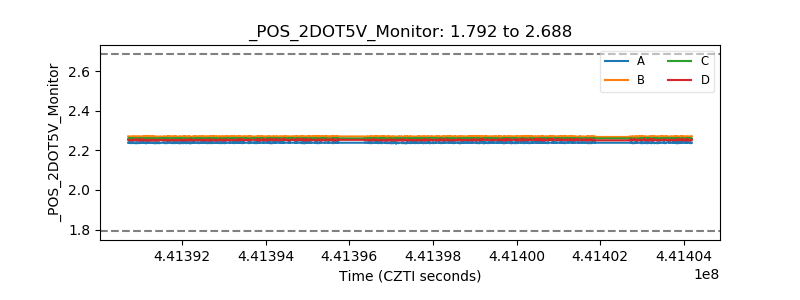 |
| +5 Volts monitor | 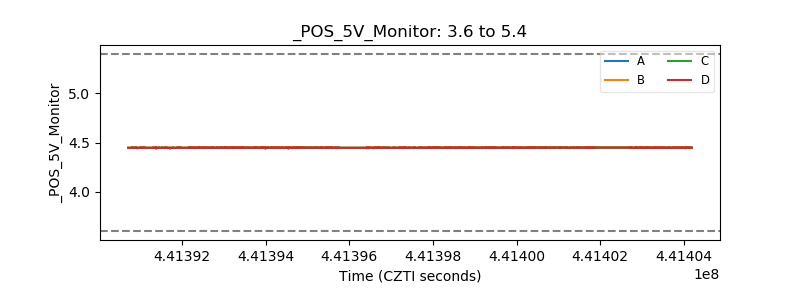 |
| _ROLL_ROT | 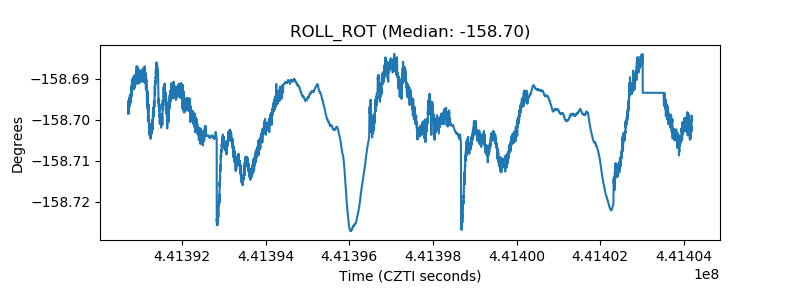 |
| _Roll_DEC | 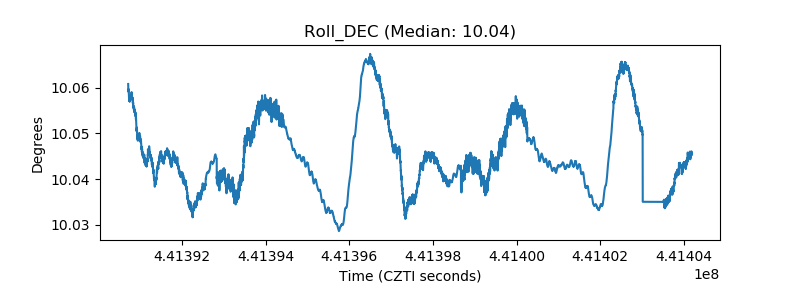 |
| _Roll_RA | 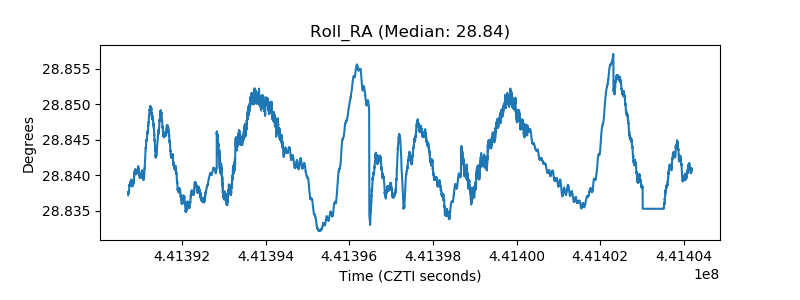 |
| Veto Counter | 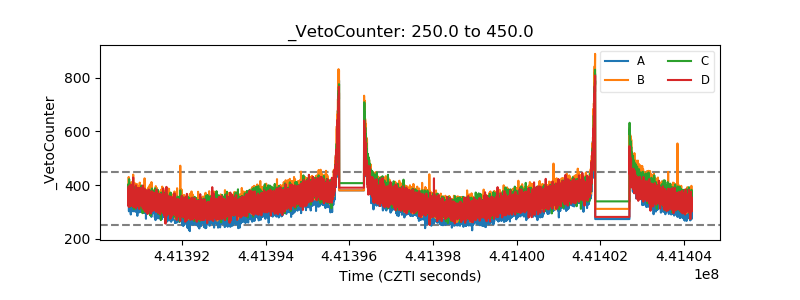 |