| Param | Original file | Final file |
|---|---|---|
| Filename | modeM0/AS1A13_009T03_9000006006_44600cztM0_level2.fits | modeM0/AS1A13_009T03_9000006006_44600cztM0_level2_quad_clean.evt |
| Size (bytes) | 578,131,200 | 103,006,080 |
| Size | 551.3 MB | 98.2 MB |
| Events in quadrant A | 6,791,588 | 676,321 |
| Events in quadrant B | 5,693,993 | 655,650 |
| Events in quadrant C | 3,456,459 | 707,305 |
| Events in quadrant D | 4,939,065 | 612,821 |
| Mode SS | |||
|---|---|---|---|
| Quadrant | BADHDUFLAG | Total packets | Discarded packets |
| A | 0 | 136 | 0 |
| B | 0 | 136 | 0 |
| C | 0 | 136 | 0 |
| D | 0 | 136 | 0 |
| Mode M9 | |||
|---|---|---|---|
| Quadrant | BADHDUFLAG | Total packets | Discarded packets |
| A | 0 | 16 | 0 |
| B | 0 | 17 | 0 |
| C | 0 | 17 | 0 |
| D | 0 | 17 | 0 |
| Mode M0 | |||
|---|---|---|---|
| Quadrant | BADHDUFLAG | Total packets | Discarded packets |
| A | 0 | 25403 | 2 |
| B | 0 | 21396 | 2 |
| C | 0 | 15054 | 2 |
| D | 0 | 19166 | 2 |
| Quadrant | Total seconds | Saturated seconds | Saturation percentage |
|---|---|---|---|
| A | 6696 | 650 | 9.707288% |
| B | 6696 | 917 | 13.694743% |
| C | 6696 | 108 | 1.612903% |
| D | 6696 | 552 | 8.243728% |
Noise dominated data is calculated using 1-second bins in cleaned event files. If a bin has >2000 counts, and if more than 50% of those come from <1% of pixels, then it is considered to be noise-dominated and hence unusable.
| Quadrant | # 1 sec bins | Bins with >0 counts | Bins with >2000 counts | High rate bins dominated by noise | Noise dominated (total time) | Noise dominated (detector-on time) | Marked lightcurve |
|---|---|---|---|---|---|---|---|
| A | 7696 | 6696 | 518 | 518 | 6.73% | 7.74% | 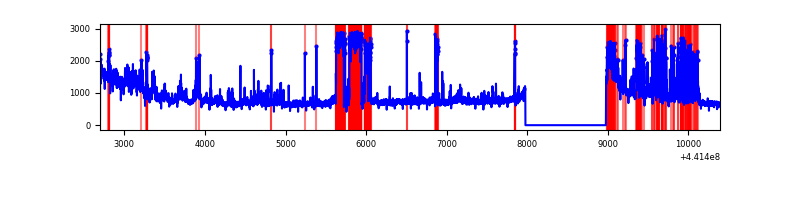 |
| B | 7696 | 6696 | 907 | 907 | 11.79% | 13.55% | 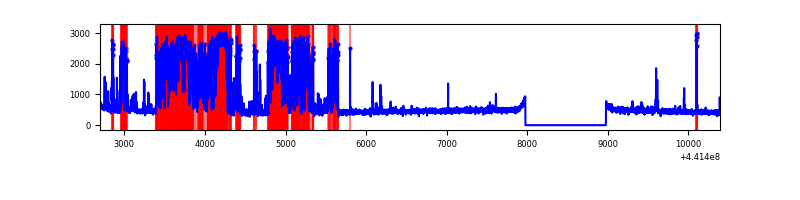 |
| C | 7696 | 6697 | 97 | 97 | 1.26% | 1.45% | 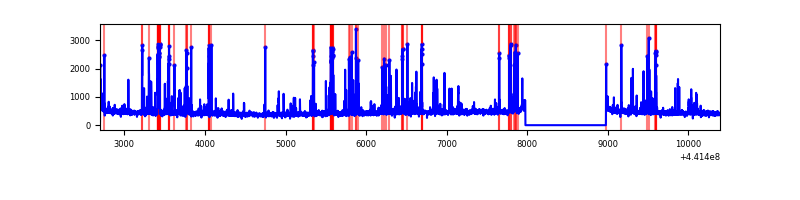 |
| D | 7696 | 6696 | 531 | 531 | 6.90% | 7.93% | 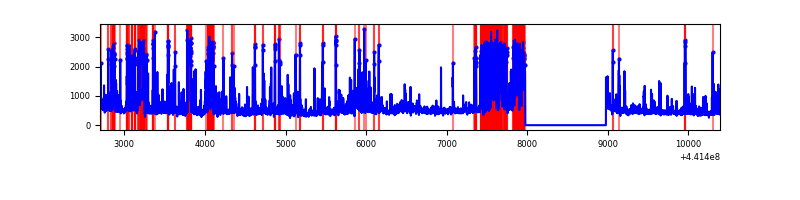 |
Top three noisy pixels from each quadrant. If the there are fewer than three noisy pixels in the level2.evt file, extra rows are filled as -1
| Pixel properties | Quadrant properties | ||||||
|---|---|---|---|---|---|---|---|
| Quadrant | DetID | PixID | Counts | Sigma | Mean | Median | Sigma |
| A | 10 | 83 | 1867099 | 12644.68 | 717 | 704 | 147.6 |
| A | 15 | 223 | 1119027 | 7576.55 | 717 | 704 | 147.6 |
| A | 9 | 191 | 948638 | 6422.18 | 717 | 704 | 147.6 |
| B | 14 | 167 | 2809385 | 19942.81 | 710 | 687 | 140.8 |
| B | 5 | 172 | 49281 | 345.03 | 710 | 687 | 140.8 |
| B | 12 | 111 | 17840 | 121.79 | 710 | 687 | 140.8 |
| C | 12 | 2 | 535557 | 3108.09 | 728 | 734 | 172.1 |
| C | 14 | 254 | 49894 | 285.69 | 728 | 734 | 172.1 |
| C | 3 | 233 | 18084 | 100.83 | 728 | 734 | 172.1 |
| D | 1 | 52 | 1097609 | 6244.43 | 702 | 683 | 175.7 |
| D | 13 | 249 | 525852 | 2989.61 | 702 | 683 | 175.7 |
| D | 2 | 249 | 345999 | 1965.77 | 702 | 683 | 175.7 |
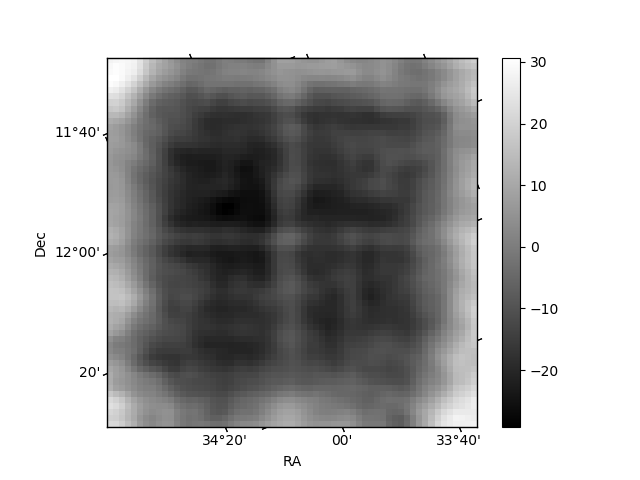
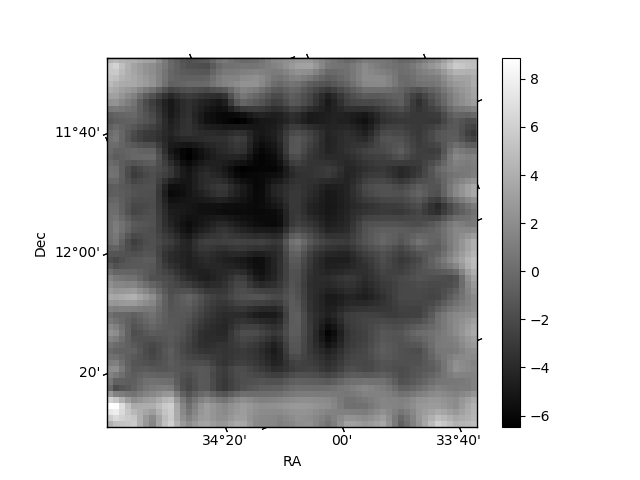
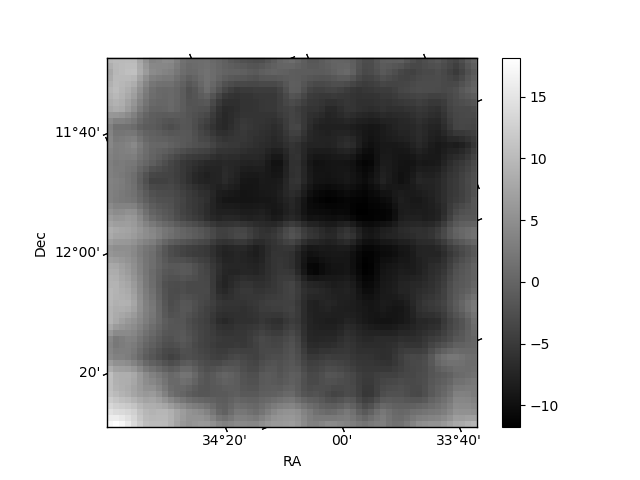
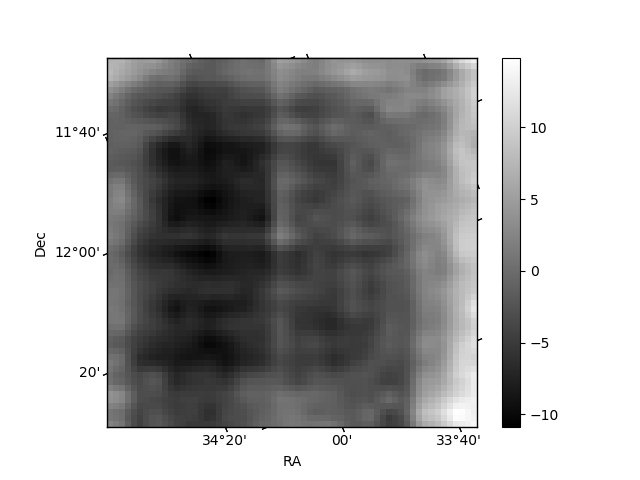
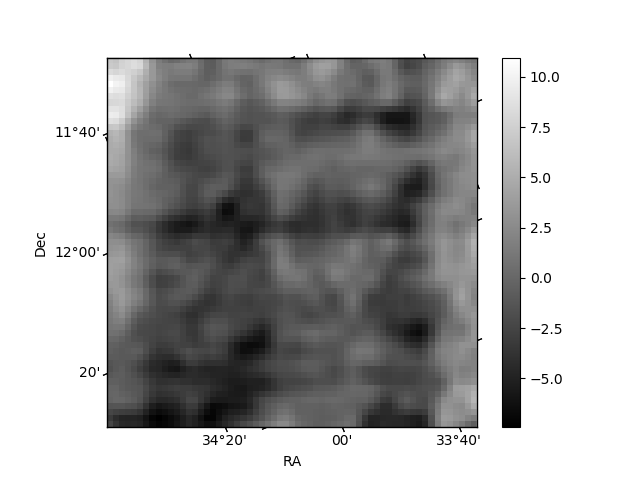
Histogram calculated using DETX and DETY for each event in the final _common_clean file
| Quadrant A | 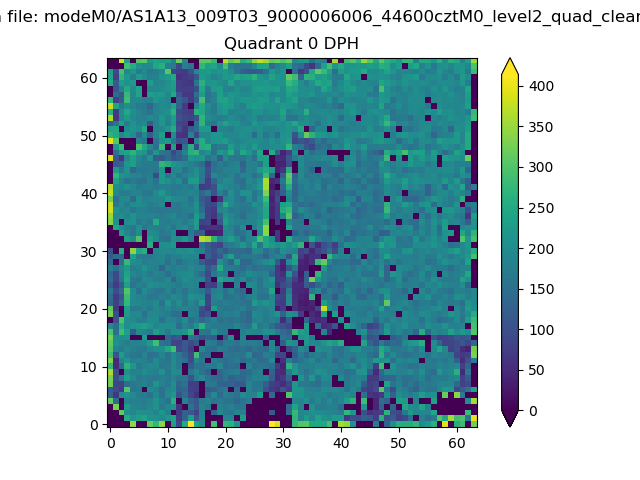 |
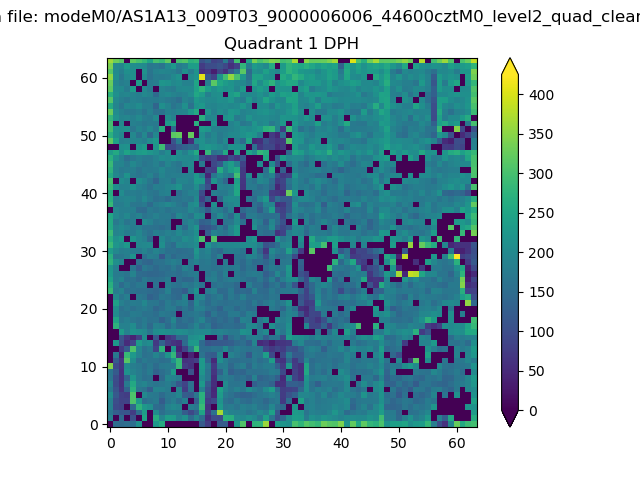 |
Quadrant B |
|---|---|---|---|
| Quadrant D |  |
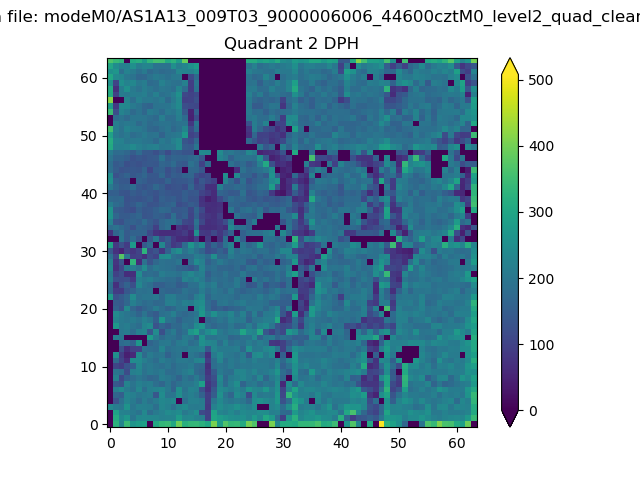 |
Quadrant C |
| Plot type | Count rate plots | Images |
|---|---|---|
| Comparison with Poisson distribution Blue bars denote a histogram of data divided into 1 sec bins. Red curve is a Poisson curve with rate = median count rate of data. |
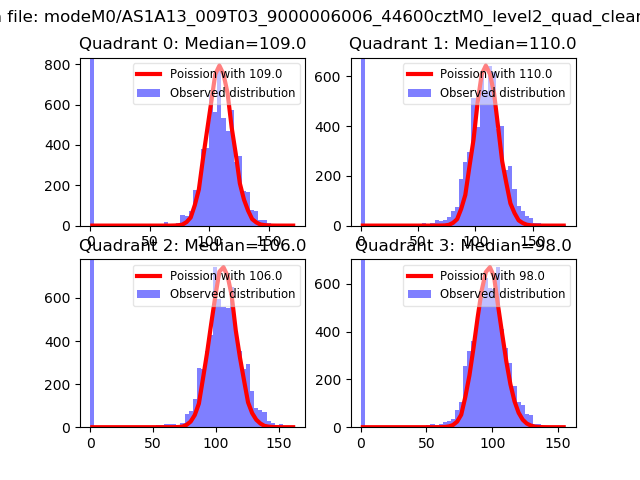 |
 |
| Quadrant-wise count rates Data is divided into 100 sec bins |
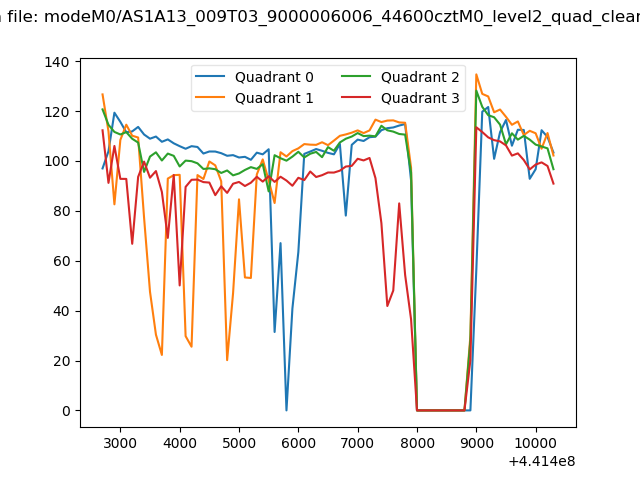 |
|
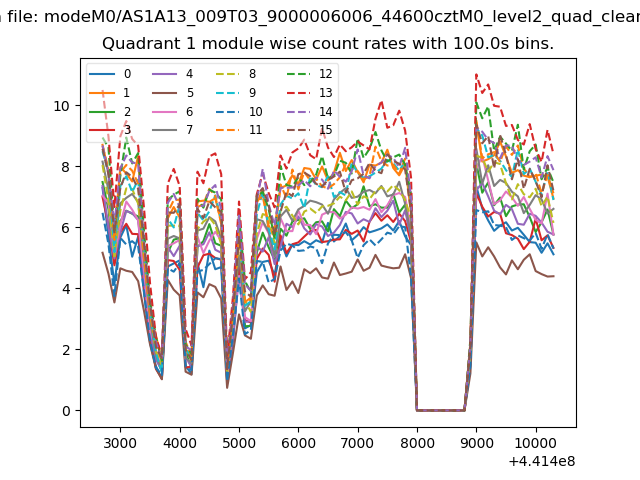
| Module-wise count rates for Quadrant A Data is divided into 100 sec bins |
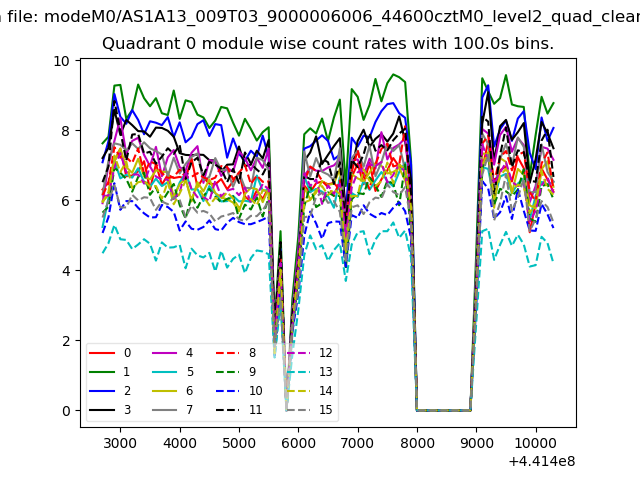 |
 |
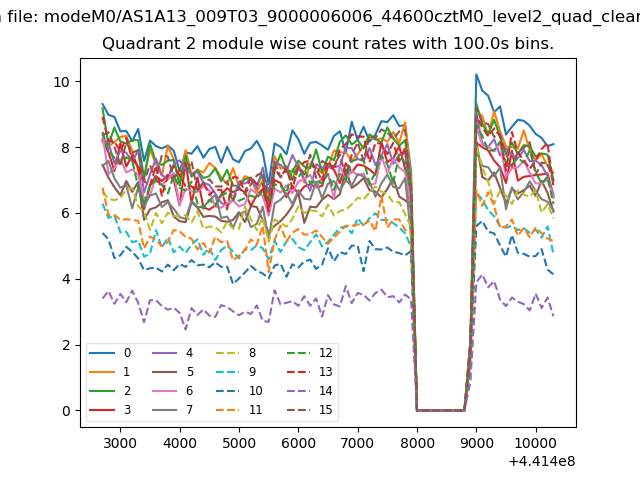
| Module-wise count rates for Quadrant B Data is divided into 100 sec bins |
 |
 |
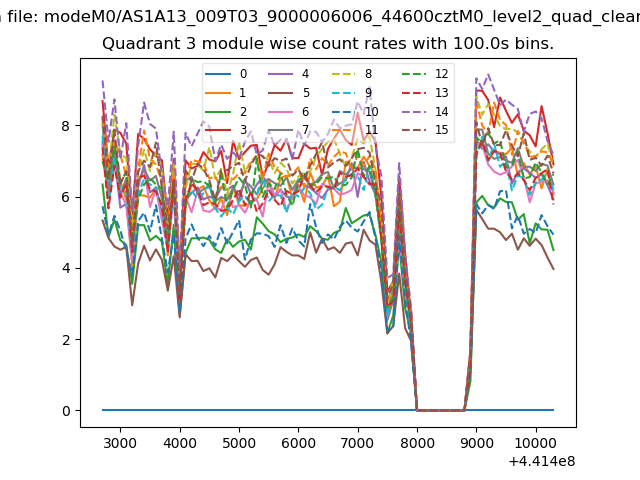
| Module-wise count rates for Quadrant C Data is divided into 100 sec bins |
 |
 |
| Module-wise count rates for Quadrant D Data is divided into 100 sec bins |
 |
 |
| Parameter | Plot |
|---|---|
| CZT HV Monitor | 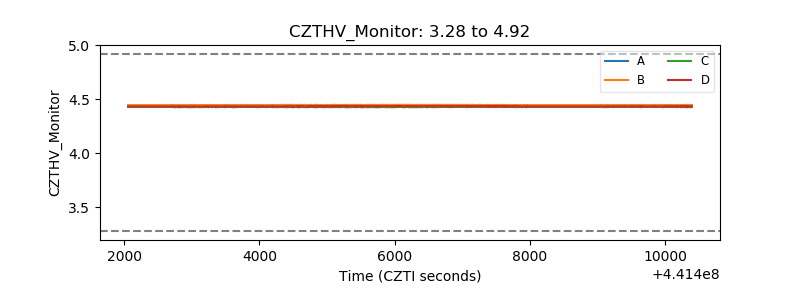 |
| D_VDD | 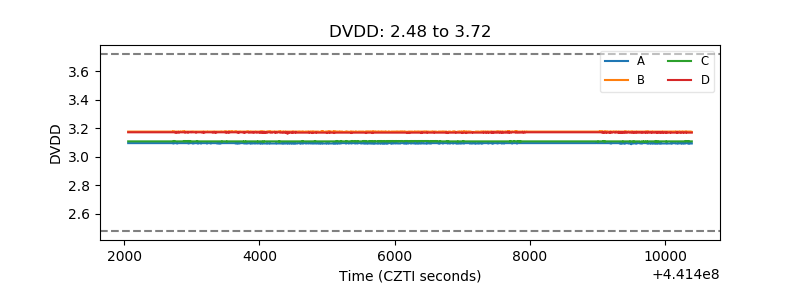 |
| Temperature 1 | 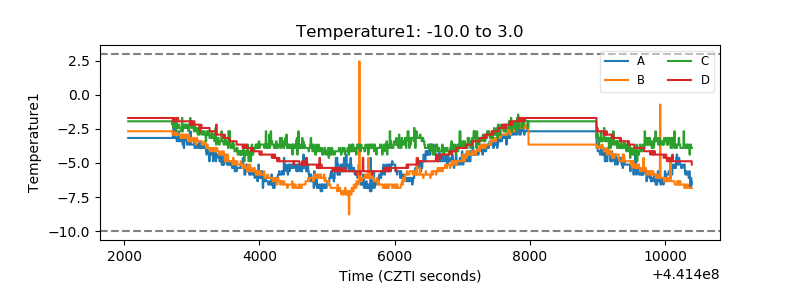 |
| Veto HV Monitor |  |
| Veto LLD | 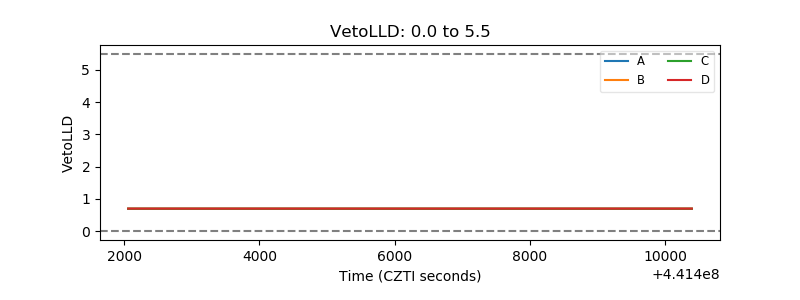 |
| Alpha Counter | 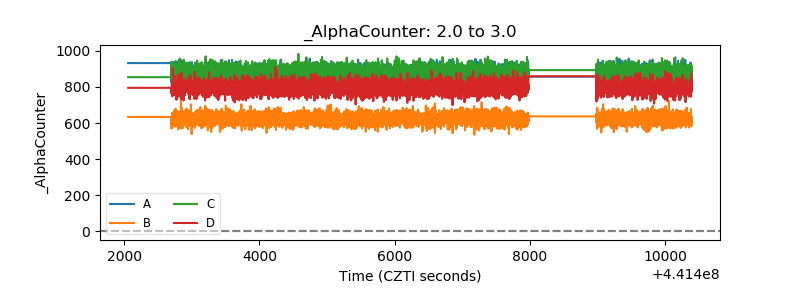 |
| _CPM_Rate | 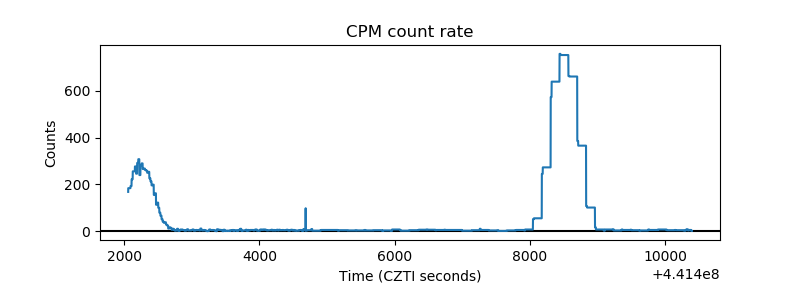 |
| CZT Counter | 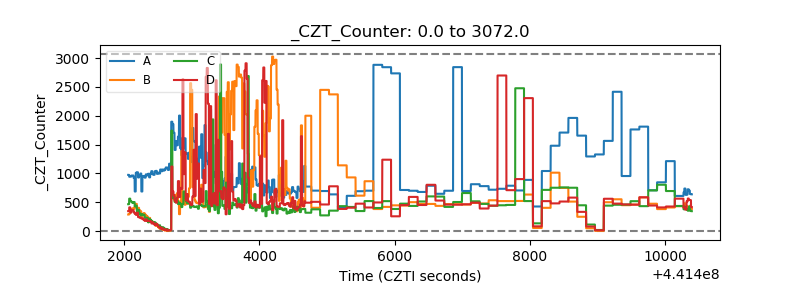 |
| +2.5 Volts monitor | 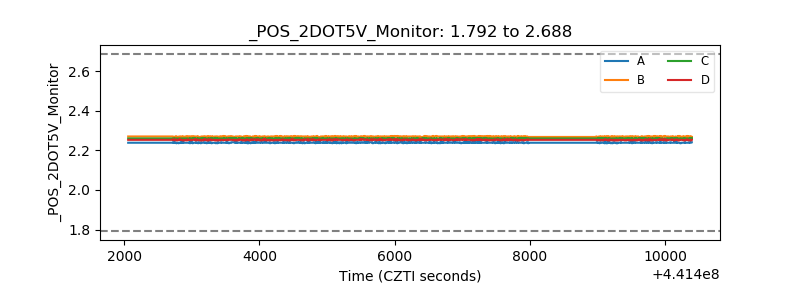 |
| +5 Volts monitor | 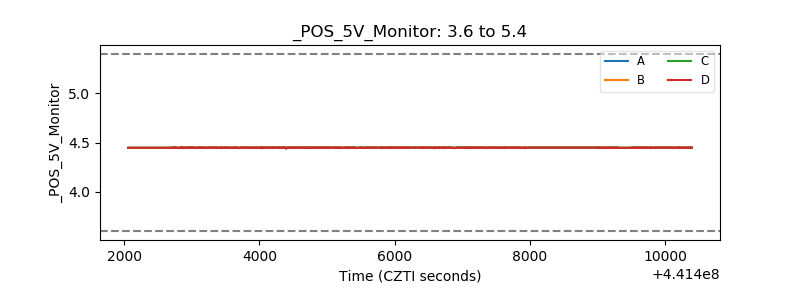 |
| _ROLL_ROT | 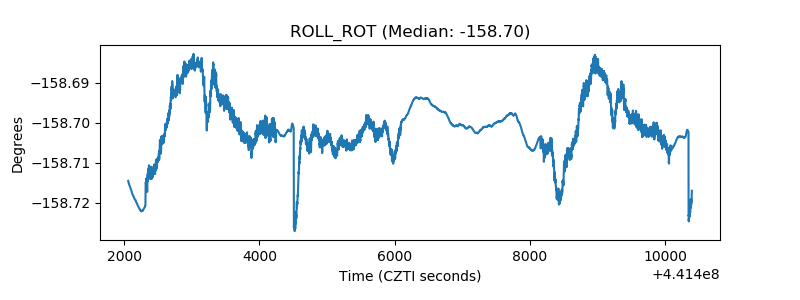 |
| _Roll_DEC | 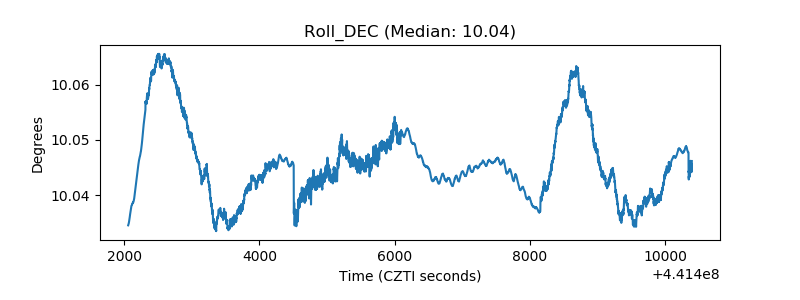 |
| _Roll_RA | 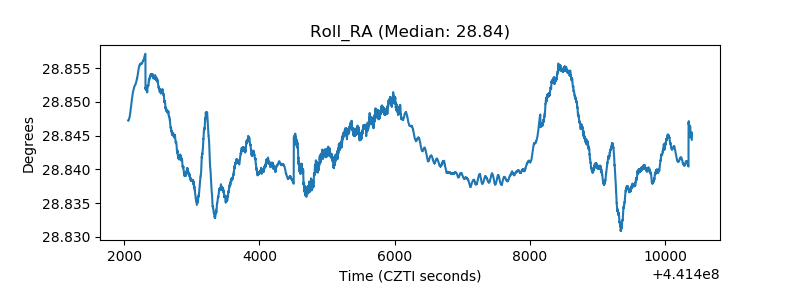 |
| Veto Counter | 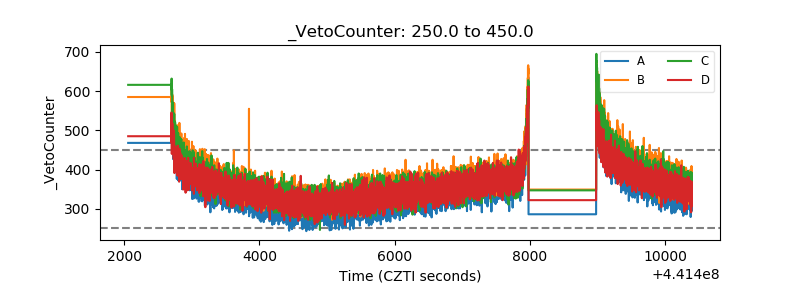 |