| Param | Original file | Final file |
|---|---|---|
| Filename | modeM0/AS1A13_009T03_9000006006_44602cztM0_level2.fits | modeM0/AS1A13_009T03_9000006006_44602cztM0_level2_quad_clean.evt |
| Size (bytes) | 459,466,560 | 112,777,920 |
| Size | 438.2 MB | 107.6 MB |
| Events in quadrant A | 5,647,585 | 746,592 |
| Events in quadrant B | 3,206,696 | 784,758 |
| Events in quadrant C | 3,576,373 | 735,379 |
| Events in quadrant D | 4,052,468 | 677,478 |
| Mode SS | |||
|---|---|---|---|
| Quadrant | BADHDUFLAG | Total packets | Discarded packets |
| A | 0 | 136 | 0 |
| B | 0 | 136 | 0 |
| C | 0 | 136 | 0 |
| D | 0 | 136 | 0 |
| Mode M9 | |||
|---|---|---|---|
| Quadrant | BADHDUFLAG | Total packets | Discarded packets |
| A | 0 | 15 | 0 |
| B | 0 | 16 | 0 |
| C | 0 | 16 | 0 |
| D | 0 | 16 | 0 |
| Mode M0 | |||
|---|---|---|---|
| Quadrant | BADHDUFLAG | Total packets | Discarded packets |
| A | 0 | 22498 | 2 |
| B | 0 | 14111 | 2 |
| C | 0 | 15318 | 2 |
| D | 0 | 16763 | 2 |
| Quadrant | Total seconds | Saturated seconds | Saturation percentage |
|---|---|---|---|
| A | 6757 | 264 | 3.907059% |
| B | 6757 | 46 | 0.680775% |
| C | 6757 | 118 | 1.746337% |
| D | 6757 | 143 | 2.116324% |
Noise dominated data is calculated using 1-second bins in cleaned event files. If a bin has >2000 counts, and if more than 50% of those come from <1% of pixels, then it is considered to be noise-dominated and hence unusable.
| Quadrant | # 1 sec bins | Bins with >0 counts | Bins with >2000 counts | High rate bins dominated by noise | Noise dominated (total time) | Noise dominated (detector-on time) | Marked lightcurve |
|---|---|---|---|---|---|---|---|
| A | 7922 | 6758 | 194 | 194 | 2.45% | 2.87% |  |
| B | 7922 | 6757 | 30 | 30 | 0.38% | 0.44% |  |
| C | 7922 | 6758 | 105 | 105 | 1.33% | 1.55% | 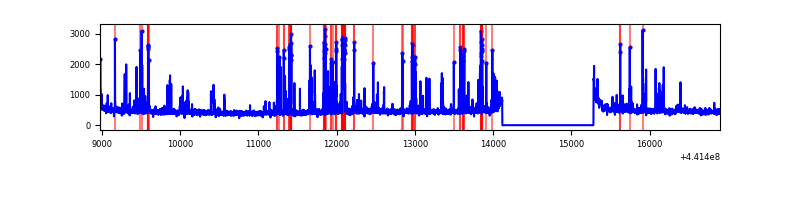 |
| D | 7922 | 6757 | 144 | 144 | 1.82% | 2.13% |  |
Top three noisy pixels from each quadrant. If the there are fewer than three noisy pixels in the level2.evt file, extra rows are filled as -1
| Pixel properties | Quadrant properties | ||||||
|---|---|---|---|---|---|---|---|
| Quadrant | DetID | PixID | Counts | Sigma | Mean | Median | Sigma |
| A | 10 | 83 | 1870059 | 12110.92 | 752 | 737 | 154.4 |
| A | 15 | 223 | 486551 | 3147.48 | 752 | 737 | 154.4 |
| A | 9 | 191 | 258753 | 1671.63 | 752 | 737 | 154.4 |
| B | 5 | 172 | 67284 | 440.73 | 767 | 743 | 151.0 |
| B | 4 | 216 | 47366 | 308.8 | 767 | 743 | 151.0 |
| B | 14 | 167 | 35933 | 233.08 | 767 | 743 | 151.0 |
| C | 12 | 2 | 488920 | 2778.19 | 746 | 750 | 175.7 |
| C | 14 | 254 | 69475 | 391.12 | 746 | 750 | 175.7 |
| C | 1 | 90 | 64974 | 365.5 | 746 | 750 | 175.7 |
| D | 1 | 52 | 589623 | 3161.62 | 743 | 722 | 186.3 |
| D | 13 | 249 | 452336 | 2424.57 | 743 | 722 | 186.3 |
| D | 2 | 249 | 67838 | 360.32 | 743 | 722 | 186.3 |
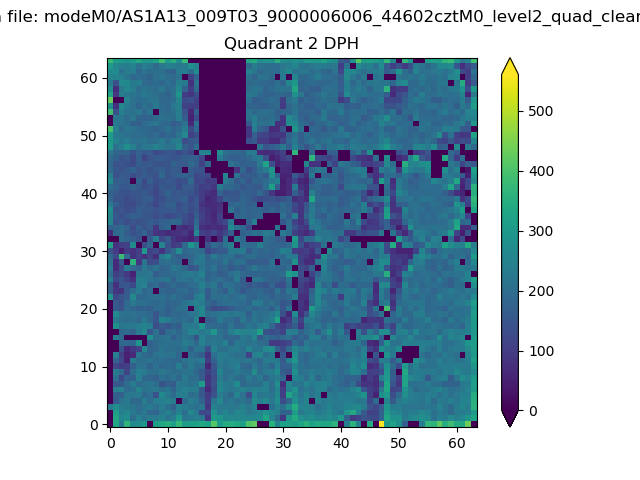
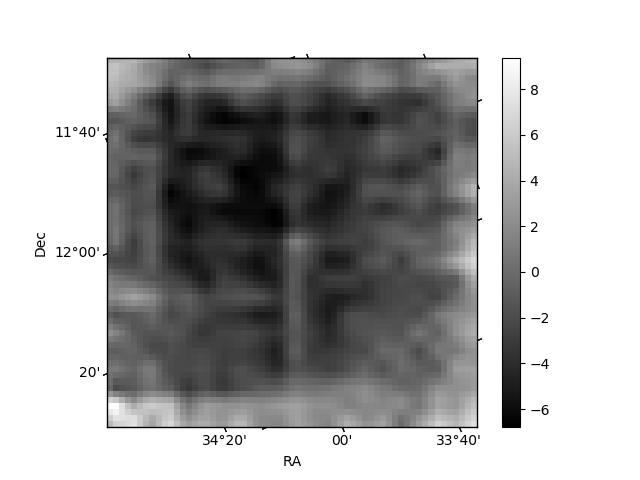
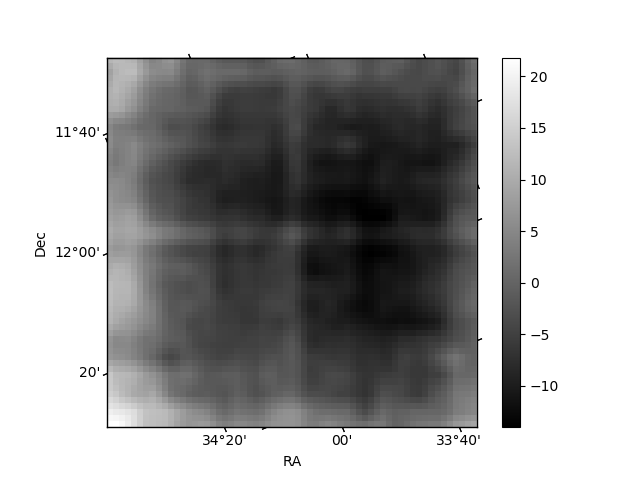
Histogram calculated using DETX and DETY for each event in the final _common_clean file
| Quadrant A | 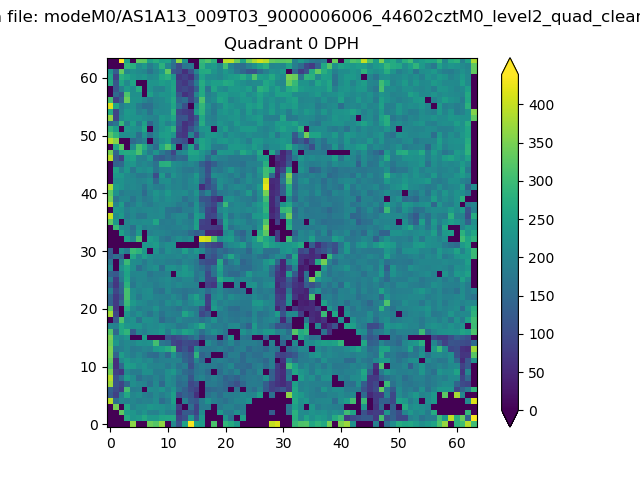 |
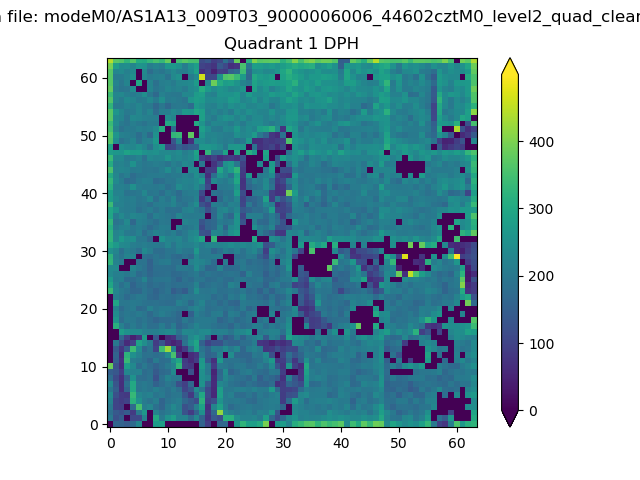 |
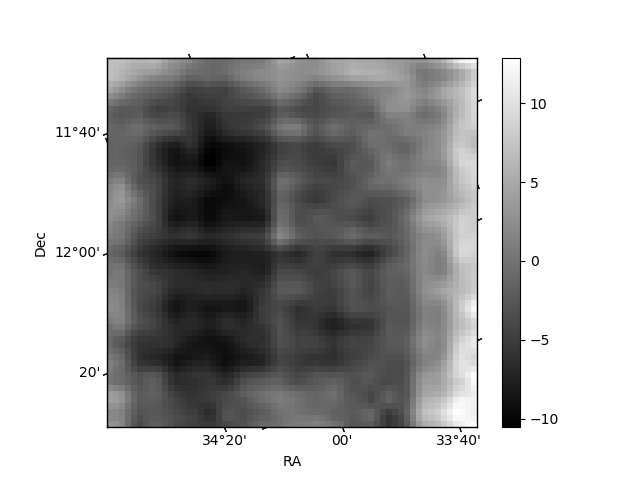
Quadrant B |
|---|---|---|---|
| Quadrant D | 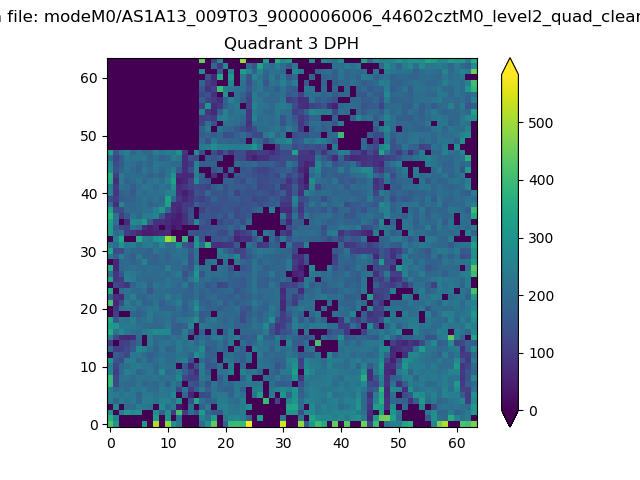 |
 |
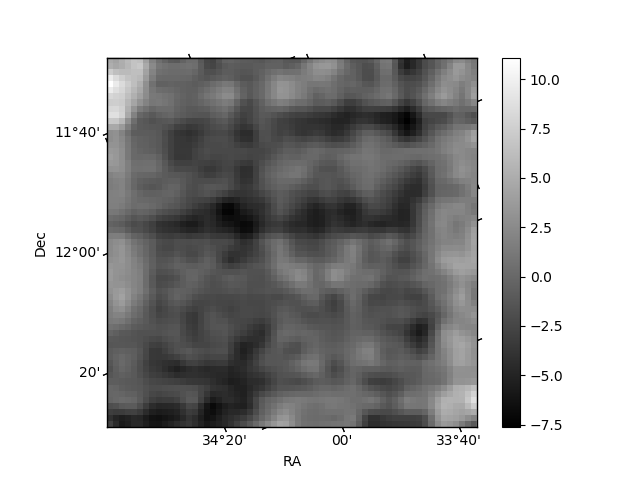
Quadrant C |
| Plot type | Count rate plots | Images |
|---|---|---|
| Comparison with Poisson distribution Blue bars denote a histogram of data divided into 1 sec bins. Red curve is a Poisson curve with rate = median count rate of data. |
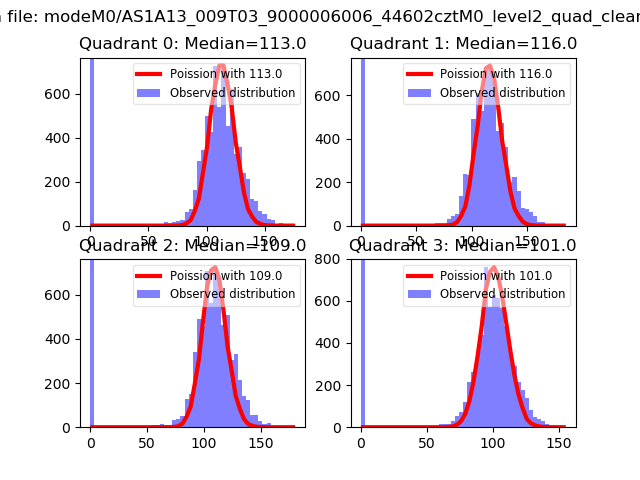 |
 |
| Quadrant-wise count rates Data is divided into 100 sec bins |
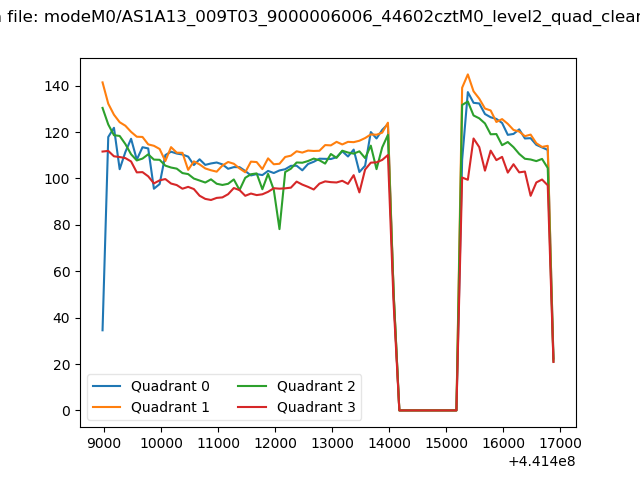 |
|
| Module-wise count rates for Quadrant A Data is divided into 100 sec bins |
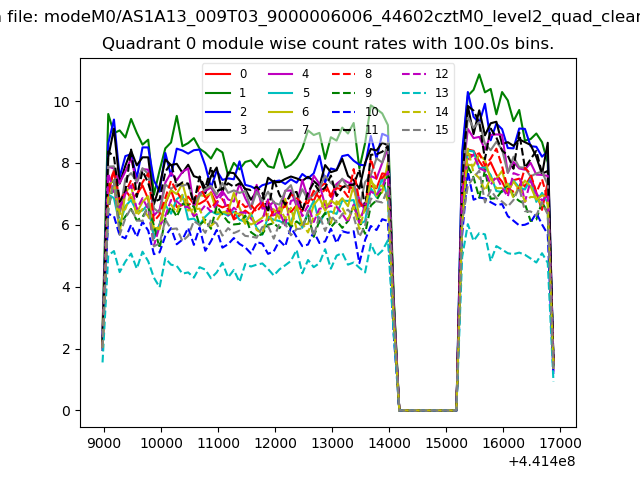 |
 |
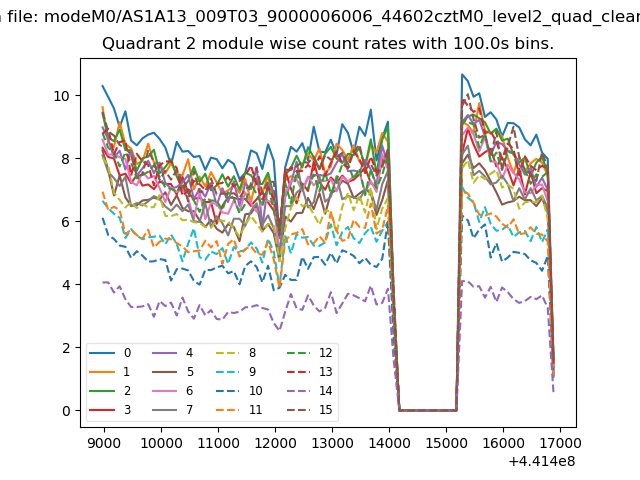
| Module-wise count rates for Quadrant B Data is divided into 100 sec bins |
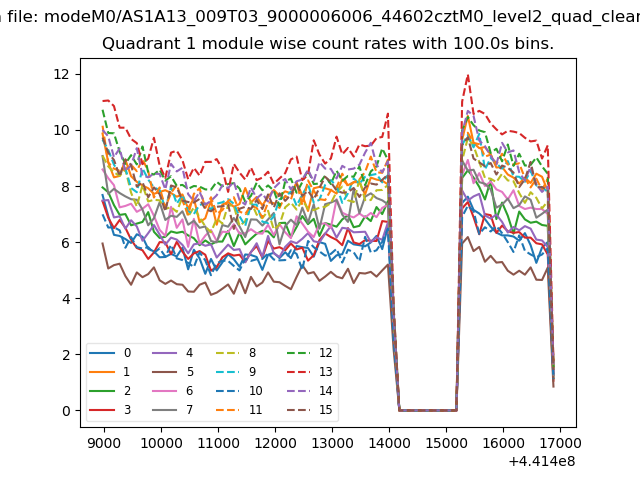 |
 |
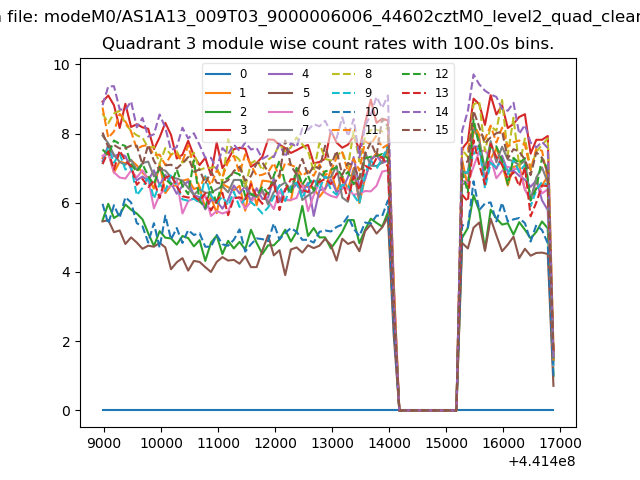
| Module-wise count rates for Quadrant C Data is divided into 100 sec bins |
 |
 |
| Module-wise count rates for Quadrant D Data is divided into 100 sec bins |
 |
 |
| Parameter | Plot |
|---|---|
| CZT HV Monitor | 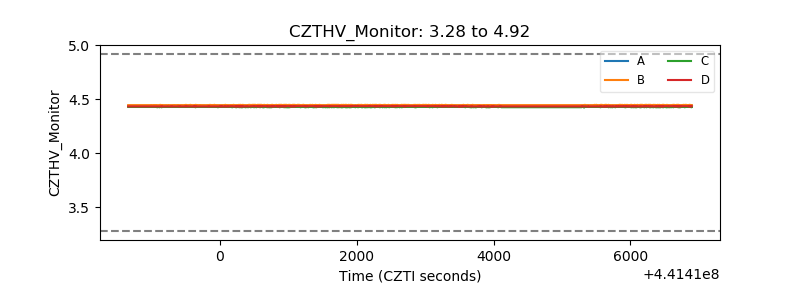 |
| D_VDD | 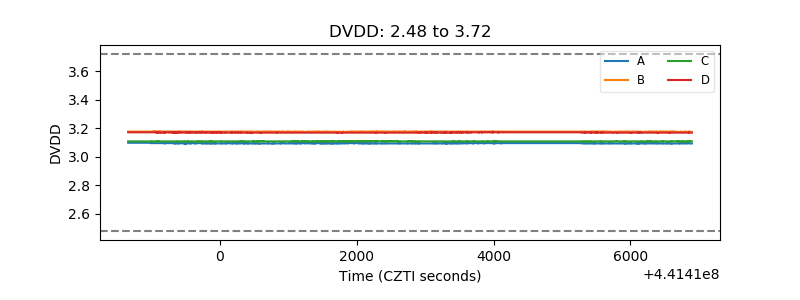 |
| Temperature 1 | 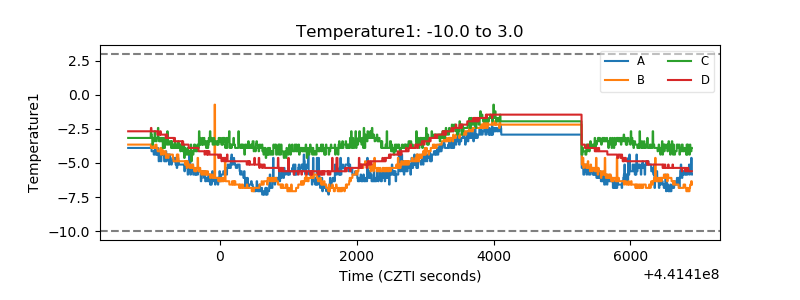 |
| Veto HV Monitor | 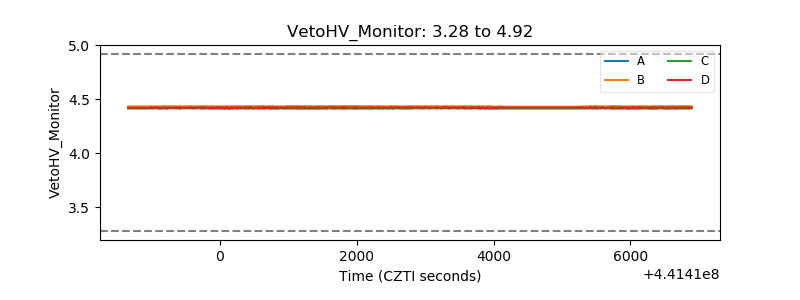 |
| Veto LLD | 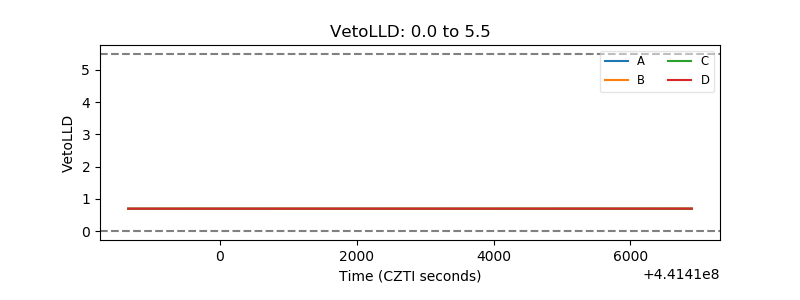 |
| Alpha Counter | 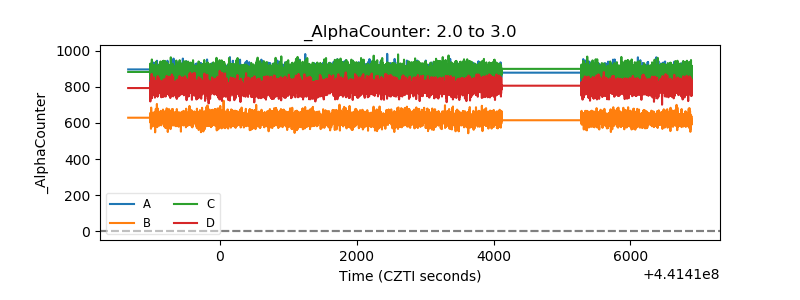 |
| _CPM_Rate | 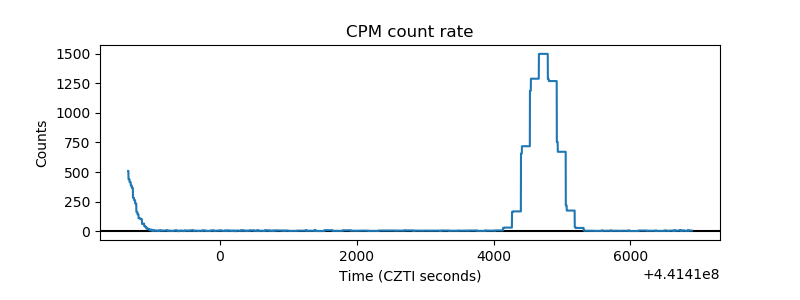 |
| CZT Counter | 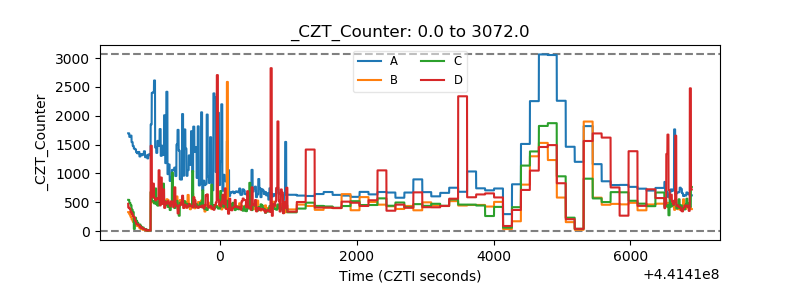 |
| +2.5 Volts monitor | 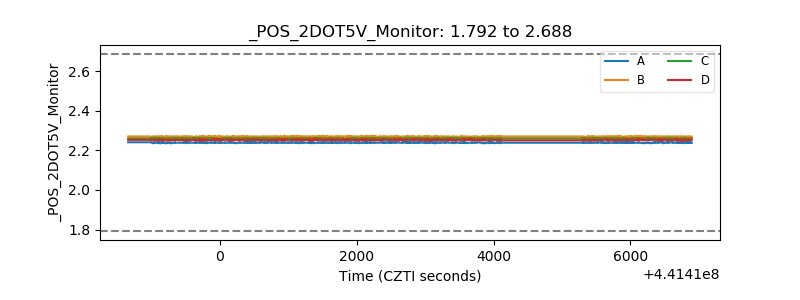 |
| +5 Volts monitor | 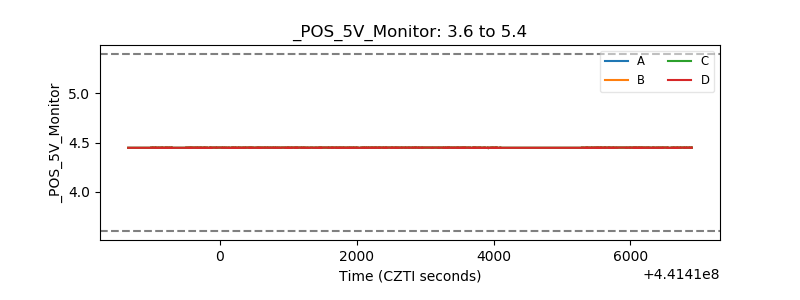 |
| _ROLL_ROT | 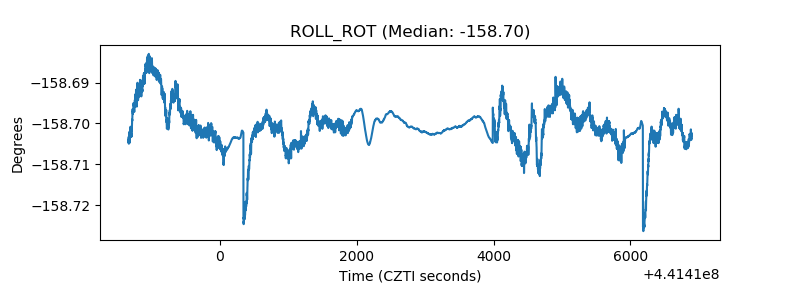 |
| _Roll_DEC | 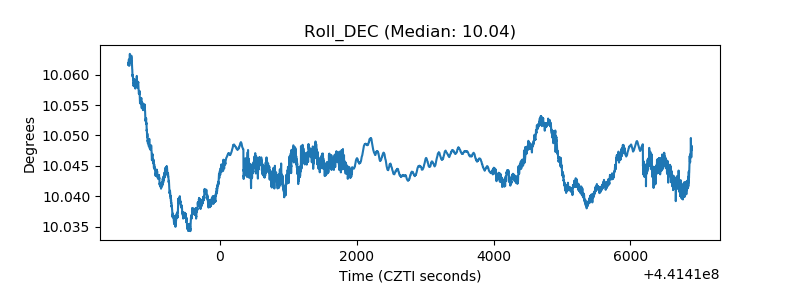 |
| _Roll_RA | 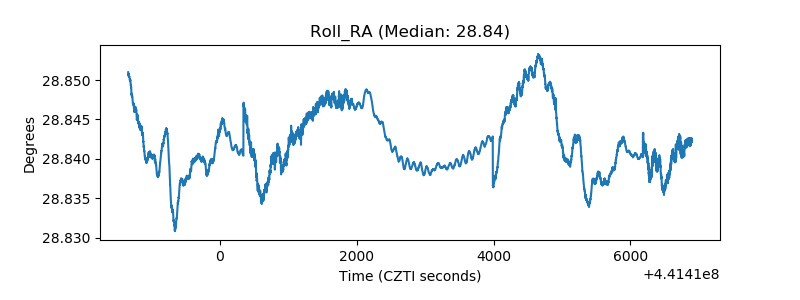 |
| Veto Counter | 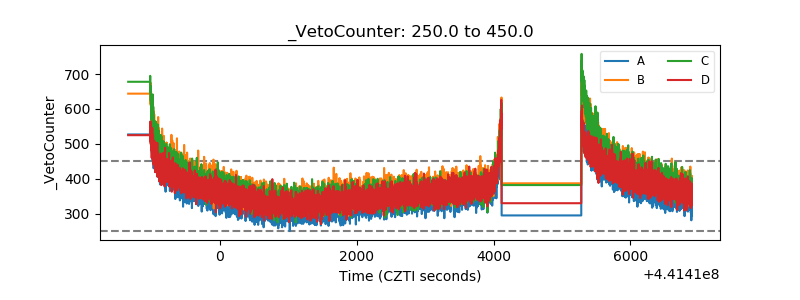 |