| Param | Original file | Final file |
|---|---|---|
| Filename | modeM0/AS1A13_009T03_9000006006_44603cztM0_level2.fits | modeM0/AS1A13_009T03_9000006006_44603cztM0_level2_quad_clean.evt |
| Size (bytes) | 554,973,120 | 108,371,520 |
| Size | 529.3 MB | 103.4 MB |
| Events in quadrant A | 5,023,354 | 772,876 |
| Events in quadrant B | 6,506,509 | 647,080 |
| Events in quadrant C | 3,500,973 | 751,206 |
| Events in quadrant D | 5,004,801 | 653,840 |
| Mode SS | |||
|---|---|---|---|
| Quadrant | BADHDUFLAG | Total packets | Discarded packets |
| A | 0 | 132 | 0 |
| B | 0 | 132 | 0 |
| C | 0 | 132 | 0 |
| D | 0 | 132 | 0 |
| Mode M9 | |||
|---|---|---|---|
| Quadrant | BADHDUFLAG | Total packets | Discarded packets |
| A | 0 | 20 | 0 |
| B | 0 | 21 | 0 |
| C | 0 | 21 | 0 |
| D | 0 | 21 | 0 |
| Mode M0 | |||
|---|---|---|---|
| Quadrant | BADHDUFLAG | Total packets | Discarded packets |
| A | 0 | 20494 | 2 |
| B | 0 | 23643 | 2 |
| C | 0 | 14578 | 2 |
| D | 0 | 19373 | 2 |
| Quadrant | Total seconds | Saturated seconds | Saturation percentage |
|---|---|---|---|
| A | 6543 | 78 | 1.192114% |
| B | 6543 | 1412 | 21.580315% |
| C | 6543 | 46 | 0.703041% |
| D | 6543 | 483 | 7.381935% |
Noise dominated data is calculated using 1-second bins in cleaned event files. If a bin has >2000 counts, and if more than 50% of those come from <1% of pixels, then it is considered to be noise-dominated and hence unusable.
| Quadrant | # 1 sec bins | Bins with >0 counts | Bins with >2000 counts | High rate bins dominated by noise | Noise dominated (total time) | Noise dominated (detector-on time) | Marked lightcurve |
|---|---|---|---|---|---|---|---|
| A | 7803 | 6544 | 24 | 24 | 0.31% | 0.37% | 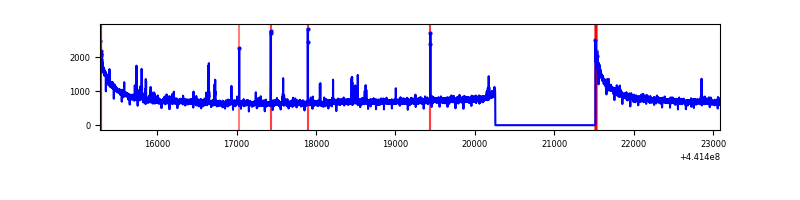 |
| B | 7803 | 6543 | 1278 | 1278 | 16.38% | 19.53% | 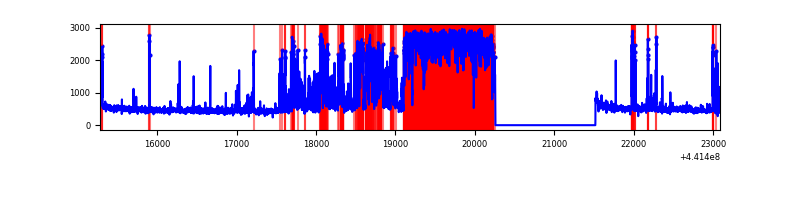 |
| C | 7803 | 6544 | 36 | 36 | 0.46% | 0.55% | 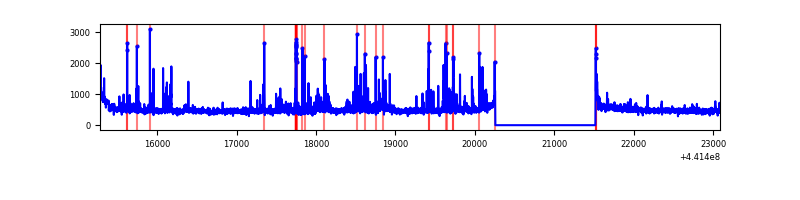 |
| D | 7803 | 6543 | 405 | 405 | 5.19% | 6.19% | 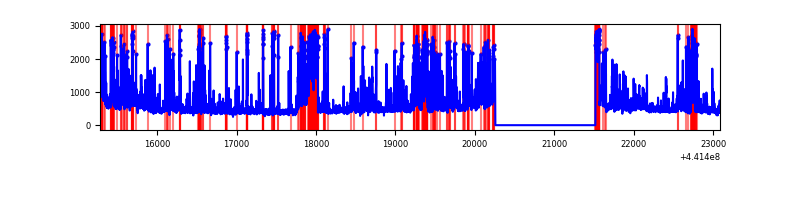 |
Top three noisy pixels from each quadrant. If the there are fewer than three noisy pixels in the level2.evt file, extra rows are filled as -1
| Pixel properties | Quadrant properties | ||||||
|---|---|---|---|---|---|---|---|
| Quadrant | DetID | PixID | Counts | Sigma | Mean | Median | Sigma |
| A | 10 | 83 | 1940205 | 12234.11 | 763 | 748 | 158.5 |
| A | 13 | 248 | 84587 | 528.86 | 763 | 748 | 158.5 |
| A | 15 | 223 | 46088 | 286.01 | 763 | 748 | 158.5 |
| B | 14 | 167 | 3469603 | 25977.96 | 684 | 665 | 133.5 |
| B | 5 | 172 | 289240 | 2161.06 | 684 | 665 | 133.5 |
| B | 0 | 155 | 26883 | 196.34 | 684 | 665 | 133.5 |
| C | 12 | 2 | 214709 | 1221.18 | 749 | 754 | 175.2 |
| C | 1 | 90 | 136571 | 775.19 | 749 | 754 | 175.2 |
| C | 3 | 233 | 88423 | 500.38 | 749 | 754 | 175.2 |
| D | 1 | 52 | 1290861 | 7013.86 | 724 | 701 | 183.9 |
| D | 13 | 249 | 636976 | 3459.06 | 724 | 701 | 183.9 |
| D | 2 | 249 | 83043 | 447.65 | 724 | 701 | 183.9 |
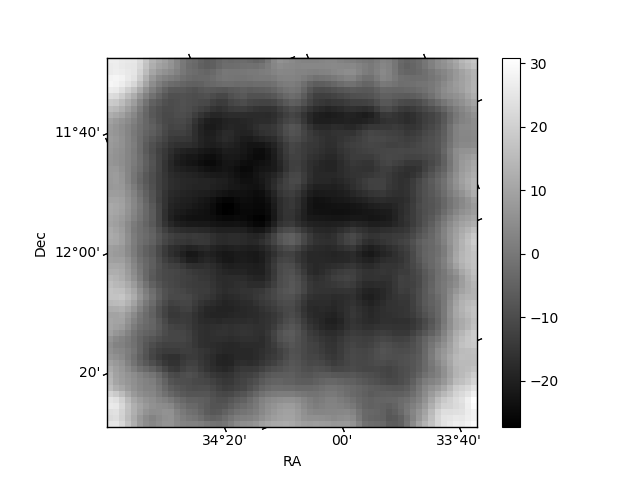
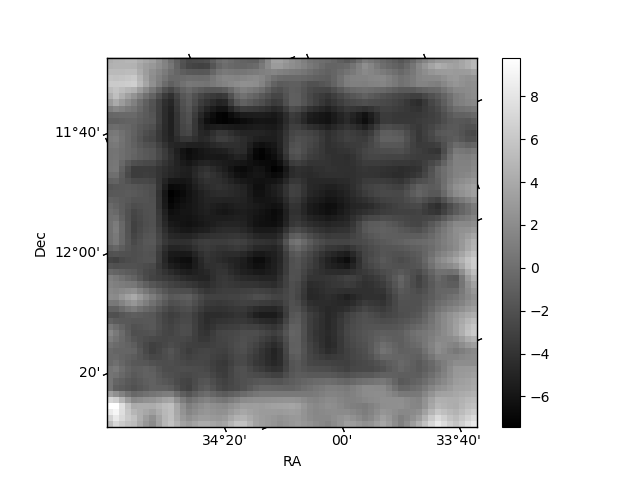
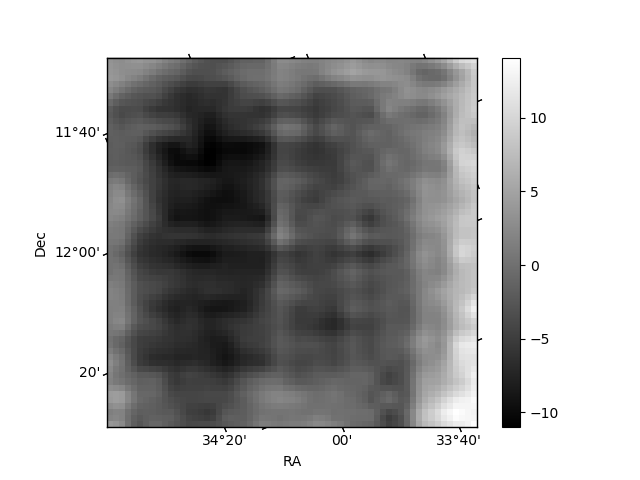
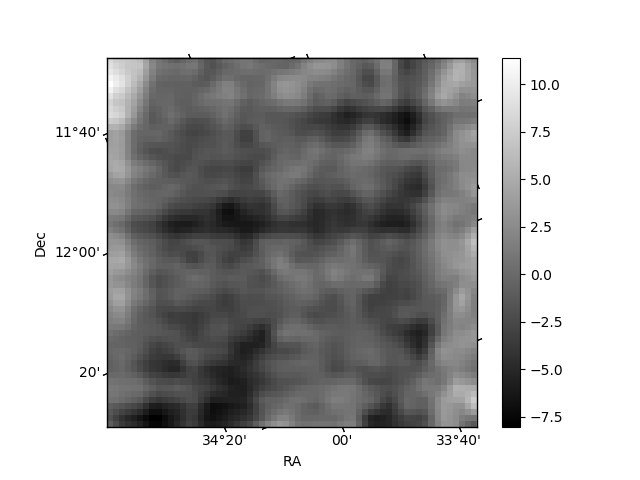
Histogram calculated using DETX and DETY for each event in the final _common_clean file
| Quadrant A | 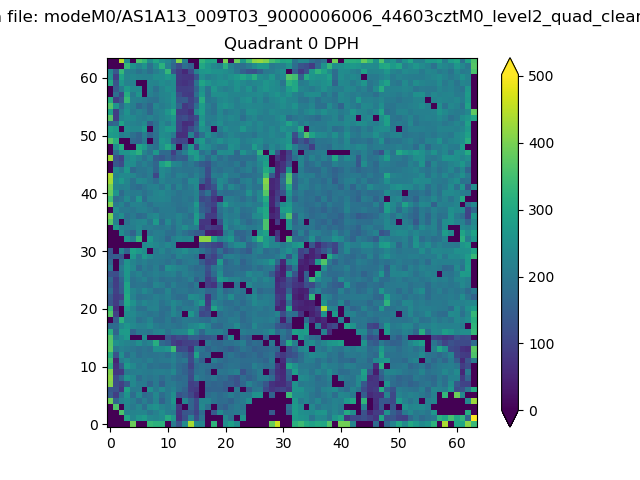 |
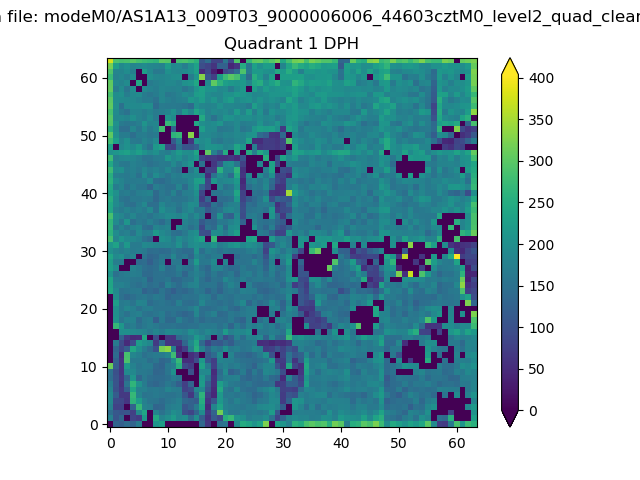 |
Quadrant B |
|---|---|---|---|
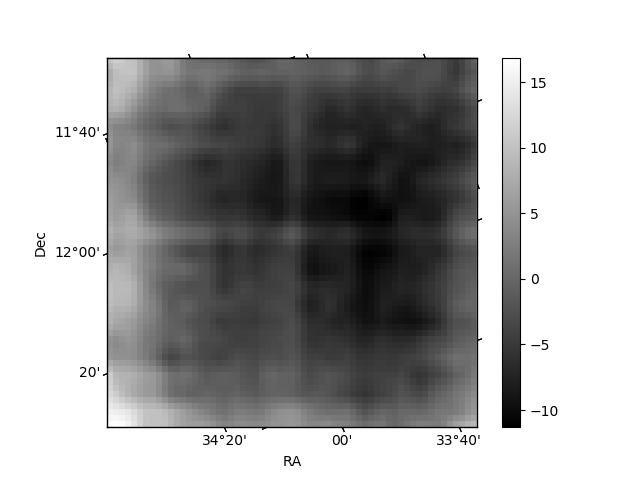
| Quadrant D | 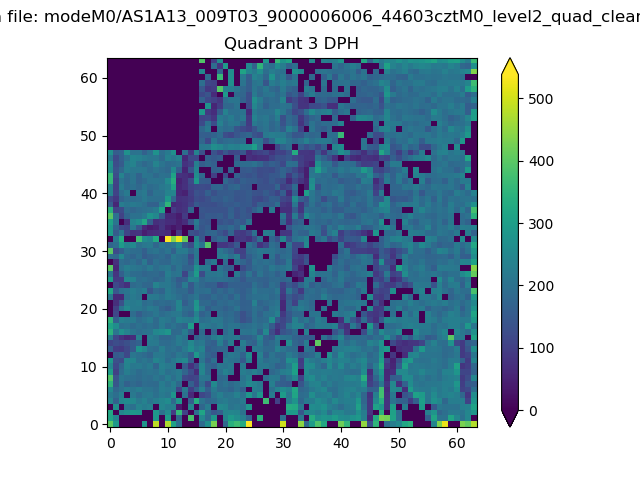 |
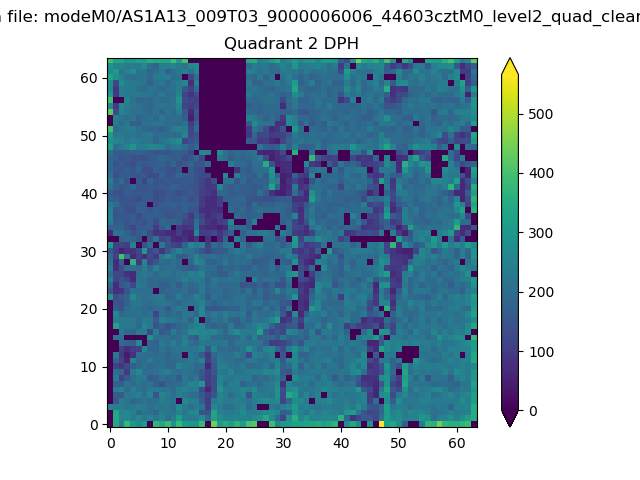 |
Quadrant C |
| Plot type | Count rate plots | Images |
|---|---|---|
| Comparison with Poisson distribution Blue bars denote a histogram of data divided into 1 sec bins. Red curve is a Poisson curve with rate = median count rate of data. |
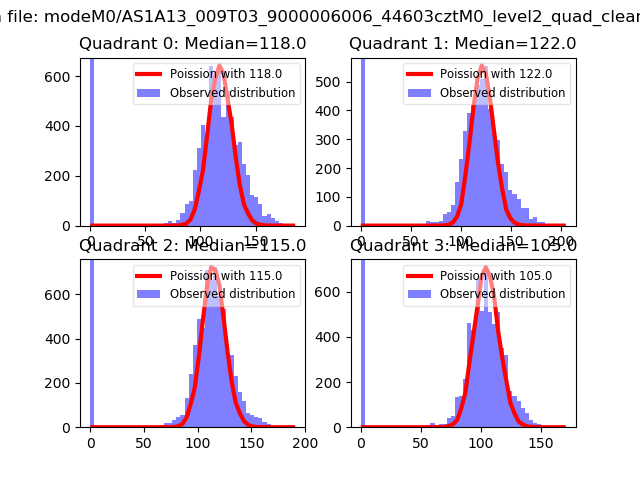 |
 |
| Quadrant-wise count rates Data is divided into 100 sec bins |
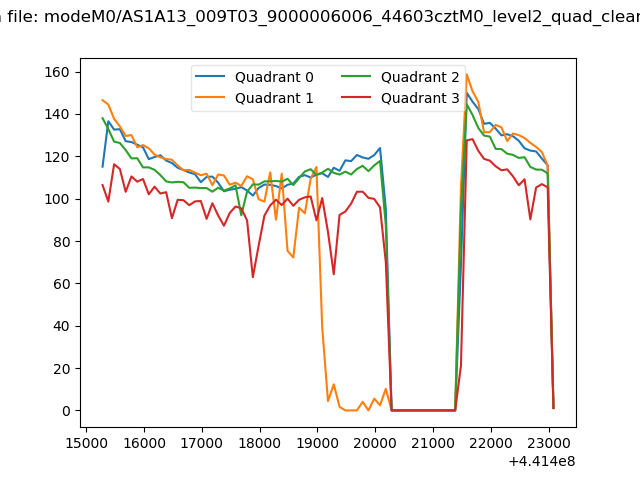 |
|
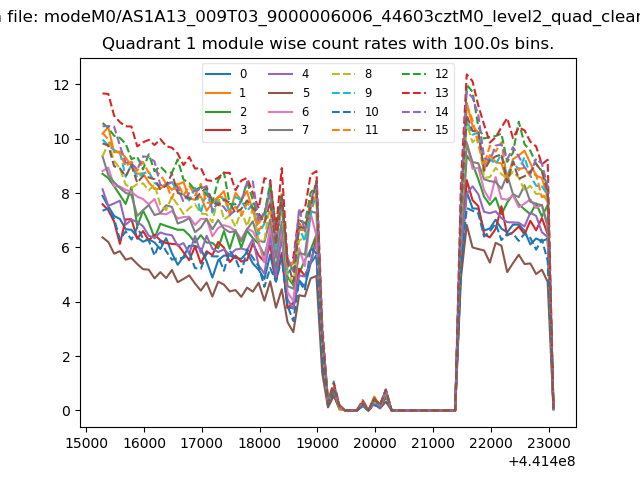
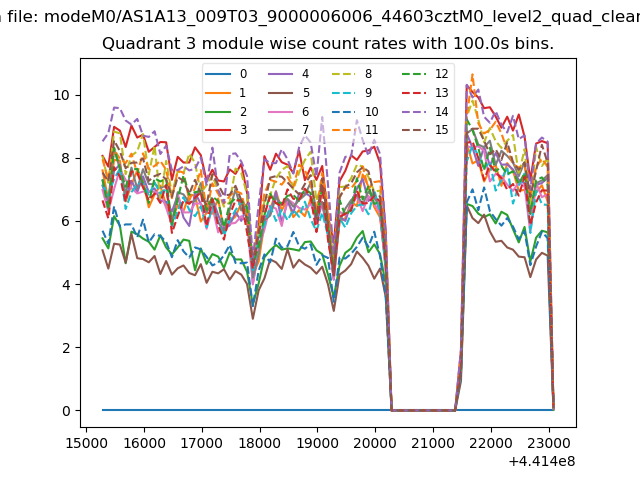
| Module-wise count rates for Quadrant A Data is divided into 100 sec bins |
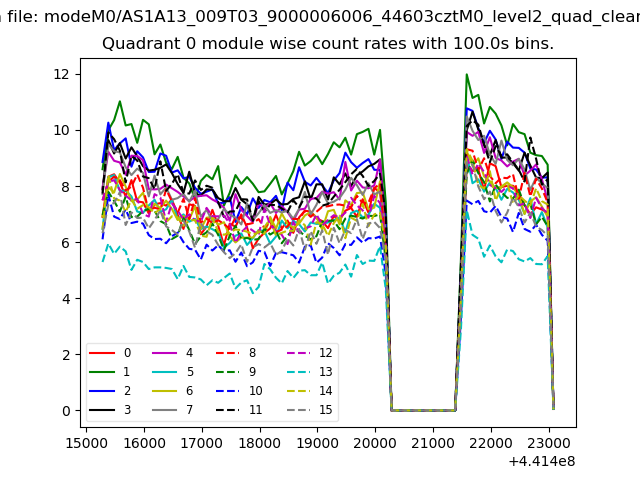 |
 |
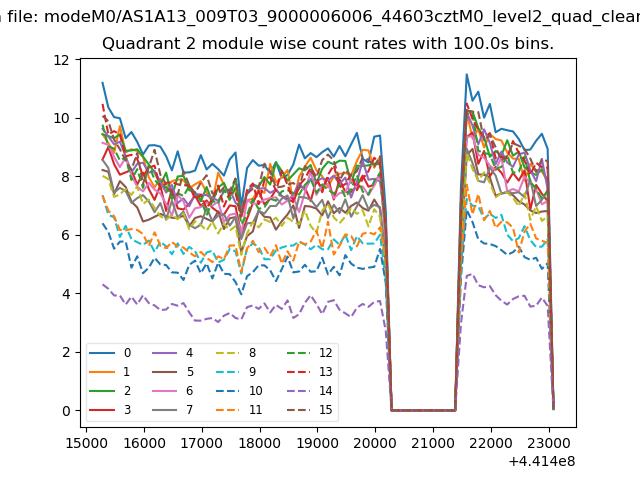
| Module-wise count rates for Quadrant B Data is divided into 100 sec bins |
 |
 |
| Module-wise count rates for Quadrant C Data is divided into 100 sec bins |
 |
 |
| Module-wise count rates for Quadrant D Data is divided into 100 sec bins |
 |
 |
| Parameter | Plot |
|---|---|
| CZT HV Monitor | 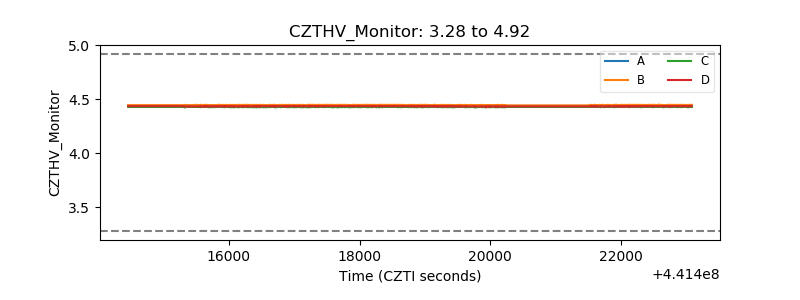 |
| D_VDD | 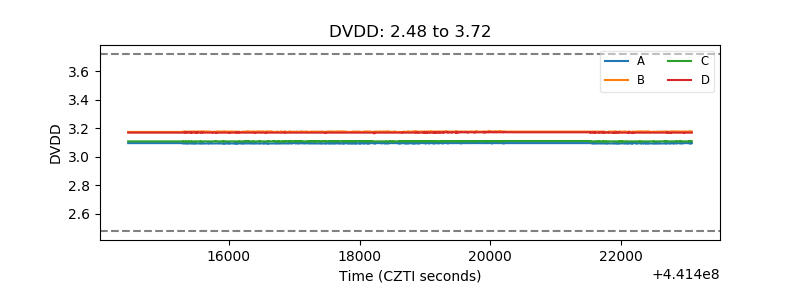 |
| Temperature 1 | 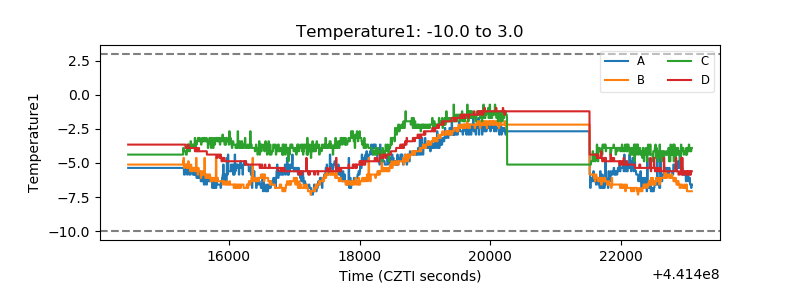 |
| Veto HV Monitor | 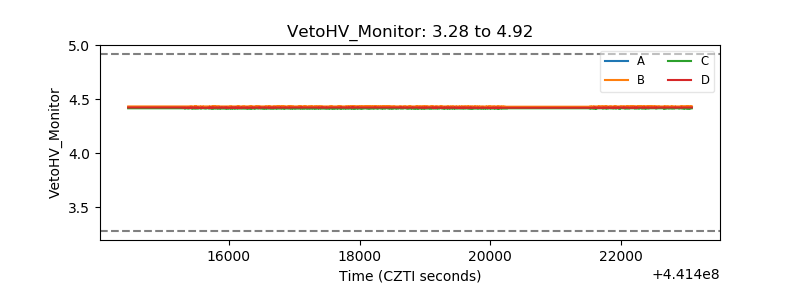 |
| Veto LLD | 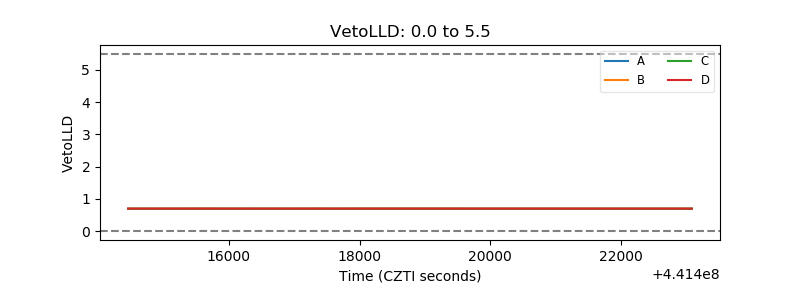 |
| Alpha Counter | 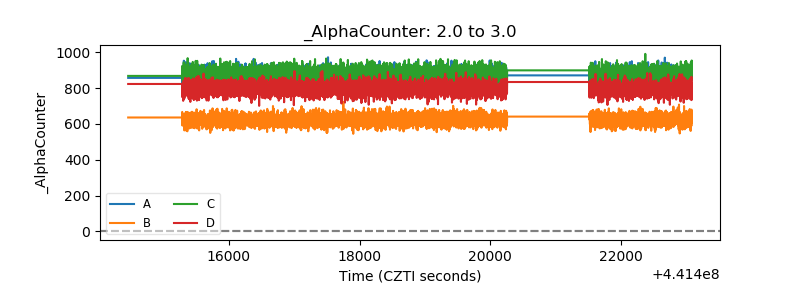 |
| _CPM_Rate | 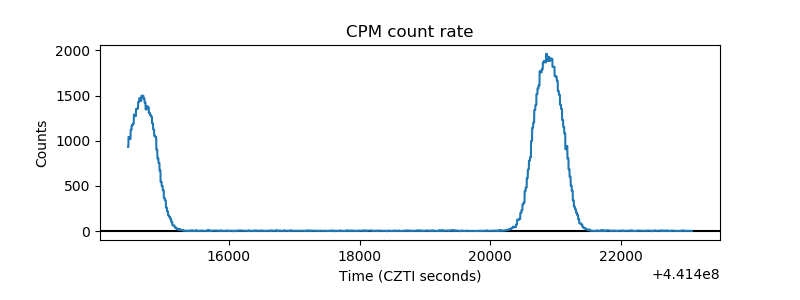 |
| CZT Counter | 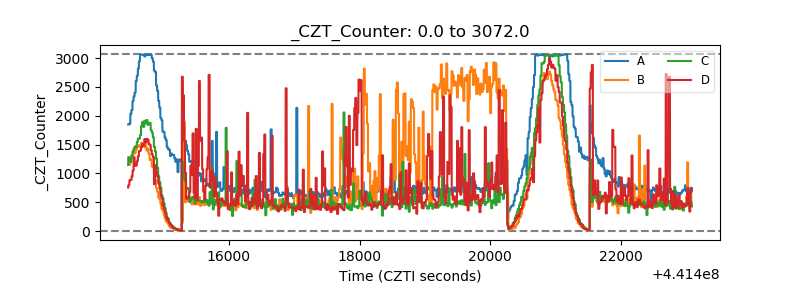 |
| +2.5 Volts monitor | 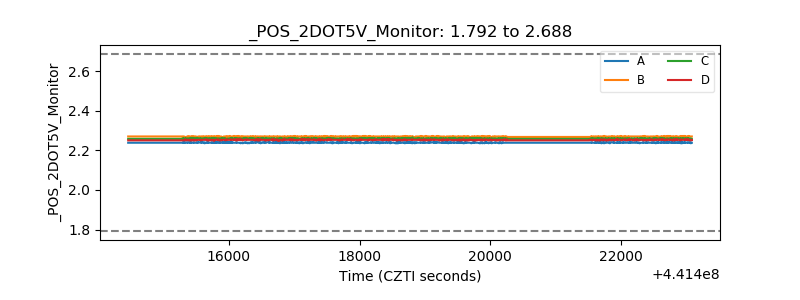 |
| +5 Volts monitor |  |
| _ROLL_ROT | 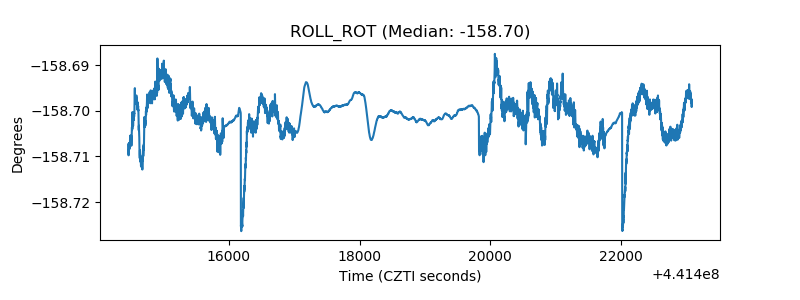 |
| _Roll_DEC | 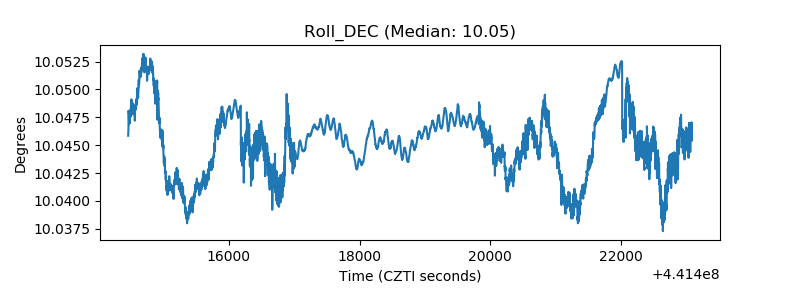 |
| _Roll_RA | 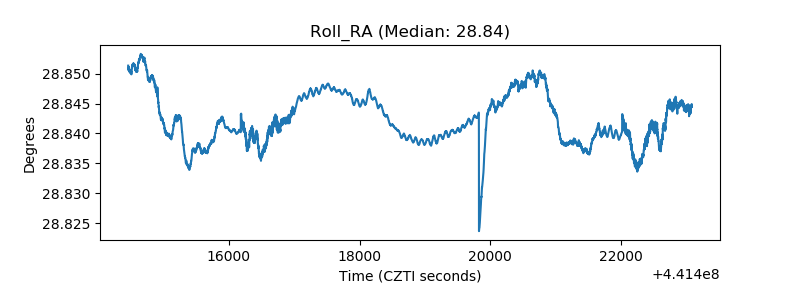 |
| Veto Counter | 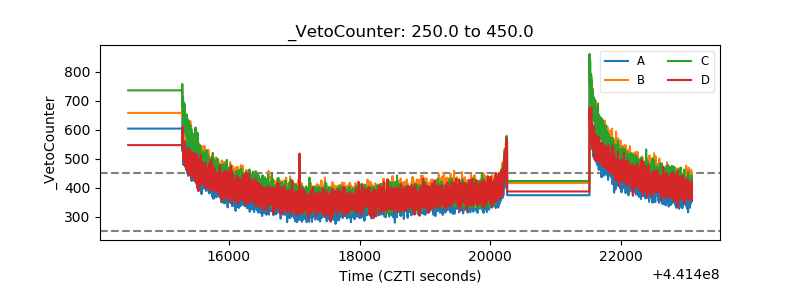 |