| Param | Original file | Final file |
|---|---|---|
| Filename | modeM0/AS1A13_009T03_9000006006_44604cztM0_level2.fits | modeM0/AS1A13_009T03_9000006006_44604cztM0_level2_quad_clean.evt |
| Size (bytes) | 511,914,240 | 114,272,640 |
| Size | 488.2 MB | 109.0 MB |
| Events in quadrant A | 5,124,597 | 792,034 |
| Events in quadrant B | 5,076,820 | 751,623 |
| Events in quadrant C | 4,103,296 | 766,877 |
| Events in quadrant D | 4,138,166 | 694,362 |
| Mode SS | |||
|---|---|---|---|
| Quadrant | BADHDUFLAG | Total packets | Discarded packets |
| A | 0 | 134 | 0 |
| B | 0 | 134 | 0 |
| C | 0 | 134 | 0 |
| D | 0 | 134 | 0 |
| Mode M9 | |||
|---|---|---|---|
| Quadrant | BADHDUFLAG | Total packets | Discarded packets |
| A | 0 | 15 | 0 |
| B | 0 | 15 | 0 |
| C | 0 | 16 | 0 |
| D | 0 | 16 | 0 |
| Mode M0 | |||
|---|---|---|---|
| Quadrant | BADHDUFLAG | Total packets | Discarded packets |
| A | 0 | 20597 | 2 |
| B | 0 | 19266 | 2 |
| C | 0 | 16377 | 2 |
| D | 0 | 16663 | 2 |
| Quadrant | Total seconds | Saturated seconds | Saturation percentage |
|---|---|---|---|
| A | 6525 | 150 | 2.298851% |
| B | 6525 | 731 | 11.203065% |
| C | 6525 | 176 | 2.697318% |
| D | 6525 | 257 | 3.938697% |
Noise dominated data is calculated using 1-second bins in cleaned event files. If a bin has >2000 counts, and if more than 50% of those come from <1% of pixels, then it is considered to be noise-dominated and hence unusable.
| Quadrant | # 1 sec bins | Bins with >0 counts | Bins with >2000 counts | High rate bins dominated by noise | Noise dominated (total time) | Noise dominated (detector-on time) | Marked lightcurve |
|---|---|---|---|---|---|---|---|
| A | 7750 | 6525 | 13 | 13 | 0.17% | 0.20% | 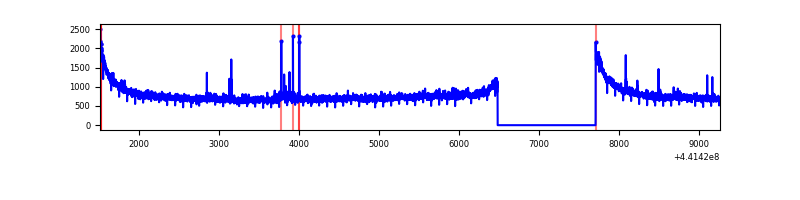 |
| B | 7750 | 6525 | 561 | 561 | 7.24% | 8.60% | 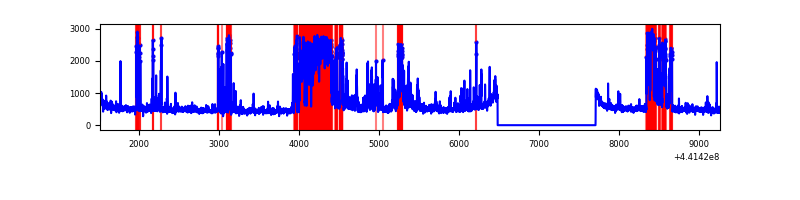 |
| C | 7750 | 6525 | 113 | 113 | 1.46% | 1.73% | 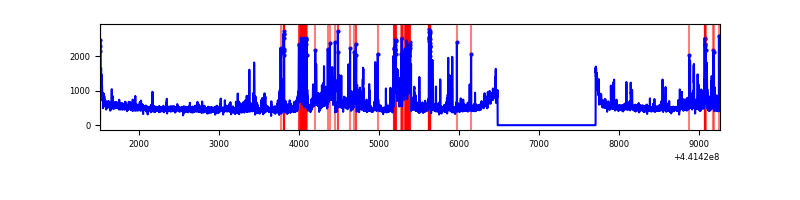 |
| D | 7750 | 6525 | 207 | 207 | 2.67% | 3.17% |  |
Top three noisy pixels from each quadrant. If the there are fewer than three noisy pixels in the level2.evt file, extra rows are filled as -1
| Pixel properties | Quadrant properties | ||||||
|---|---|---|---|---|---|---|---|
| Quadrant | DetID | PixID | Counts | Sigma | Mean | Median | Sigma |
| A | 10 | 83 | 1955773 | 11829.13 | 791 | 774 | 165.3 |
| A | 15 | 223 | 96780 | 580.9 | 791 | 774 | 165.3 |
| A | 13 | 248 | 11342 | 63.94 | 791 | 774 | 165.3 |
| B | 5 | 172 | 1137494 | 7619.24 | 762 | 740 | 149.2 |
| B | 14 | 167 | 882547 | 5910.42 | 762 | 740 | 149.2 |
| B | 0 | 155 | 27589 | 179.96 | 762 | 740 | 149.2 |
| C | 3 | 233 | 838575 | 4592.8 | 777 | 784 | 182.4 |
| C | 12 | 2 | 179238 | 978.29 | 777 | 784 | 182.4 |
| C | 14 | 254 | 54635 | 295.21 | 777 | 784 | 182.4 |
| D | 13 | 249 | 487139 | 2548.1 | 762 | 740 | 190.9 |
| D | 1 | 52 | 397911 | 2080.66 | 762 | 740 | 190.9 |
| D | 7 | 96 | 129265 | 673.3 | 762 | 740 | 190.9 |
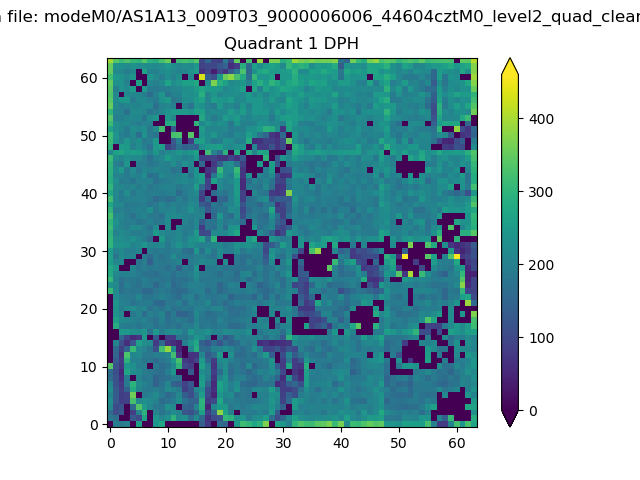
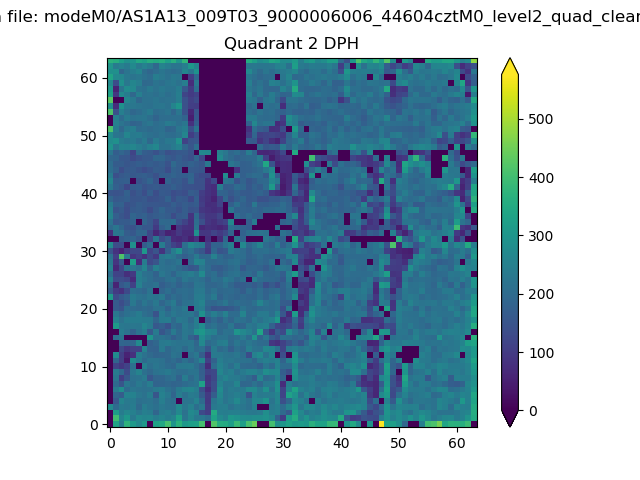
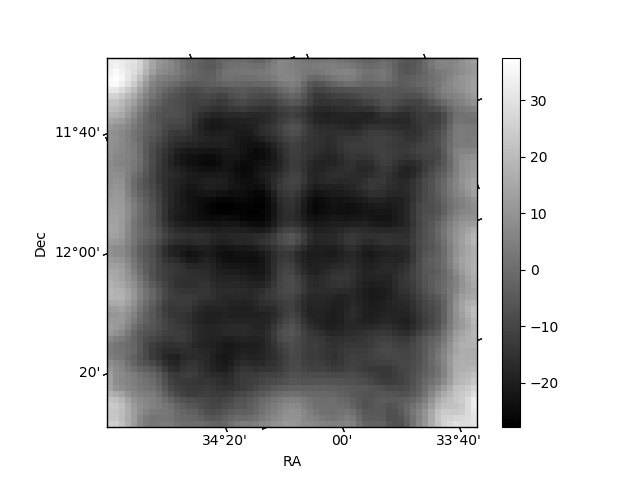
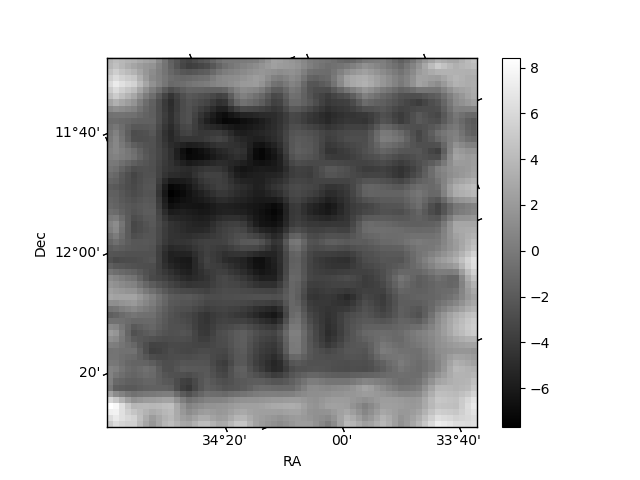
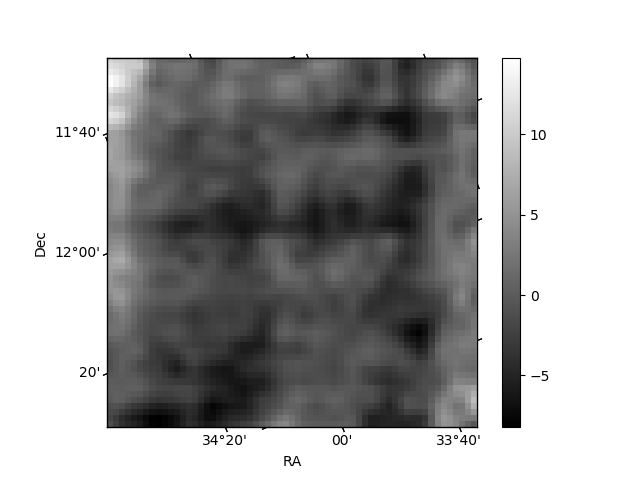
Histogram calculated using DETX and DETY for each event in the final _common_clean file
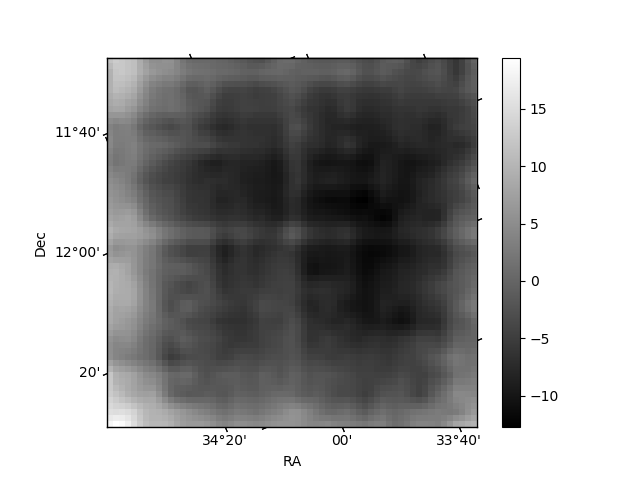
| Quadrant A | 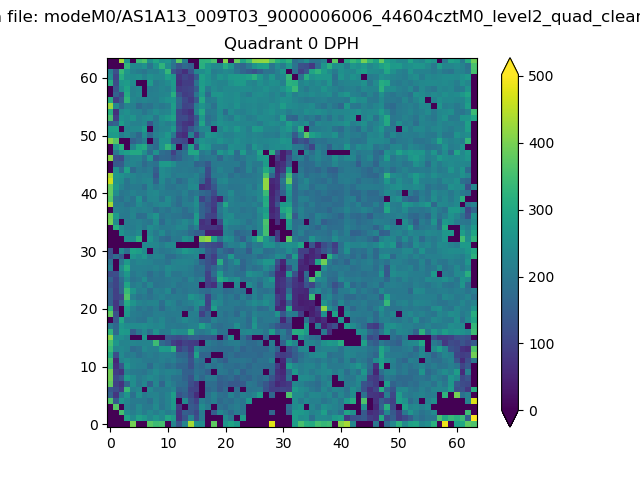 |
 |
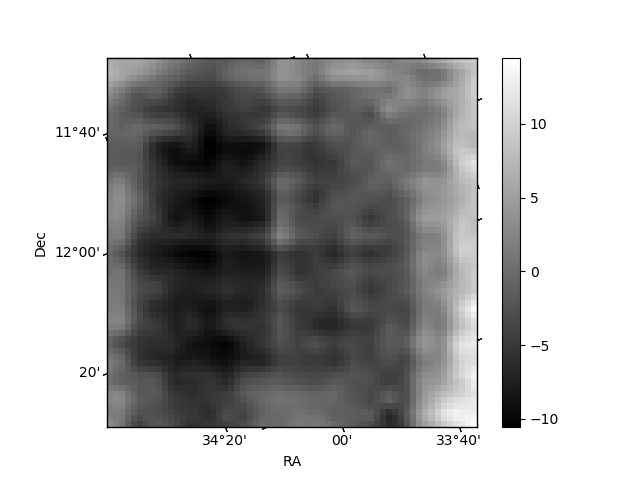
Quadrant B |
|---|---|---|---|
| Quadrant D | 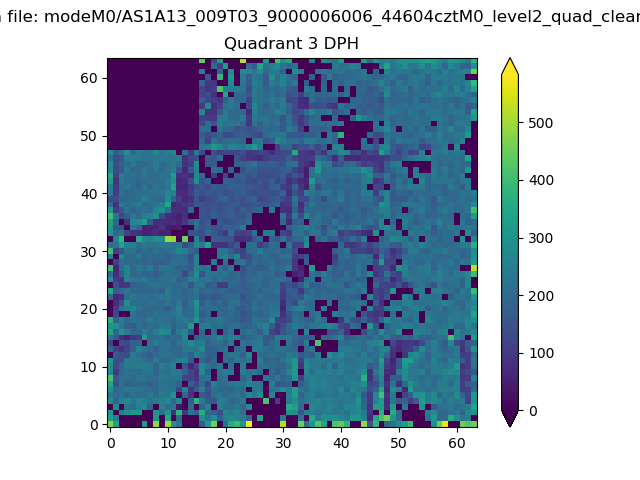 |
 |
Quadrant C |
| Plot type | Count rate plots | Images |
|---|---|---|
| Comparison with Poisson distribution Blue bars denote a histogram of data divided into 1 sec bins. Red curve is a Poisson curve with rate = median count rate of data. |
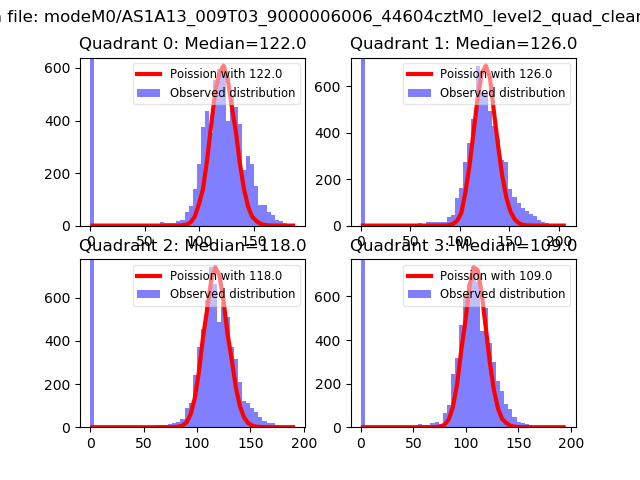 |
 |
| Quadrant-wise count rates Data is divided into 100 sec bins |
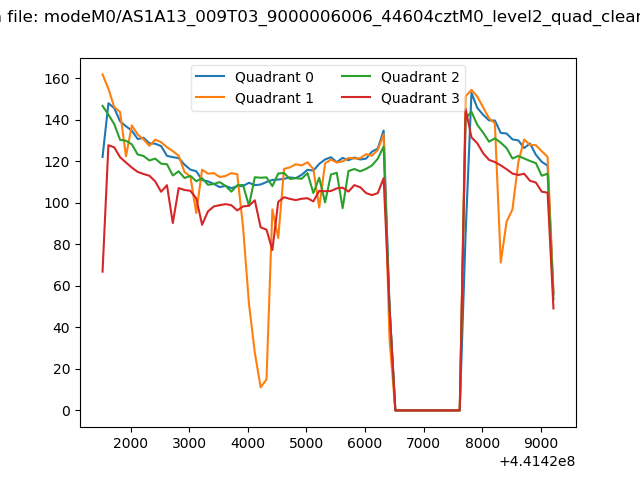 |
|
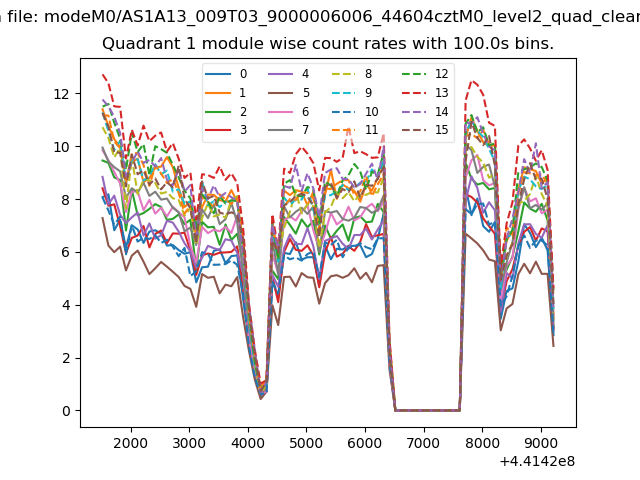
| Module-wise count rates for Quadrant A Data is divided into 100 sec bins |
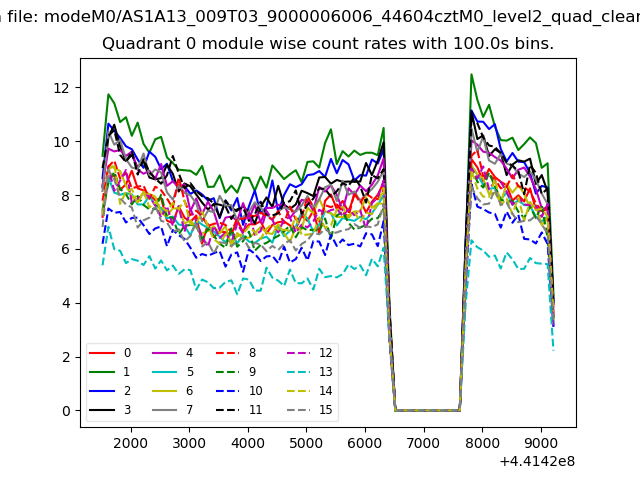 |
 |
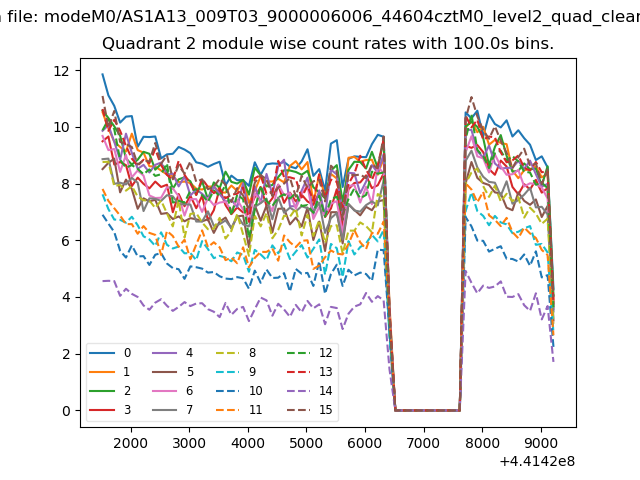
| Module-wise count rates for Quadrant B Data is divided into 100 sec bins |
 |
 |
| Module-wise count rates for Quadrant C Data is divided into 100 sec bins |
 |
 |
| Module-wise count rates for Quadrant D Data is divided into 100 sec bins |
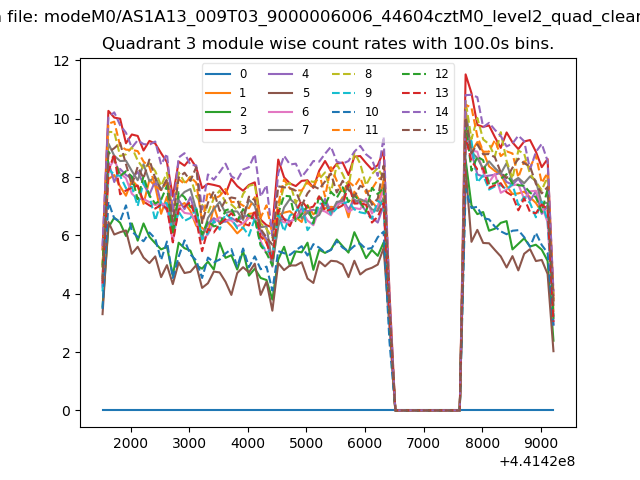 |
 |
| Parameter | Plot |
|---|---|
| CZT HV Monitor | 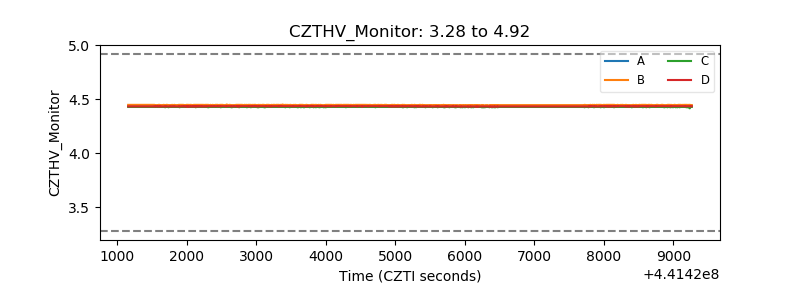 |
| D_VDD | 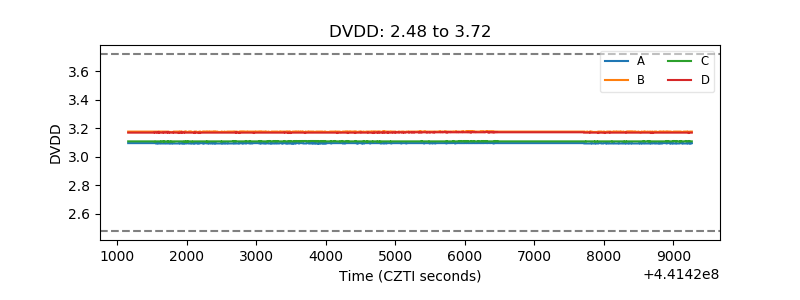 |
| Temperature 1 | 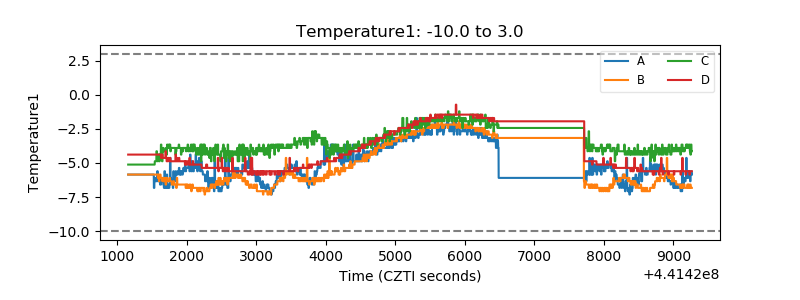 |
| Veto HV Monitor | 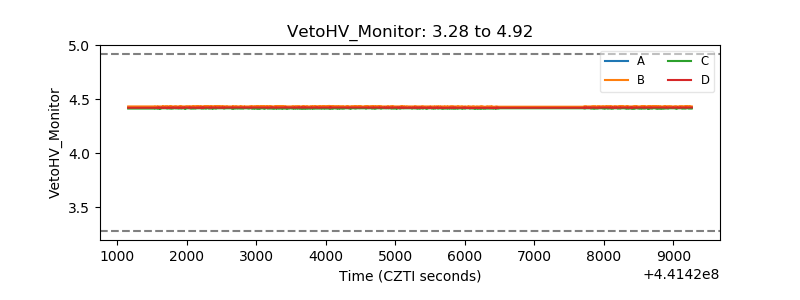 |
| Veto LLD | 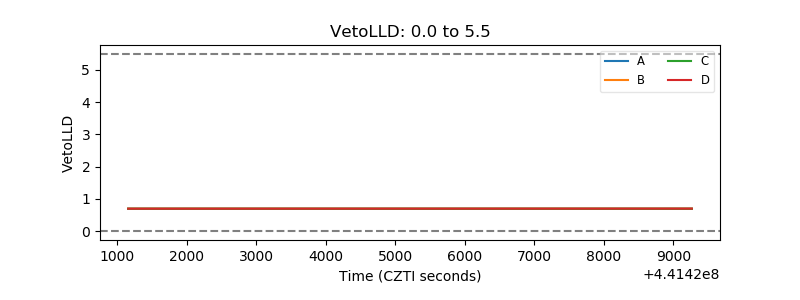 |
| Alpha Counter | 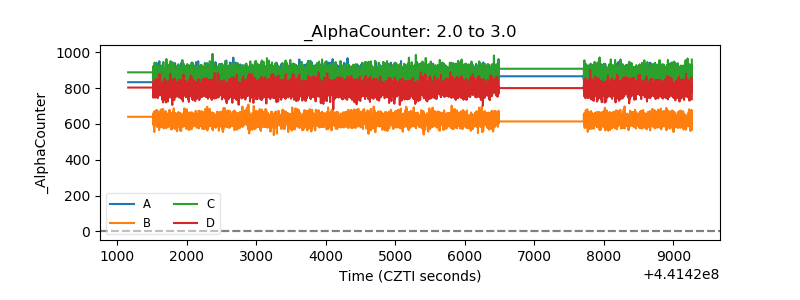 |
| _CPM_Rate | 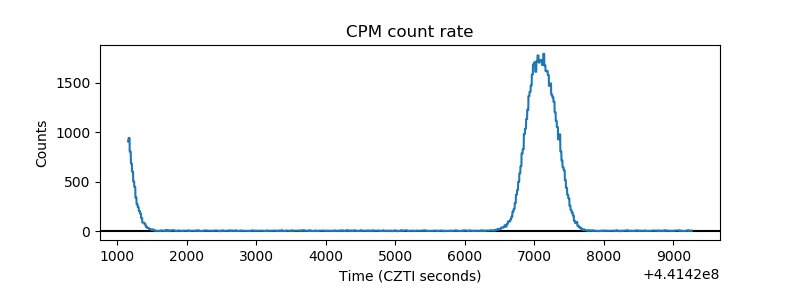 |
| CZT Counter | 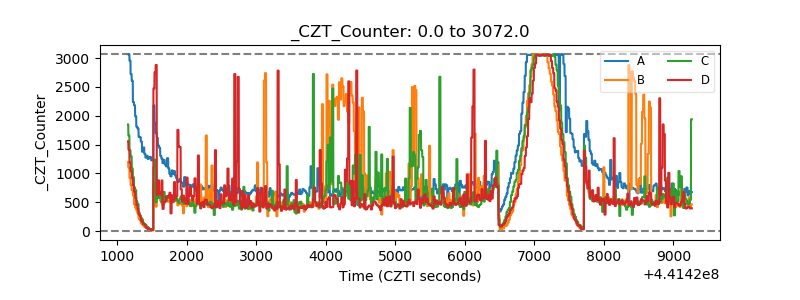 |
| +2.5 Volts monitor | 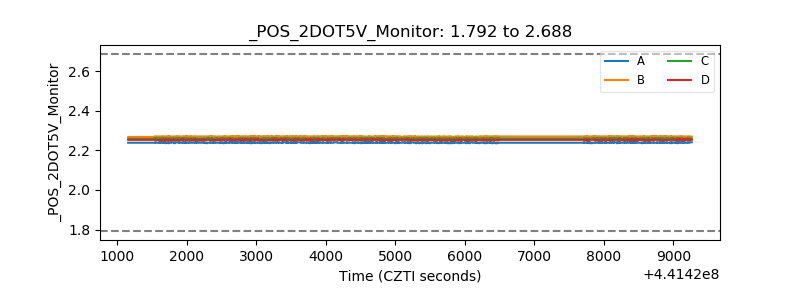 |
| +5 Volts monitor | 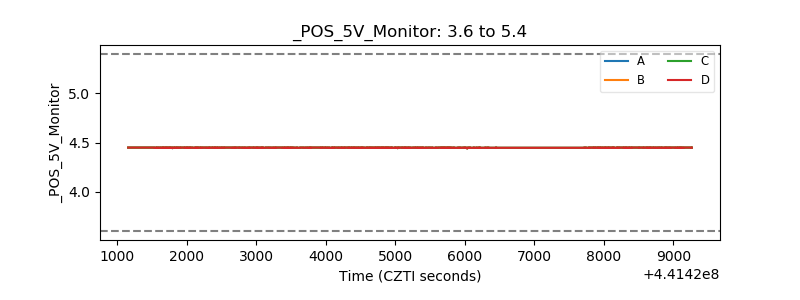 |
| _ROLL_ROT | 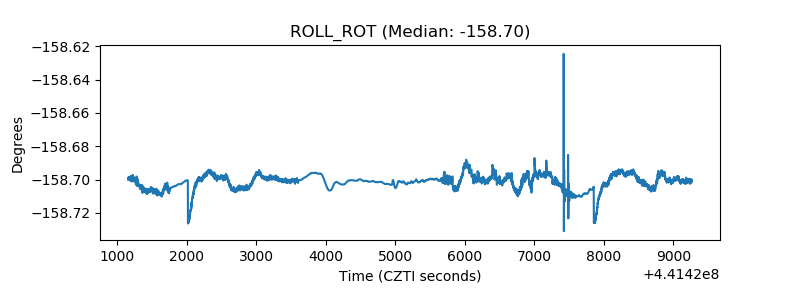 |
| _Roll_DEC | 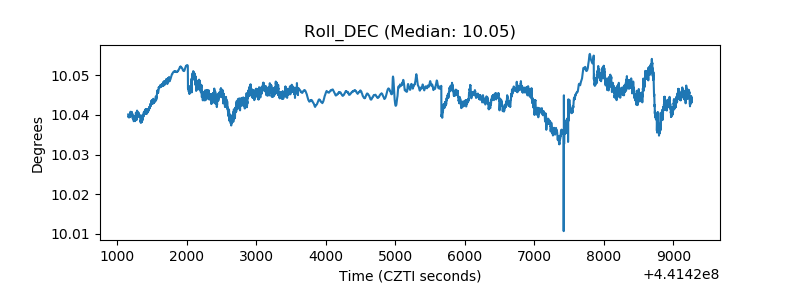 |
| _Roll_RA | 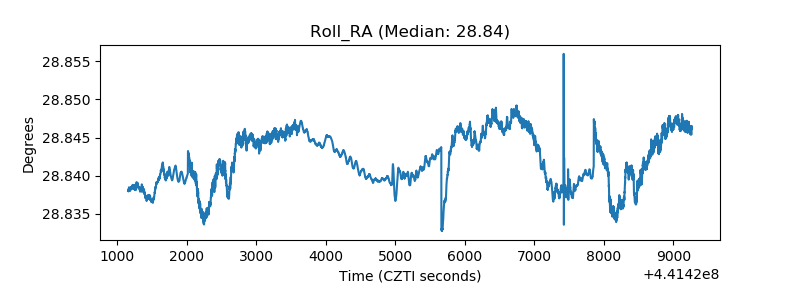 |
| Veto Counter | 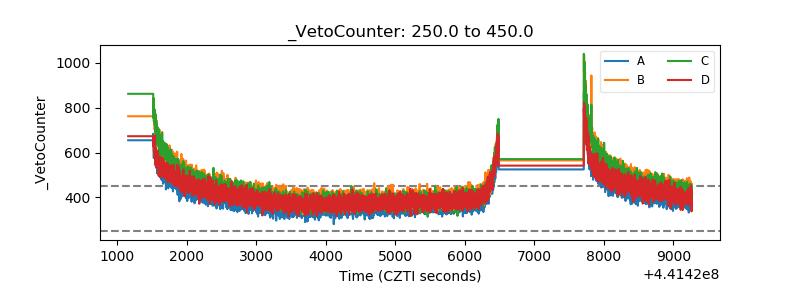 |