| Param | Original file | Final file |
|---|---|---|
| Filename | modeM0/AS1A13_009T03_9000006006_44606cztM0_level2.fits | modeM0/AS1A13_009T03_9000006006_44606cztM0_level2_quad_clean.evt |
| Size (bytes) | 1,243,751,040 | 261,247,680 |
| Size | 1.2 GB | 249.1 MB |
| Events in quadrant A | 12,879,543 | 1,778,015 |
| Events in quadrant B | 11,245,125 | 1,717,737 |
| Events in quadrant C | 8,886,889 | 1,785,347 |
| Events in quadrant D | 11,819,440 | 1,549,928 |
| Mode SS | |||
|---|---|---|---|
| Quadrant | BADHDUFLAG | Total packets | Discarded packets |
| A | 0 | 320 | 0 |
| B | 0 | 320 | 0 |
| C | 0 | 320 | 0 |
| D | 0 | 320 | 0 |
| Mode M9 | |||
|---|---|---|---|
| Quadrant | BADHDUFLAG | Total packets | Discarded packets |
| A | 0 | 36 | 0 |
| B | 0 | 36 | 0 |
| C | 0 | 36 | 0 |
| D | 0 | 36 | 0 |
| Mode M0 | |||
|---|---|---|---|
| Quadrant | BADHDUFLAG | Total packets | Discarded packets |
| A | 0 | 51156 | 2 |
| B | 0 | 43621 | 2 |
| C | 0 | 36768 | 2 |
| D | 0 | 45814 | 3 |
| Quadrant | Total seconds | Saturated seconds | Saturation percentage |
|---|---|---|---|
| A | 15641 | 631 | 4.034269% |
| B | 15642 | 1408 | 9.001406% |
| C | 15642 | 340 | 2.173635% |
| D | 15641 | 1195 | 7.640176% |
Noise dominated data is calculated using 1-second bins in cleaned event files. If a bin has >2000 counts, and if more than 50% of those come from <1% of pixels, then it is considered to be noise-dominated and hence unusable.
| Quadrant | # 1 sec bins | Bins with >0 counts | Bins with >2000 counts | High rate bins dominated by noise | Noise dominated (total time) | Noise dominated (detector-on time) | Marked lightcurve |
|---|---|---|---|---|---|---|---|
| A | 19231 | 15641 | 299 | 299 | 1.55% | 1.91% | 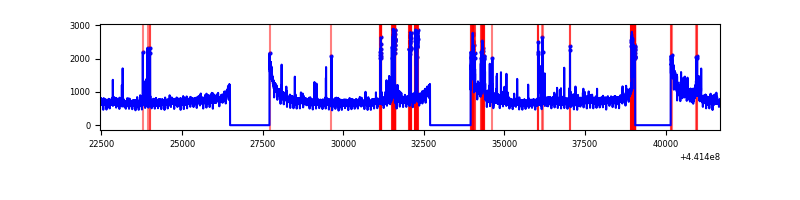 |
| B | 19232 | 15642 | 972 | 972 | 5.05% | 6.21% | 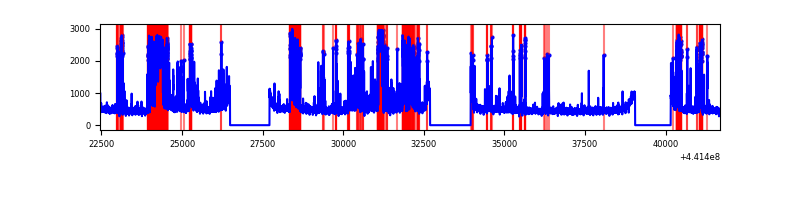 |
| C | 19232 | 15642 | 192 | 192 | 1.00% | 1.23% | 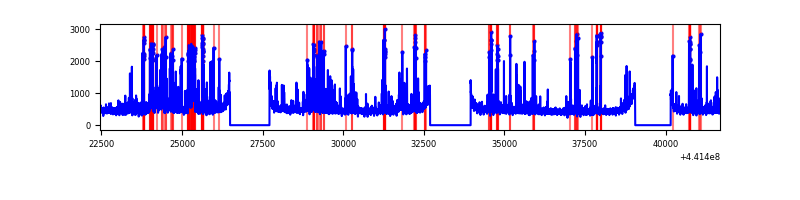 |
| D | 19231 | 15641 | 1079 | 1079 | 5.61% | 6.90% | 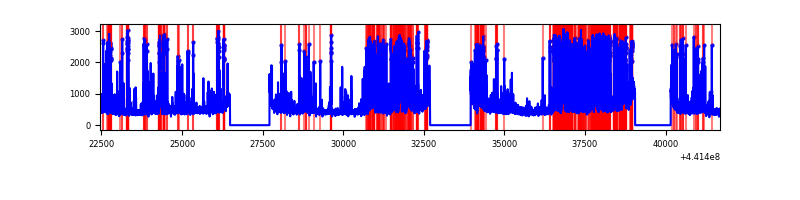 |
Top three noisy pixels from each quadrant. If the there are fewer than three noisy pixels in the level2.evt file, extra rows are filled as -1
| Pixel properties | Quadrant properties | ||||||
|---|---|---|---|---|---|---|---|
| Quadrant | DetID | PixID | Counts | Sigma | Mean | Median | Sigma |
| A | 10 | 83 | 4333753 | 11415.86 | 1848 | 1812 | 379.5 |
| A | 15 | 223 | 767389 | 2017.51 | 1848 | 1812 | 379.5 |
| A | 9 | 191 | 558753 | 1467.69 | 1848 | 1812 | 379.5 |
| B | 14 | 167 | 2113503 | 5895.29 | 1823 | 1769 | 358.2 |
| B | 5 | 172 | 1802322 | 5026.57 | 1823 | 1769 | 358.2 |
| B | 0 | 155 | 64404 | 174.86 | 1823 | 1769 | 358.2 |
| C | 3 | 233 | 910847 | 2112.63 | 1838 | 1850 | 430.3 |
| C | 12 | 2 | 513375 | 1188.85 | 1838 | 1850 | 430.3 |
| C | 14 | 254 | 151303 | 347.35 | 1838 | 1850 | 430.3 |
| D | 13 | 249 | 2105075 | 4668.58 | 1791 | 1738 | 450.5 |
| D | 1 | 52 | 1033497 | 2290.1 | 1791 | 1738 | 450.5 |
| D | 5 | 222 | 828761 | 1835.67 | 1791 | 1738 | 450.5 |
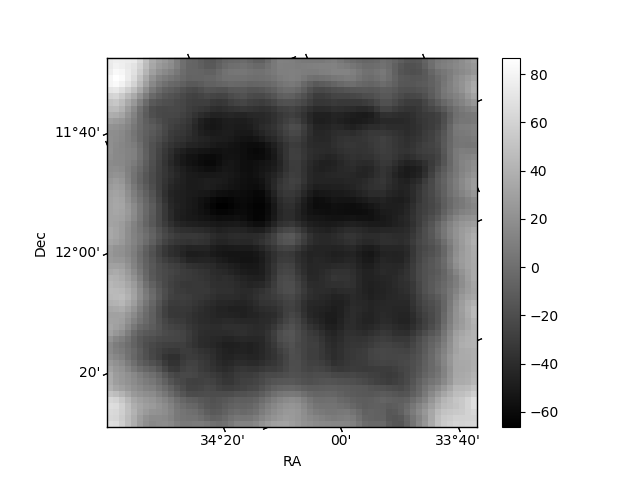
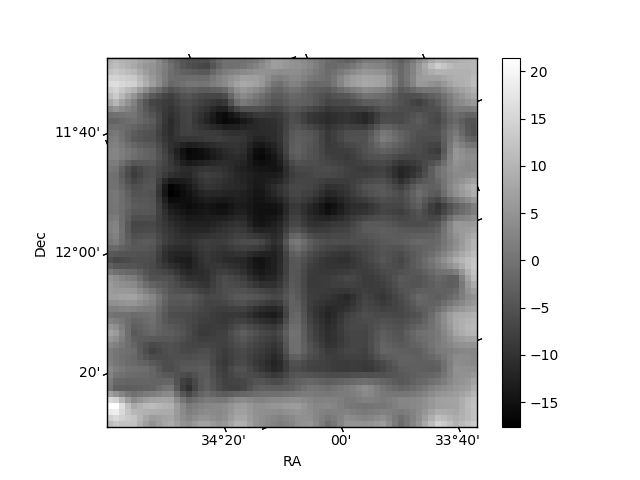
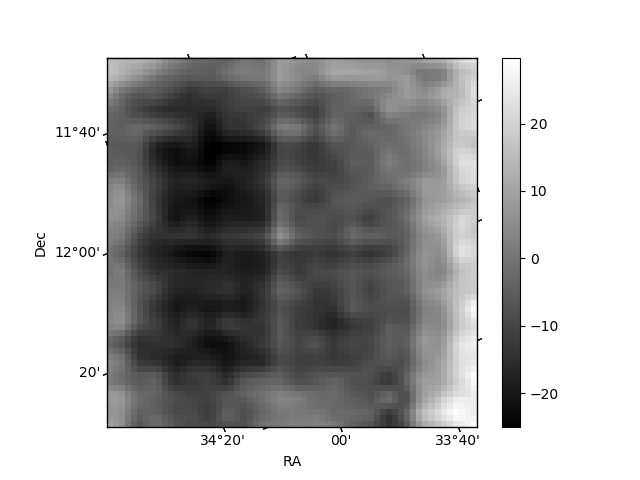
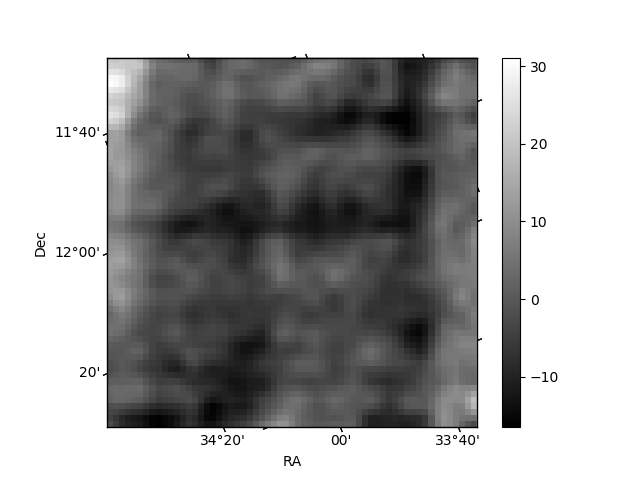
Histogram calculated using DETX and DETY for each event in the final _common_clean file
| Quadrant A | 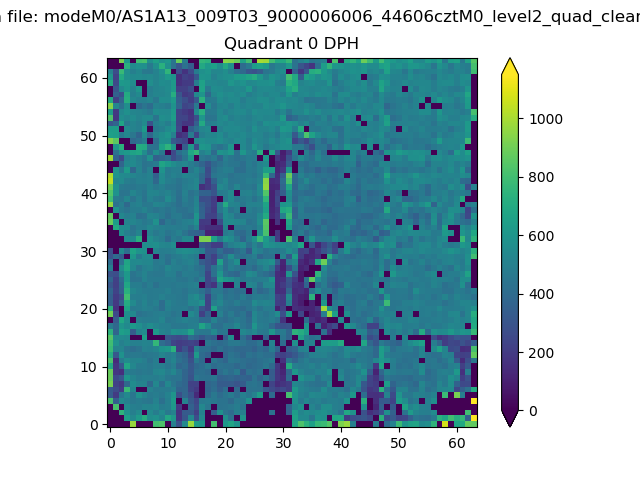 |
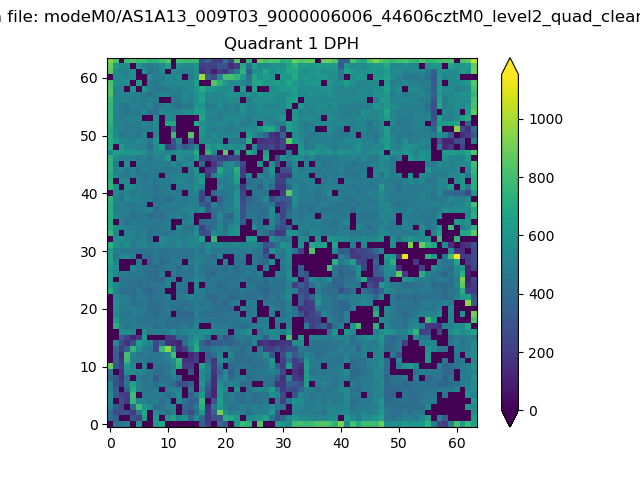 |
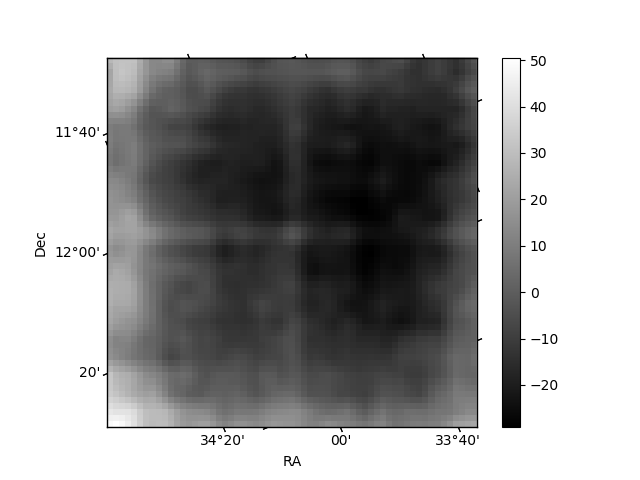
Quadrant B |
|---|---|---|---|
| Quadrant D | 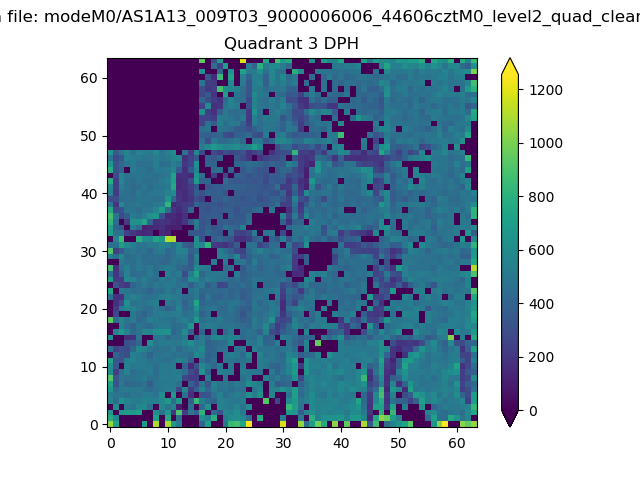 |
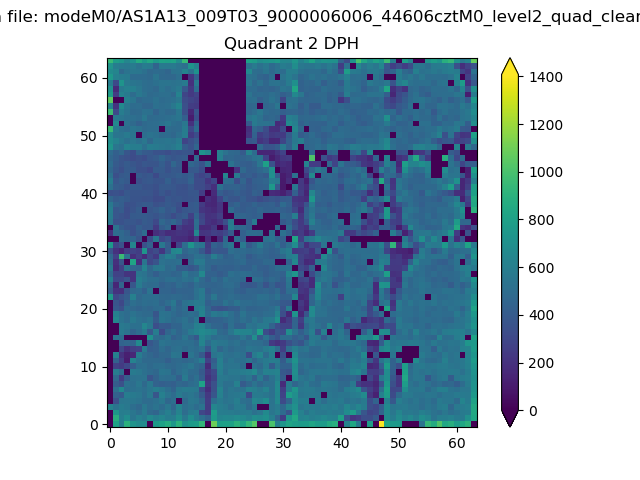 |
Quadrant C |
| Plot type | Count rate plots | Images |
|---|---|---|
| Comparison with Poisson distribution Blue bars denote a histogram of data divided into 1 sec bins. Red curve is a Poisson curve with rate = median count rate of data. |
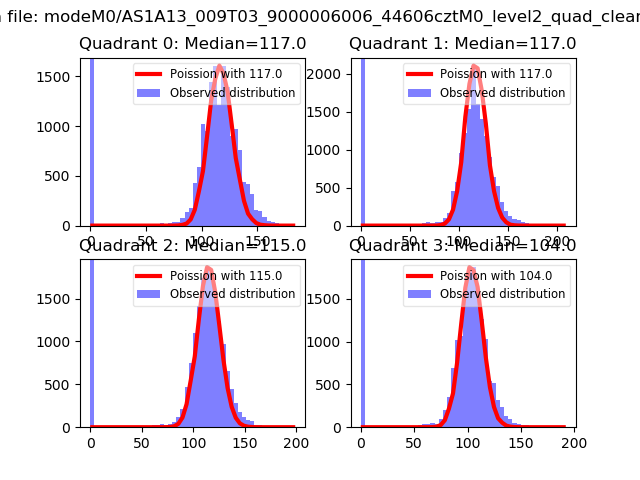 |
 |
| Quadrant-wise count rates Data is divided into 100 sec bins |
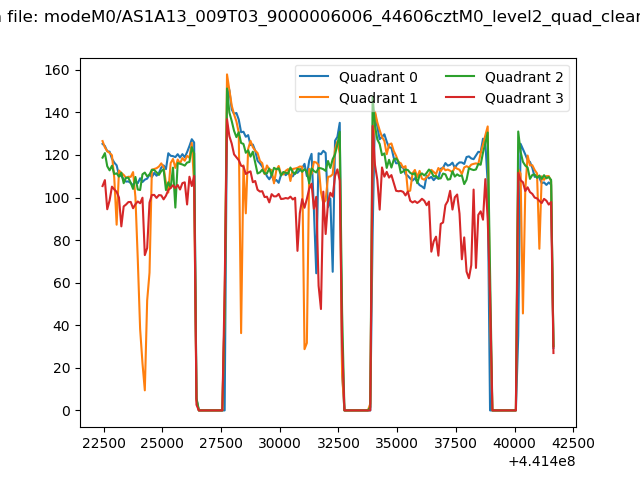 |
|
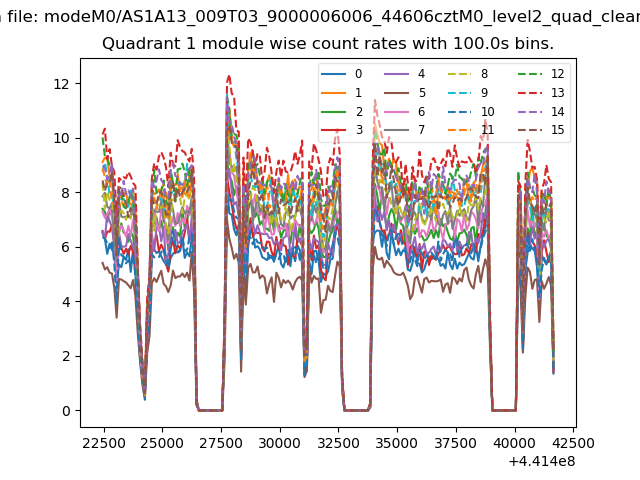
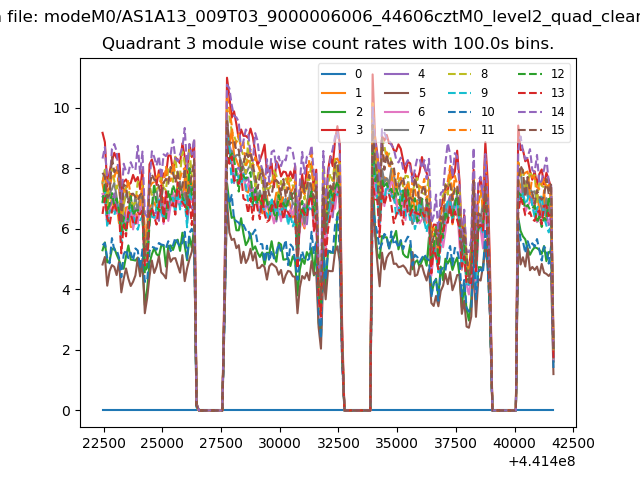
| Module-wise count rates for Quadrant A Data is divided into 100 sec bins |
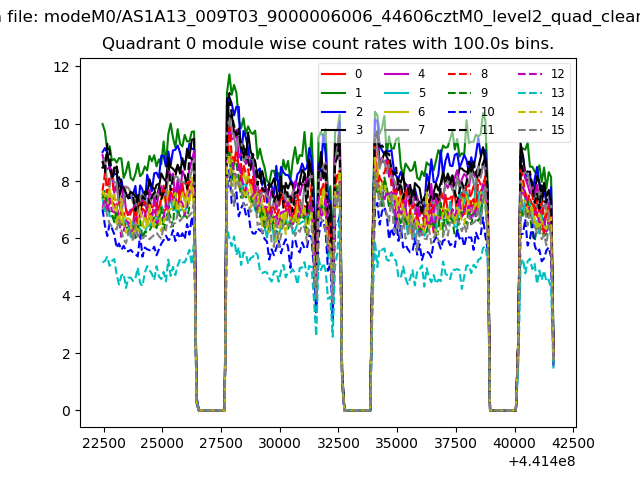 |
 |
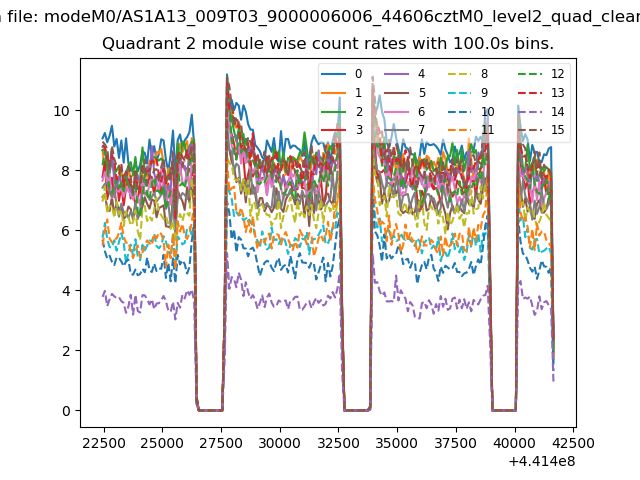
| Module-wise count rates for Quadrant B Data is divided into 100 sec bins |
 |
 |
| Module-wise count rates for Quadrant C Data is divided into 100 sec bins |
 |
 |
| Module-wise count rates for Quadrant D Data is divided into 100 sec bins |
 |
 |
| Parameter | Plot |
|---|---|
| CZT HV Monitor | 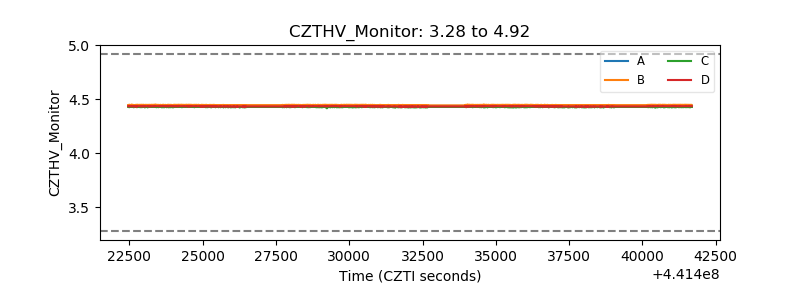 |
| D_VDD |  |
| Temperature 1 | 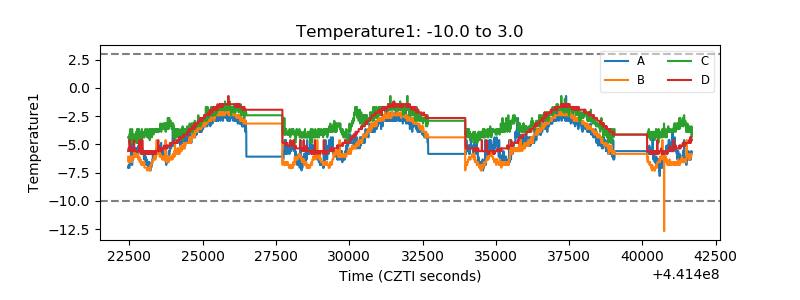 |
| Veto HV Monitor | 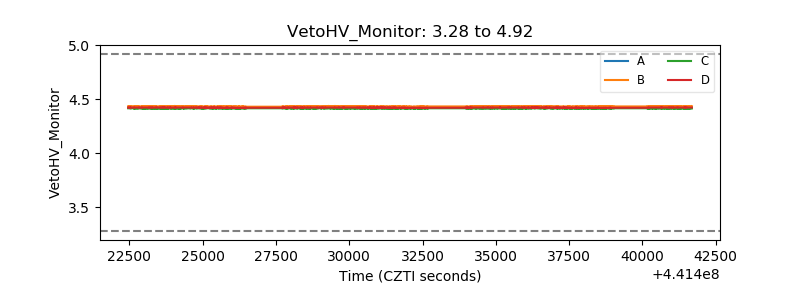 |
| Veto LLD | 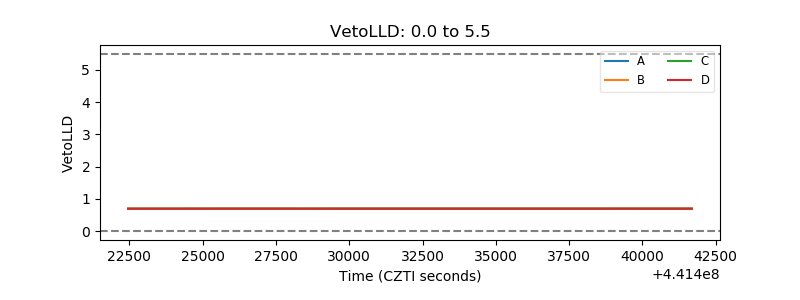 |
| Alpha Counter |  |
| _CPM_Rate | 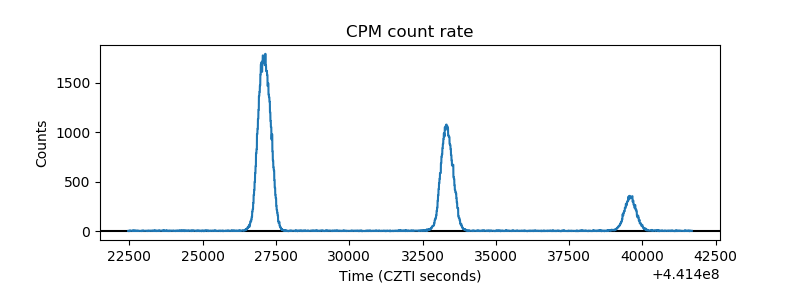 |
| CZT Counter | 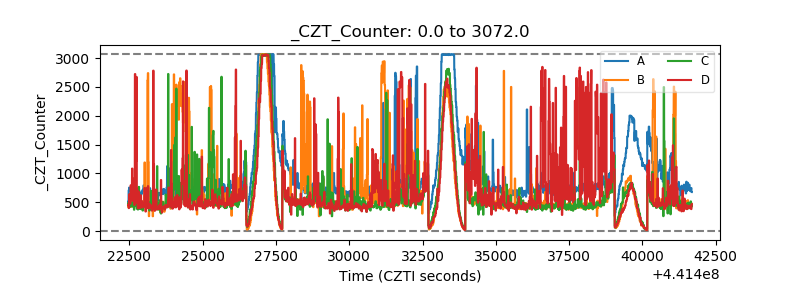 |
| +2.5 Volts monitor | 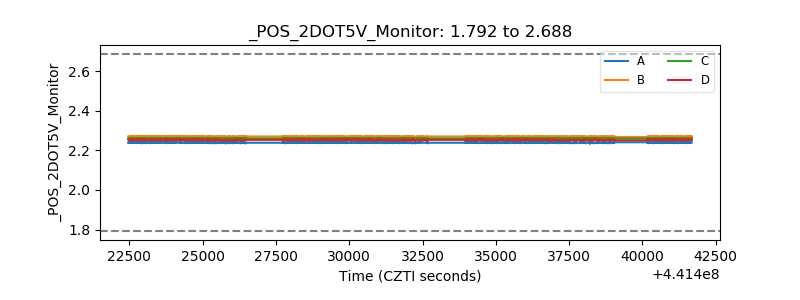 |
| +5 Volts monitor | 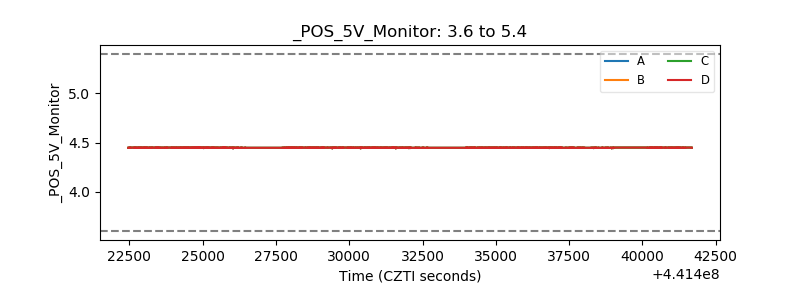 |
| _ROLL_ROT | 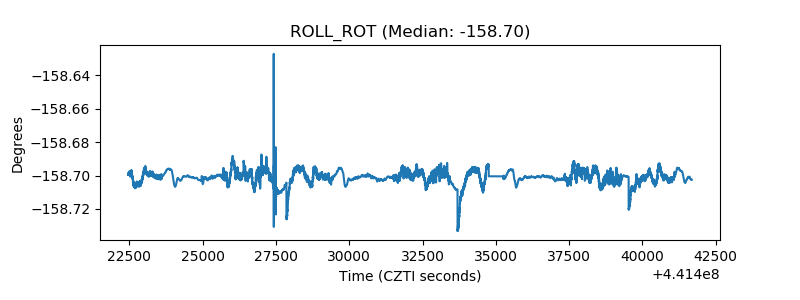 |
| _Roll_DEC | 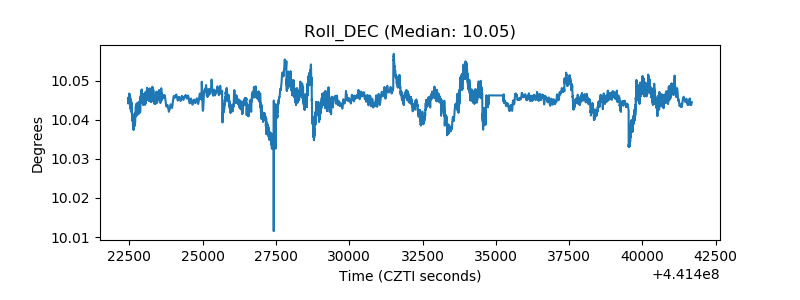 |
| _Roll_RA | 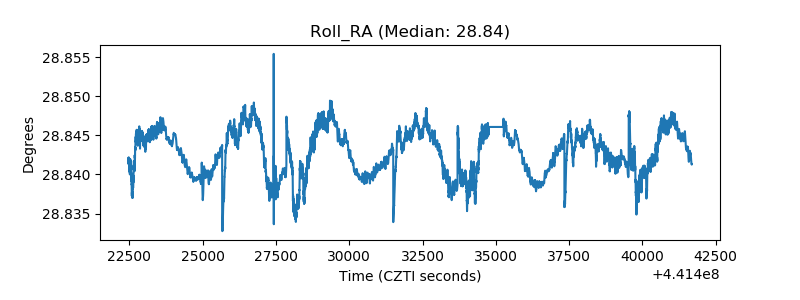 |
| Veto Counter | 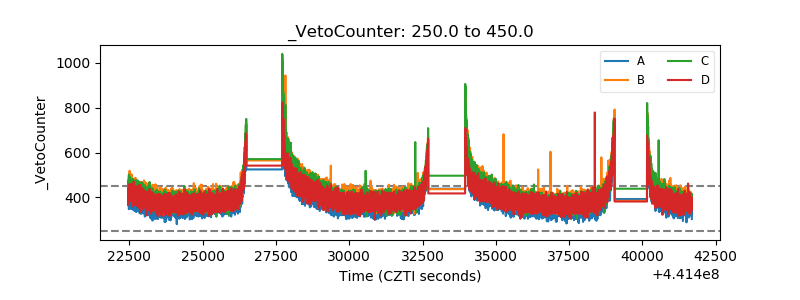 |