| Param | Original file | Final file |
|---|---|---|
| Filename | modeM0/AS1A13_009T03_9000006006_44607cztM0_level2.fits | modeM0/AS1A13_009T03_9000006006_44607cztM0_level2_quad_clean.evt |
| Size (bytes) | 653,771,520 | 101,995,200 |
| Size | 623.5 MB | 97.3 MB |
| Events in quadrant A | 11,342,837 | 424,539 |
| Events in quadrant B | 3,978,086 | 757,657 |
| Events in quadrant C | 3,582,058 | 753,637 |
| Events in quadrant D | 4,760,795 | 671,502 |
| Mode SS | |||
|---|---|---|---|
| Quadrant | BADHDUFLAG | Total packets | Discarded packets |
| A | 0 | 138 | 0 |
| B | 0 | 138 | 0 |
| C | 0 | 138 | 0 |
| D | 0 | 138 | 0 |
| Mode M9 | |||
|---|---|---|---|
| Quadrant | BADHDUFLAG | Total packets | Discarded packets |
| A | 0 | 16 | 0 |
| B | 0 | 17 | 0 |
| C | 0 | 17 | 0 |
| D | 0 | 17 | 0 |
| Mode M0 | |||
|---|---|---|---|
| Quadrant | BADHDUFLAG | Total packets | Discarded packets |
| A | 0 | 38805 | 2 |
| B | 0 | 16475 | 0 |
| C | 0 | 15421 | 0 |
| D | 0 | 18949 | 0 |
| Quadrant | Total seconds | Saturated seconds | Saturation percentage |
|---|---|---|---|
| A | 6911 | 3204 | 46.360874% |
| B | 6911 | 442 | 6.395601% |
| C | 6911 | 157 | 2.271741% |
| D | 6911 | 427 | 6.178556% |
Noise dominated data is calculated using 1-second bins in cleaned event files. If a bin has >2000 counts, and if more than 50% of those come from <1% of pixels, then it is considered to be noise-dominated and hence unusable.
| Quadrant | # 1 sec bins | Bins with >0 counts | Bins with >2000 counts | High rate bins dominated by noise | Noise dominated (total time) | Noise dominated (detector-on time) | Marked lightcurve |
|---|---|---|---|---|---|---|---|
| A | 7696 | 6911 | 2937 | 2937 | 38.16% | 42.50% | 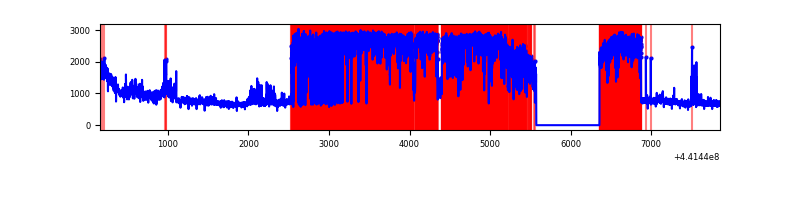 |
| B | 7696 | 6911 | 165 | 165 | 2.14% | 2.39% | 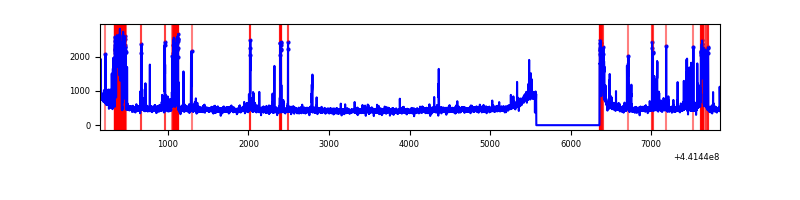 |
| C | 7696 | 6911 | 53 | 53 | 0.69% | 0.77% | 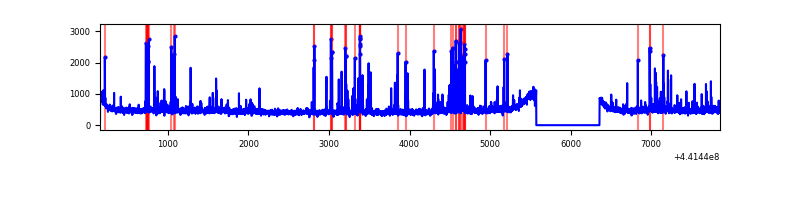 |
| D | 7696 | 6911 | 352 | 352 | 4.57% | 5.09% | 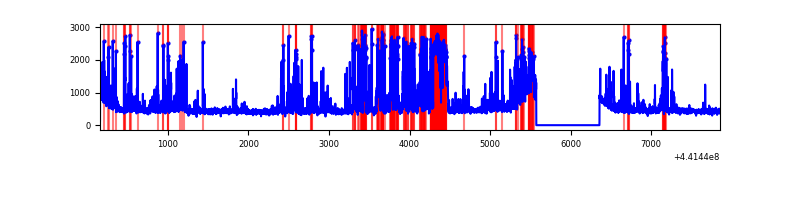 |
Top three noisy pixels from each quadrant. If the there are fewer than three noisy pixels in the level2.evt file, extra rows are filled as -1
| Pixel properties | Quadrant properties | ||||||
|---|---|---|---|---|---|---|---|
| Quadrant | DetID | PixID | Counts | Sigma | Mean | Median | Sigma |
| A | 15 | 223 | 7442677 | 58548.88 | 610 | 597 | 127.1 |
| A | 10 | 83 | 1476519 | 11611.48 | 610 | 597 | 127.1 |
| A | 13 | 248 | 62621 | 487.96 | 610 | 597 | 127.1 |
| B | 5 | 172 | 740903 | 4591.26 | 803 | 778 | 161.2 |
| B | 0 | 168 | 24645 | 148.06 | 803 | 778 | 161.2 |
| B | 0 | 219 | 22435 | 134.35 | 803 | 778 | 161.2 |
| C | 12 | 2 | 340133 | 1791.4 | 802 | 809 | 189.4 |
| C | 12 | 249 | 41162 | 213.04 | 802 | 809 | 189.4 |
| C | 3 | 233 | 30117 | 154.73 | 802 | 809 | 189.4 |
| D | 13 | 249 | 800869 | 4050.05 | 786 | 764 | 197.6 |
| D | 1 | 52 | 423201 | 2138.33 | 786 | 764 | 197.6 |
| D | 12 | 233 | 187074 | 943.08 | 786 | 764 | 197.6 |
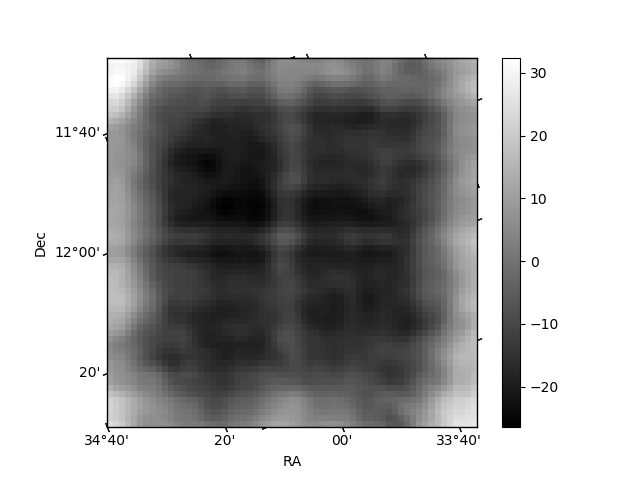
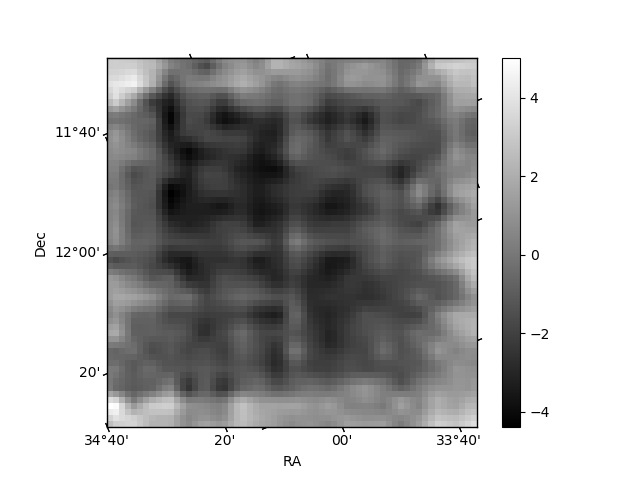
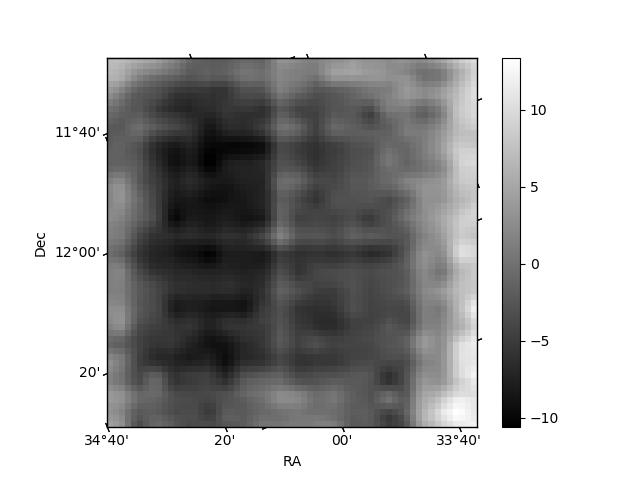
Histogram calculated using DETX and DETY for each event in the final _common_clean file
| Quadrant A | 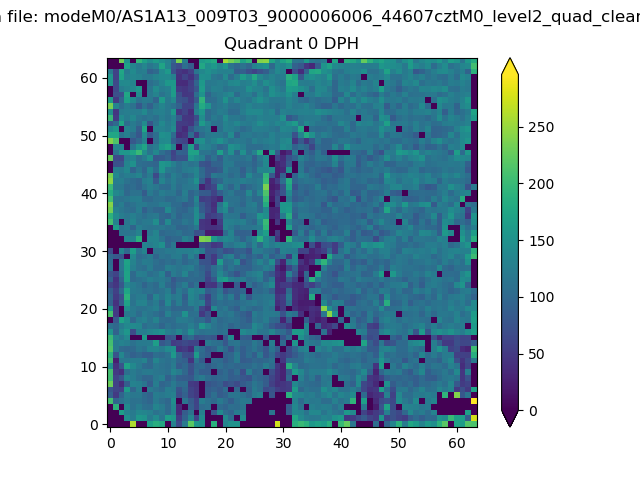 |
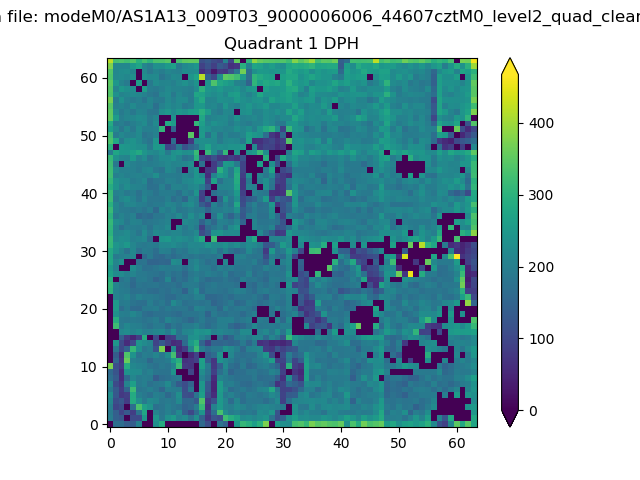 |
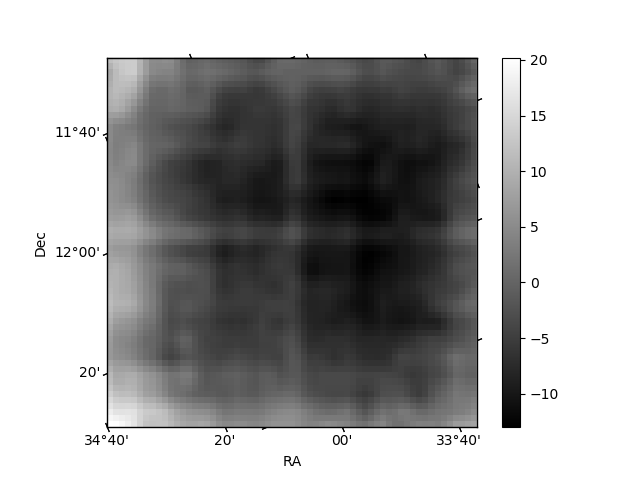
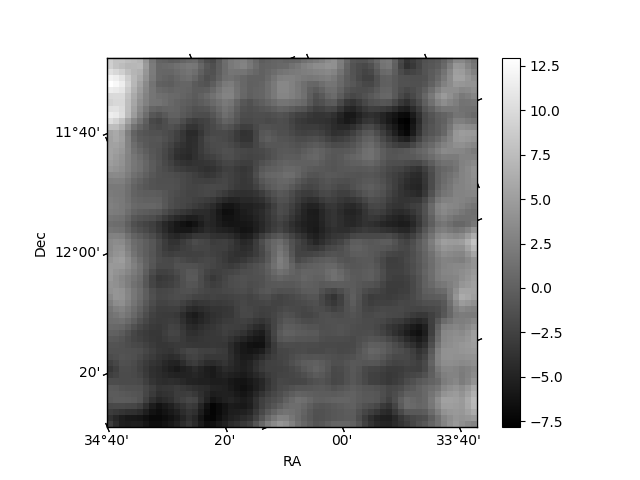
Quadrant B |
|---|---|---|---|
| Quadrant D | 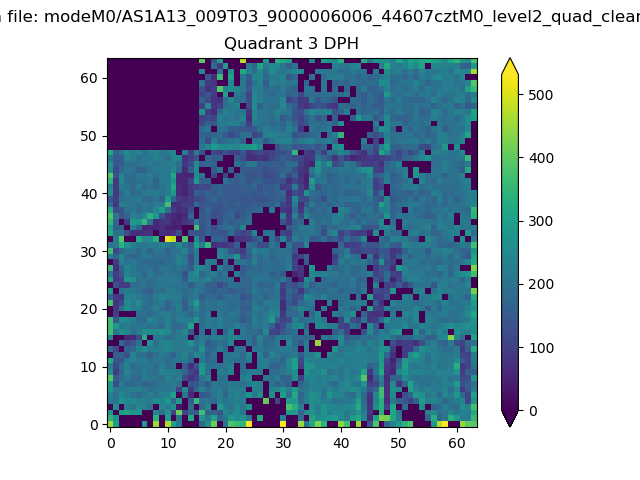 |
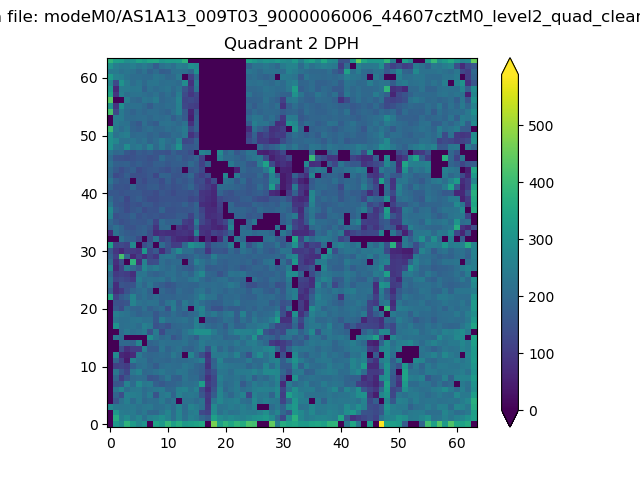 |
Quadrant C |
| Plot type | Count rate plots | Images |
|---|---|---|
| Comparison with Poisson distribution Blue bars denote a histogram of data divided into 1 sec bins. Red curve is a Poisson curve with rate = median count rate of data. |
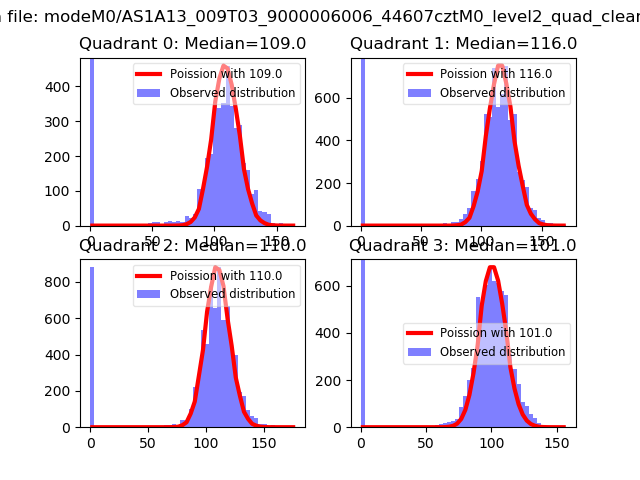 |
 |
| Quadrant-wise count rates Data is divided into 100 sec bins |
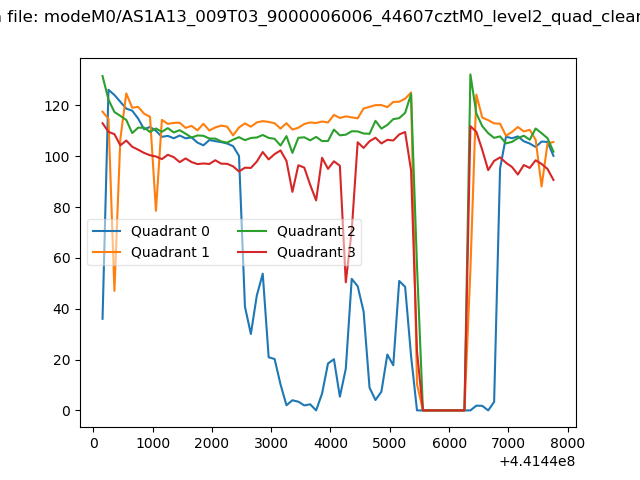 |
|
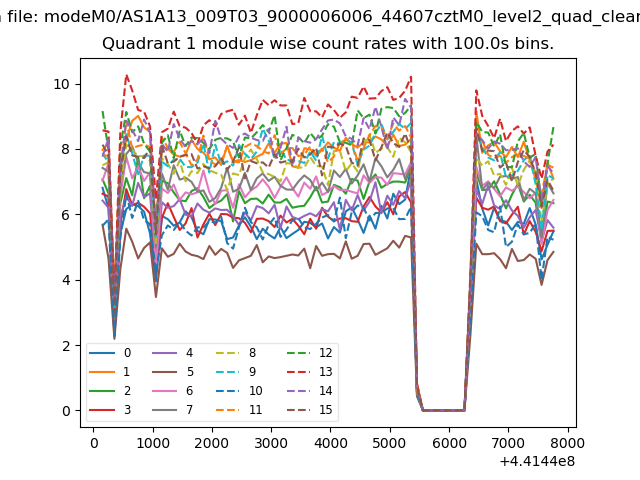
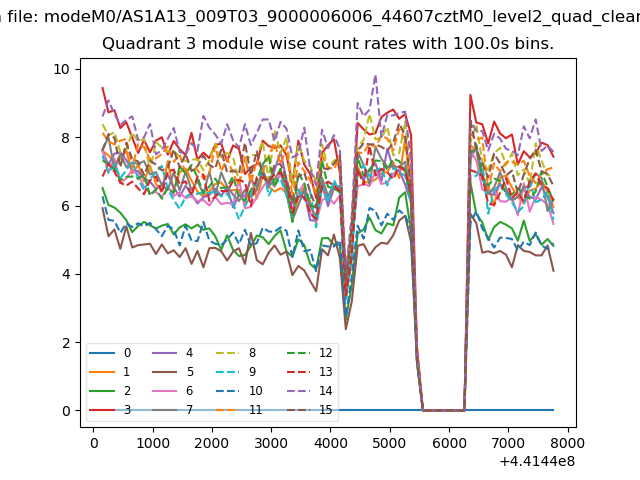
| Module-wise count rates for Quadrant A Data is divided into 100 sec bins |
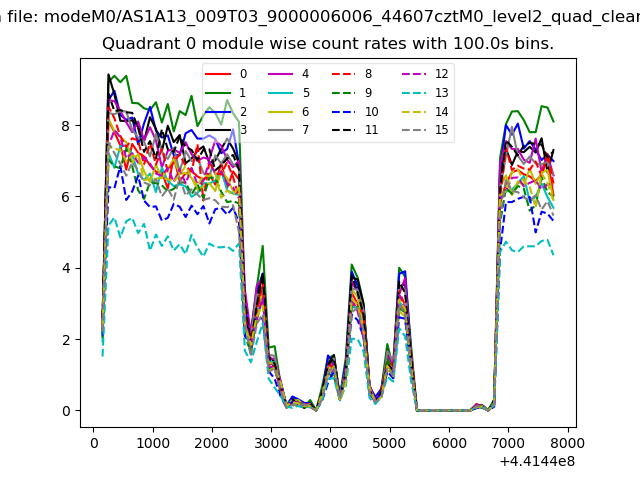 |
 |
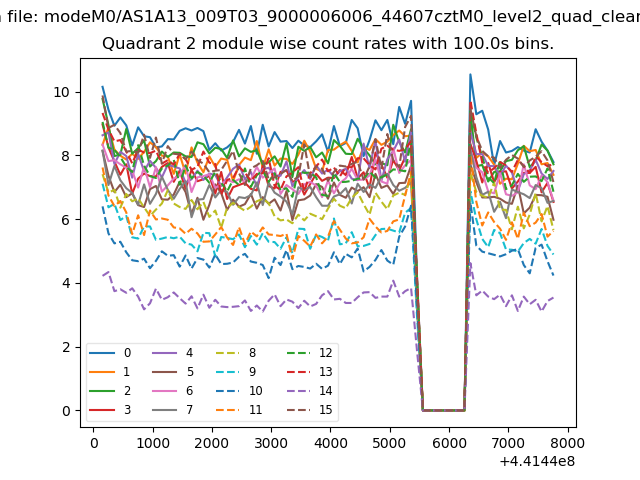
| Module-wise count rates for Quadrant B Data is divided into 100 sec bins |
 |
 |
| Module-wise count rates for Quadrant C Data is divided into 100 sec bins |
 |
 |
| Module-wise count rates for Quadrant D Data is divided into 100 sec bins |
 |
 |
| Parameter | Plot |
|---|---|
| CZT HV Monitor | 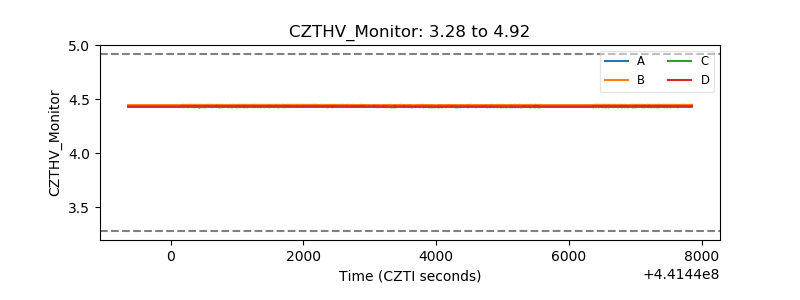 |
| D_VDD | 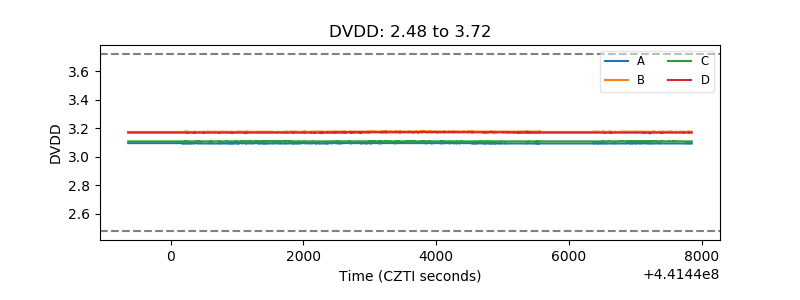 |
| Temperature 1 | 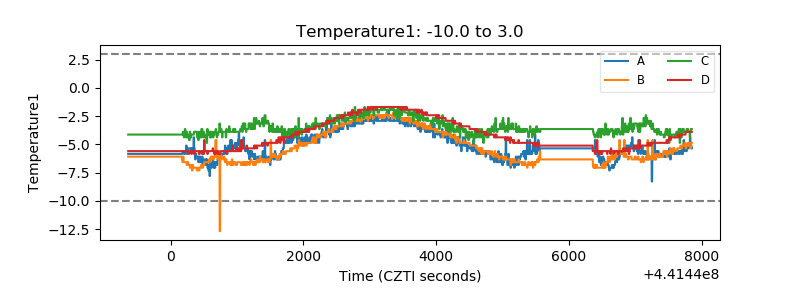 |
| Veto HV Monitor | 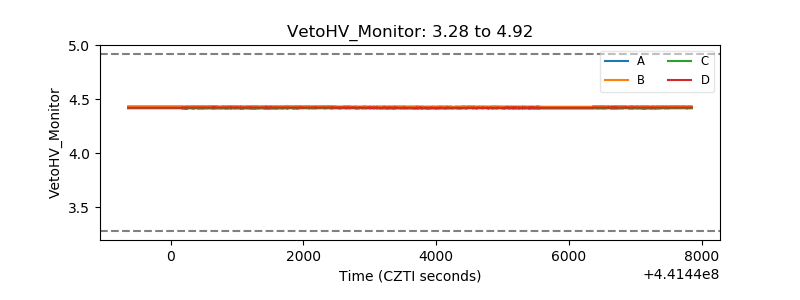 |
| Veto LLD | 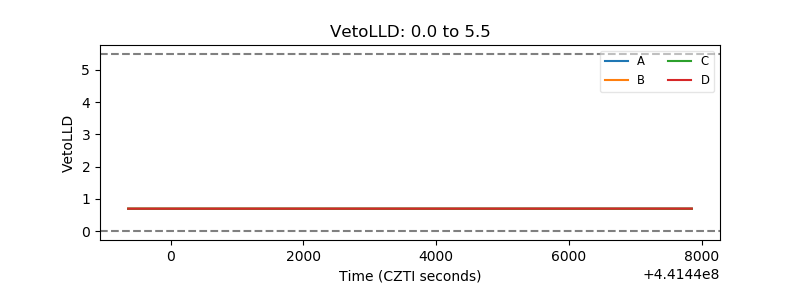 |
| Alpha Counter | 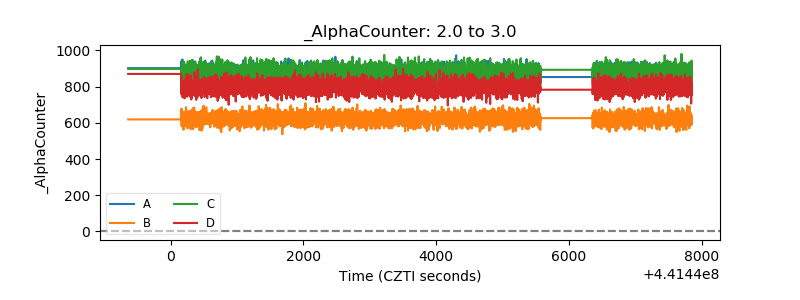 |
| _CPM_Rate | 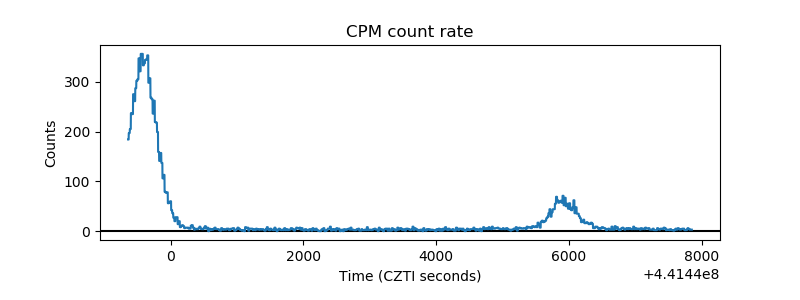 |
| CZT Counter | 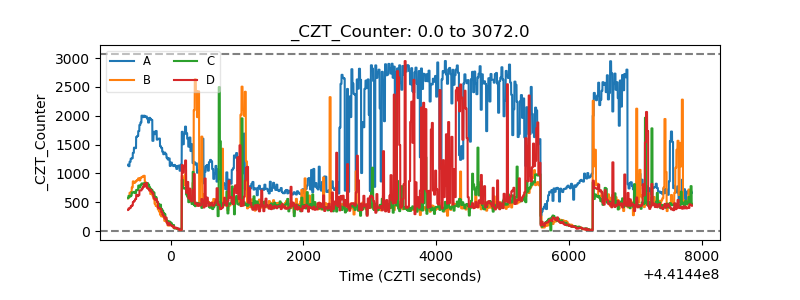 |
| +2.5 Volts monitor | 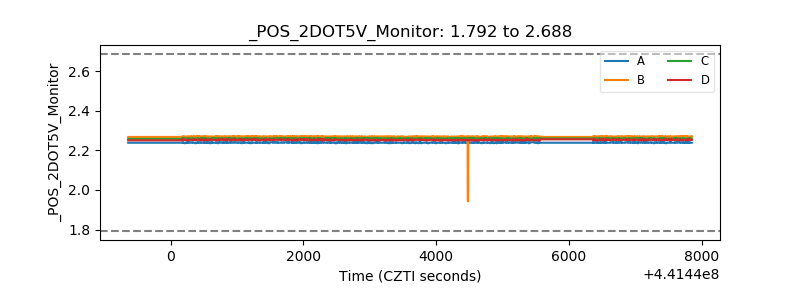 |
| +5 Volts monitor | 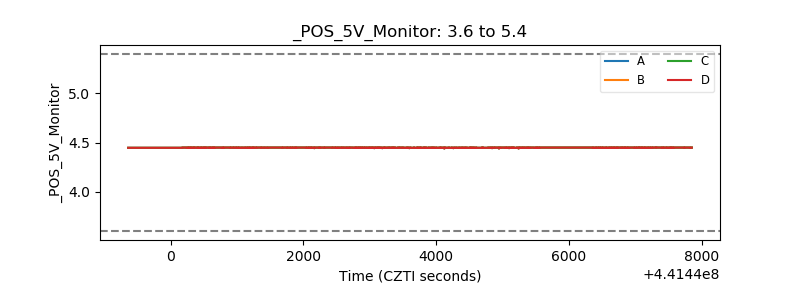 |
| _ROLL_ROT | 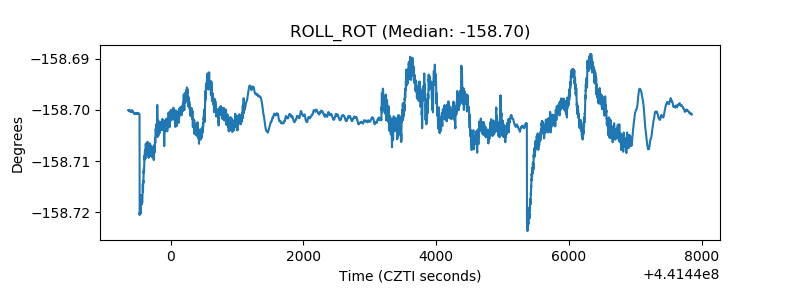 |
| _Roll_DEC | 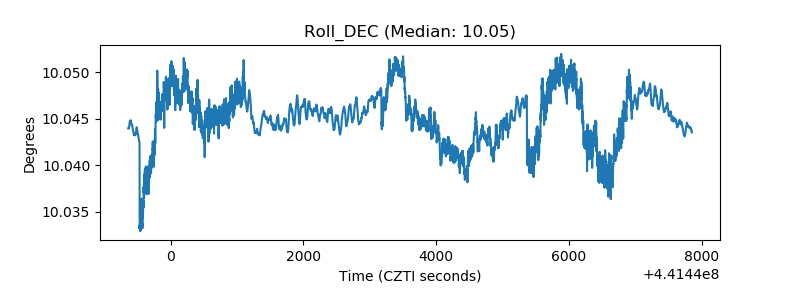 |
| _Roll_RA | 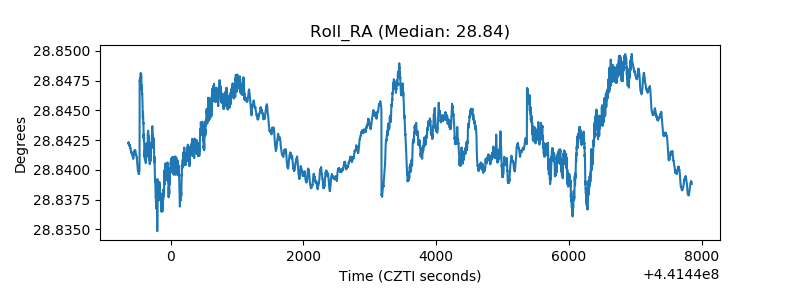 |
| Veto Counter | 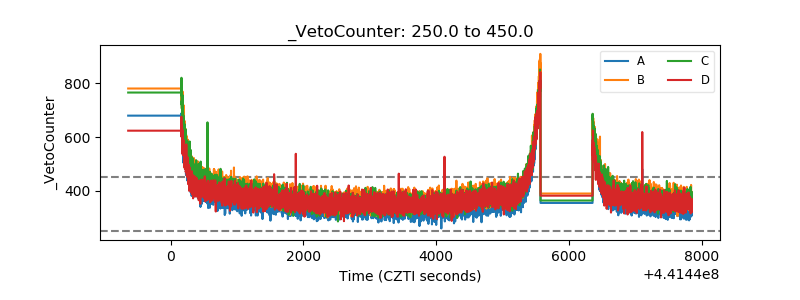 |