| Param | Original file | Final file |
|---|---|---|
| Filename | modeM0/AS1A13_009T03_9000006006_44608cztM0_level2.fits | modeM0/AS1A13_009T03_9000006006_44608cztM0_level2_quad_clean.evt |
| Size (bytes) | 589,334,400 | 119,522,880 |
| Size | 562.0 MB | 114.0 MB |
| Events in quadrant A | 6,807,499 | 756,291 |
| Events in quadrant B | 4,157,223 | 821,133 |
| Events in quadrant C | 4,084,293 | 821,274 |
| Events in quadrant D | 6,162,803 | 680,084 |
| Mode SS | |||
|---|---|---|---|
| Quadrant | BADHDUFLAG | Total packets | Discarded packets |
| A | 0 | 156 | 0 |
| B | 0 | 156 | 0 |
| C | 0 | 156 | 0 |
| D | 0 | 156 | 0 |
| Mode M9 | |||
|---|---|---|---|
| Quadrant | BADHDUFLAG | Total packets | Discarded packets |
| A | 0 | 3 | 0 |
| B | 0 | 4 | 0 |
| C | 0 | 4 | 0 |
| D | 0 | 4 | 0 |
| Mode M0 | |||
|---|---|---|---|
| Quadrant | BADHDUFLAG | Total packets | Discarded packets |
| A | 0 | 26559 | 9 |
| B | 0 | 17769 | 2 |
| C | 0 | 17462 | 3 |
| D | 0 | 23620 | 2 |
| Quadrant | Total seconds | Saturated seconds | Saturation percentage |
|---|---|---|---|
| A | 7766 | 923 | 11.885140% |
| B | 7767 | 572 | 7.364491% |
| C | 7766 | 253 | 3.257790% |
| D | 7766 | 1026 | 13.211434% |
Noise dominated data is calculated using 1-second bins in cleaned event files. If a bin has >2000 counts, and if more than 50% of those come from <1% of pixels, then it is considered to be noise-dominated and hence unusable.
| Quadrant | # 1 sec bins | Bins with >0 counts | Bins with >2000 counts | High rate bins dominated by noise | Noise dominated (total time) | Noise dominated (detector-on time) | Marked lightcurve |
|---|---|---|---|---|---|---|---|
| A | 7837 | 7766 | 491 | 491 | 6.27% | 6.32% | 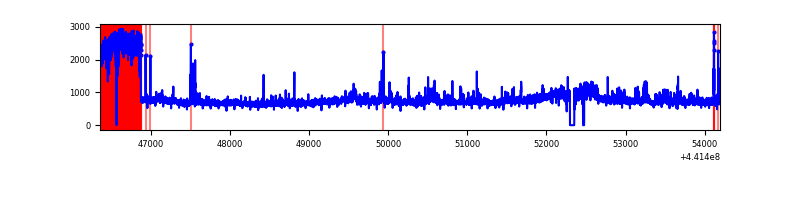 |
| B | 7837 | 7767 | 72 | 72 | 0.92% | 0.93% | 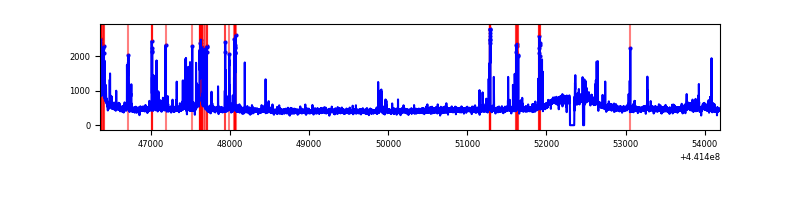 |
| C | 7835 | 7765 | 23 | 23 | 0.29% | 0.30% | 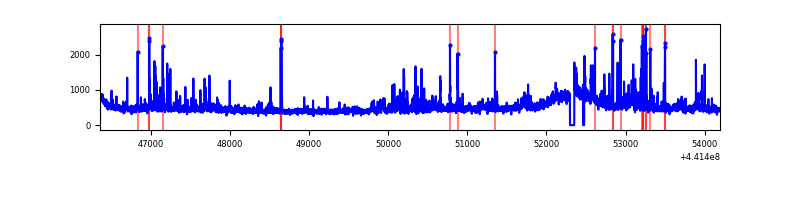 |
| D | 7836 | 7767 | 749 | 749 | 9.56% | 9.64% | 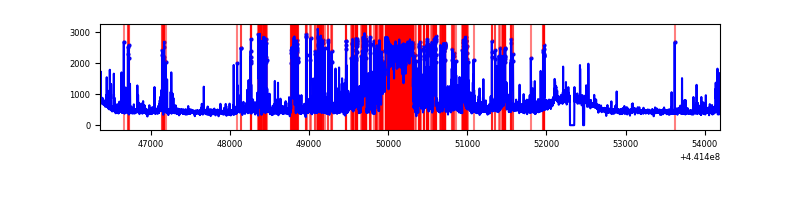 |
Top three noisy pixels from each quadrant. If the there are fewer than three noisy pixels in the level2.evt file, extra rows are filled as -1
| Pixel properties | Quadrant properties | ||||||
|---|---|---|---|---|---|---|---|
| Quadrant | DetID | PixID | Counts | Sigma | Mean | Median | Sigma |
| A | 10 | 83 | 1832991 | 9943.58 | 877 | 856 | 184.3 |
| A | 15 | 223 | 1465268 | 7947.83 | 877 | 856 | 184.3 |
| A | 13 | 248 | 83302 | 447.46 | 877 | 856 | 184.3 |
| B | 5 | 172 | 516555 | 2824.62 | 905 | 874 | 182.6 |
| B | 0 | 189 | 28746 | 152.67 | 905 | 874 | 182.6 |
| B | 12 | 111 | 23874 | 125.98 | 905 | 874 | 182.6 |
| C | 3 | 233 | 308344 | 1438.77 | 903 | 907 | 213.7 |
| C | 12 | 2 | 111543 | 517.76 | 903 | 907 | 213.7 |
| C | 12 | 249 | 60938 | 280.94 | 903 | 907 | 213.7 |
| D | 13 | 249 | 1840000 | 8426.72 | 866 | 838 | 218.3 |
| D | 1 | 52 | 774416 | 3544.4 | 866 | 838 | 218.3 |
| D | 2 | 249 | 89005 | 403.97 | 866 | 838 | 218.3 |
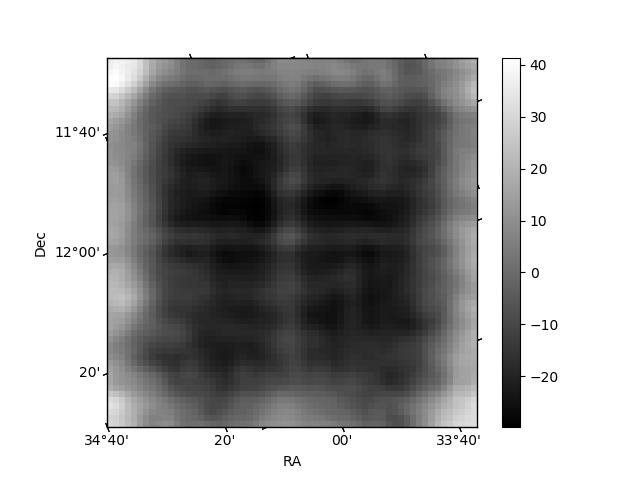
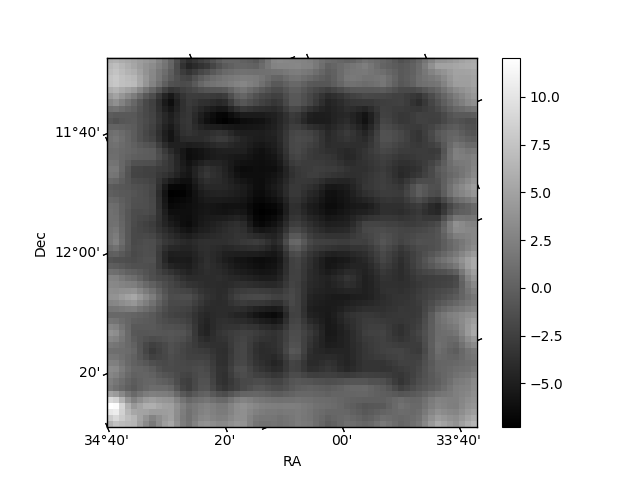
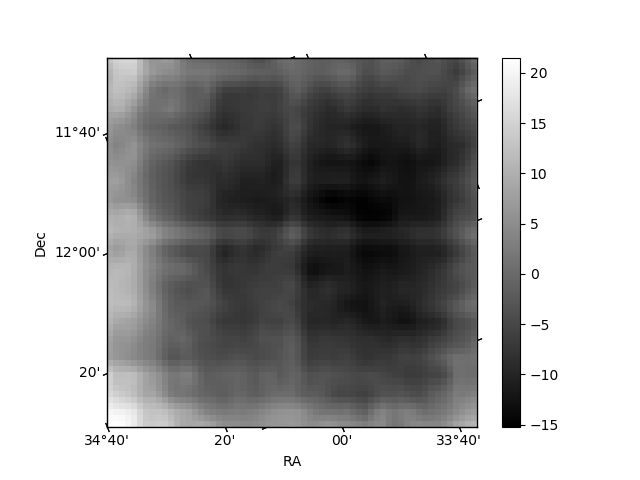
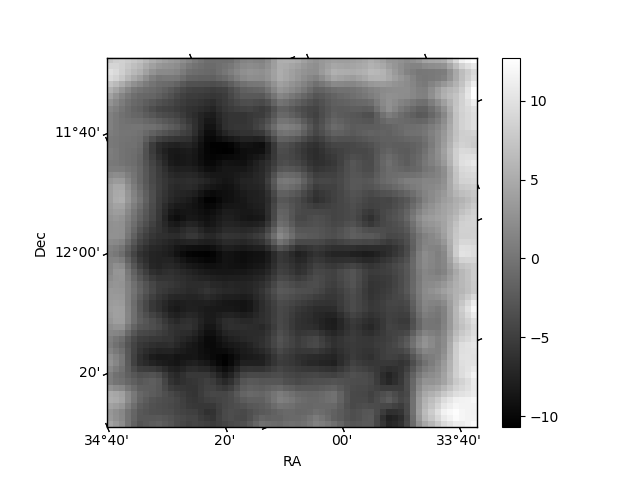
Histogram calculated using DETX and DETY for each event in the final _common_clean file
| Quadrant A | 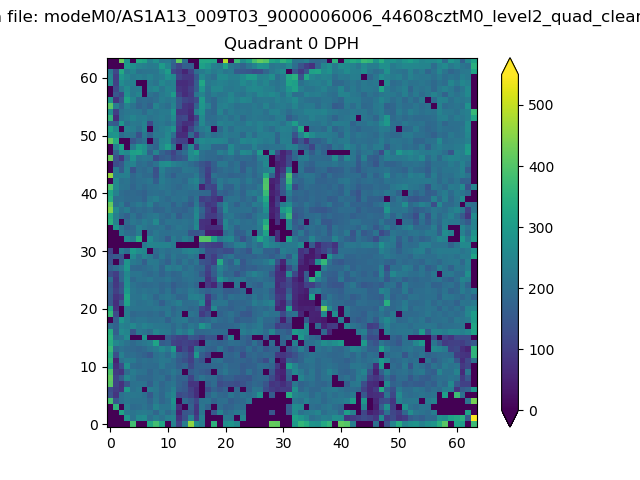 |
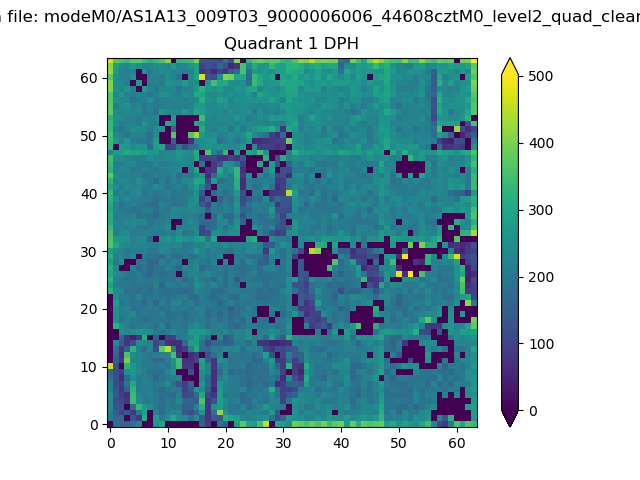 |
Quadrant B |
|---|---|---|---|
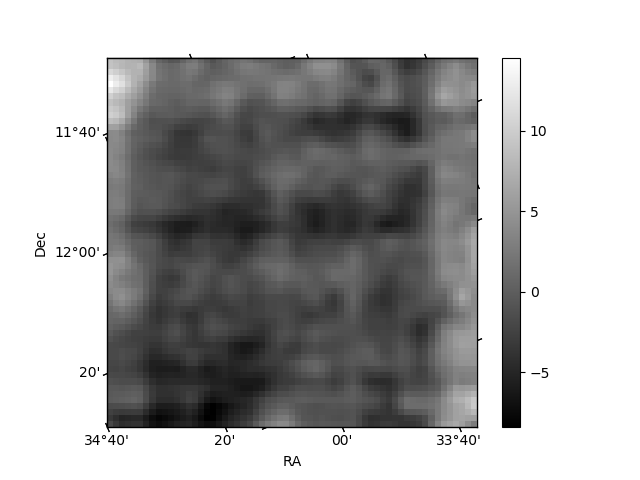
| Quadrant D | 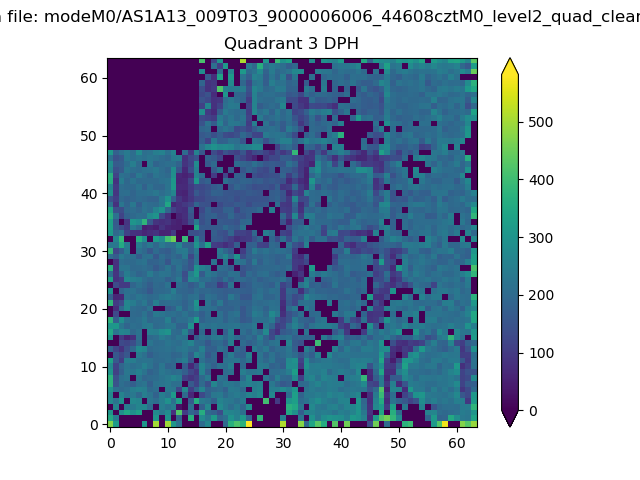 |
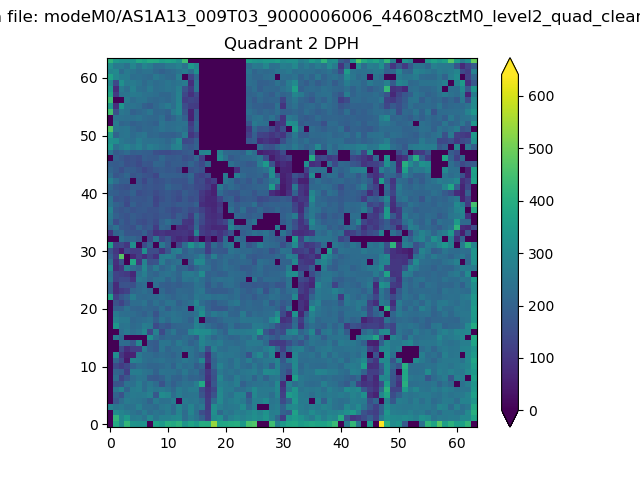 |
Quadrant C |
| Plot type | Count rate plots | Images |
|---|---|---|
| Comparison with Poisson distribution Blue bars denote a histogram of data divided into 1 sec bins. Red curve is a Poisson curve with rate = median count rate of data. |
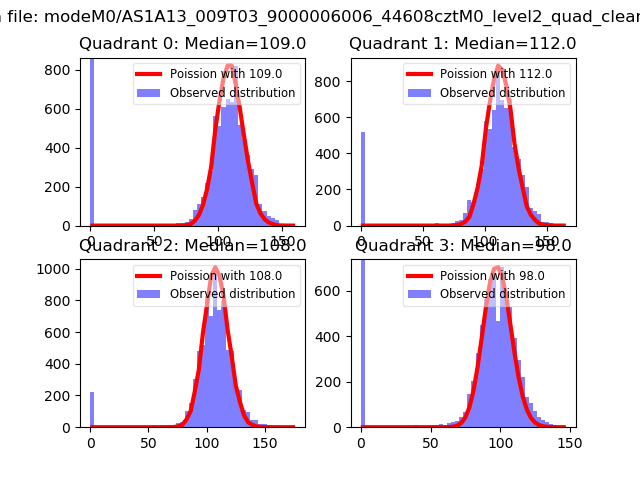 |
 |
| Quadrant-wise count rates Data is divided into 100 sec bins |
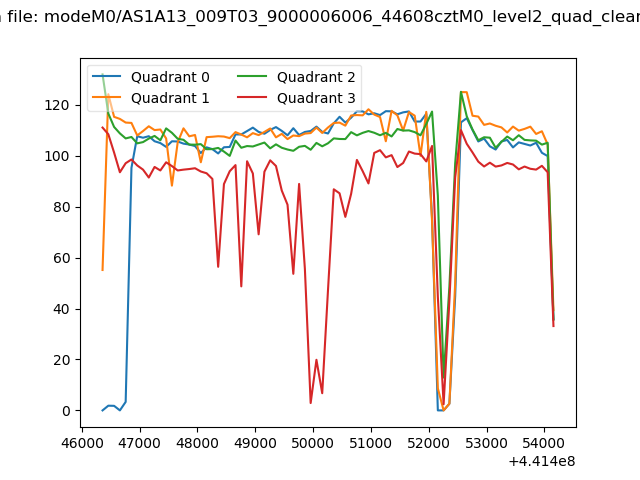 |
|
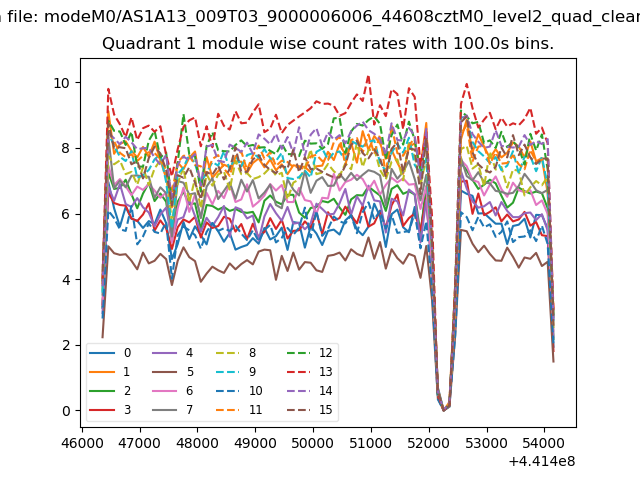
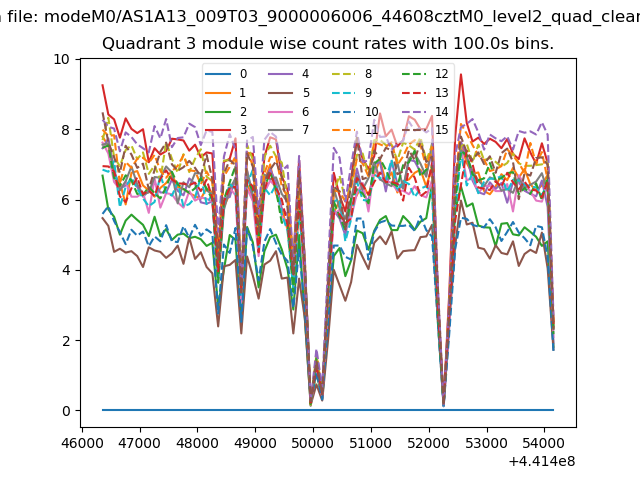
| Module-wise count rates for Quadrant A Data is divided into 100 sec bins |
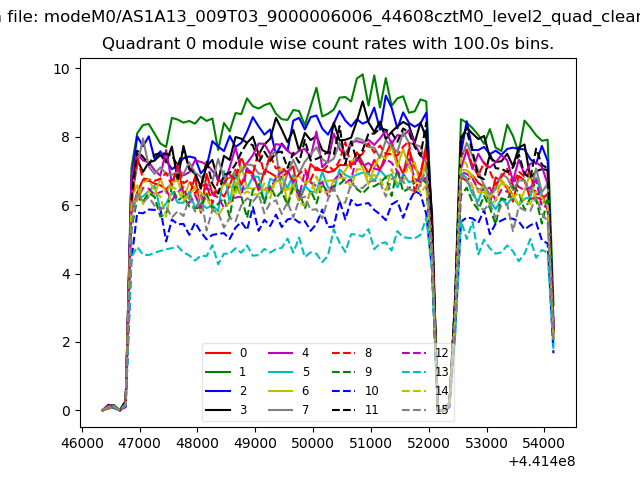 |
 |
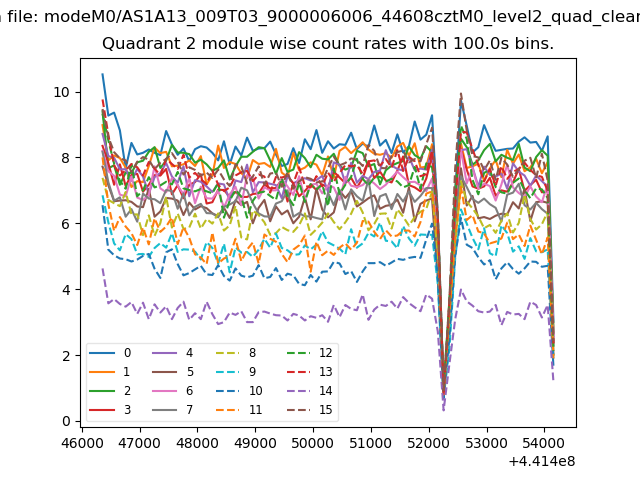
| Module-wise count rates for Quadrant B Data is divided into 100 sec bins |
 |
 |
| Module-wise count rates for Quadrant C Data is divided into 100 sec bins |
 |
 |
| Module-wise count rates for Quadrant D Data is divided into 100 sec bins |
 |
 |
| Parameter | Plot |
|---|---|
| CZT HV Monitor | 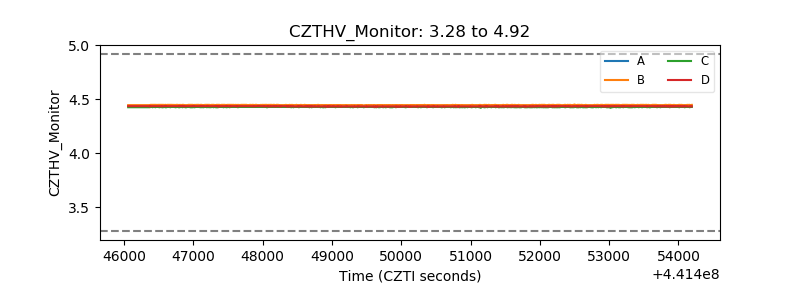 |
| D_VDD | 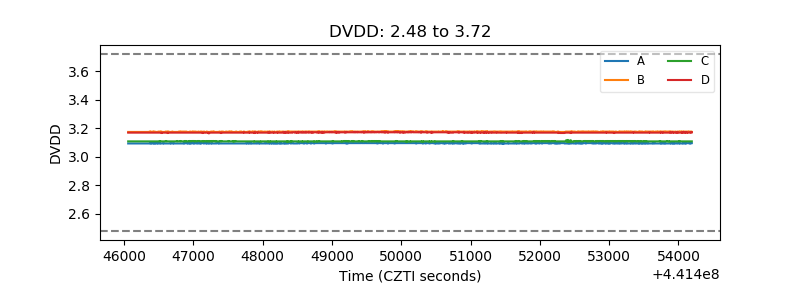 |
| Temperature 1 | 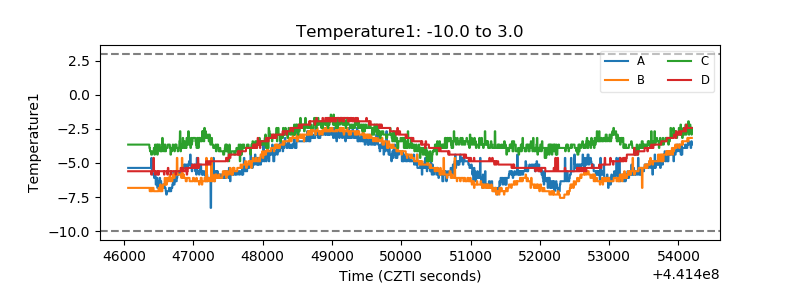 |
| Veto HV Monitor | 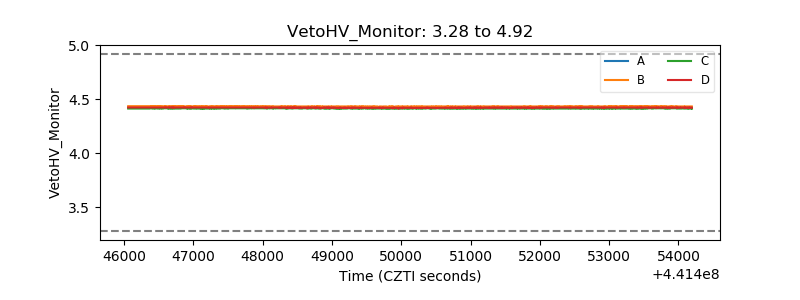 |
| Veto LLD | 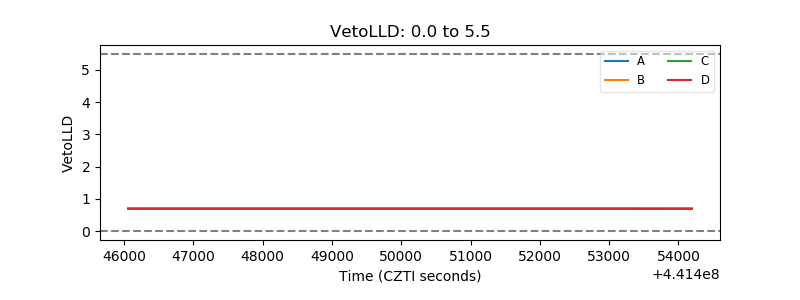 |
| Alpha Counter |  |
| _CPM_Rate | 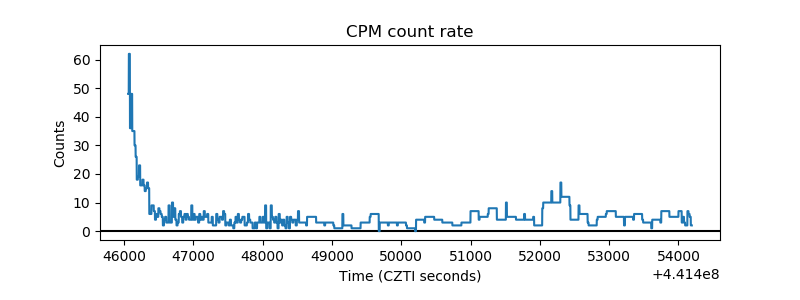 |
| CZT Counter | 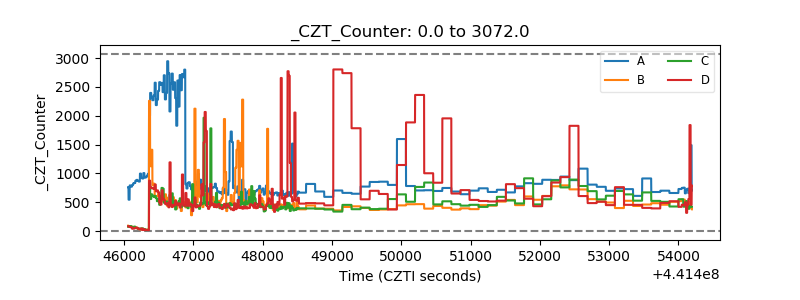 |
| +2.5 Volts monitor | 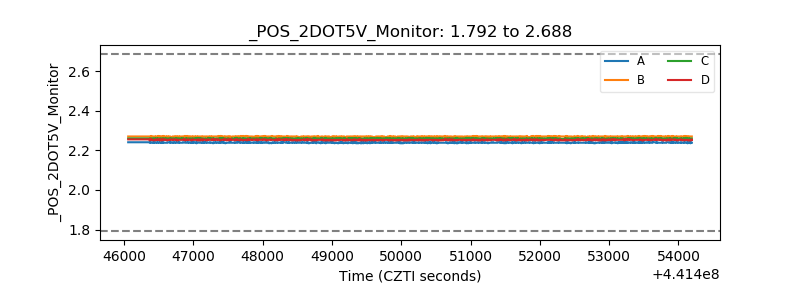 |
| +5 Volts monitor | 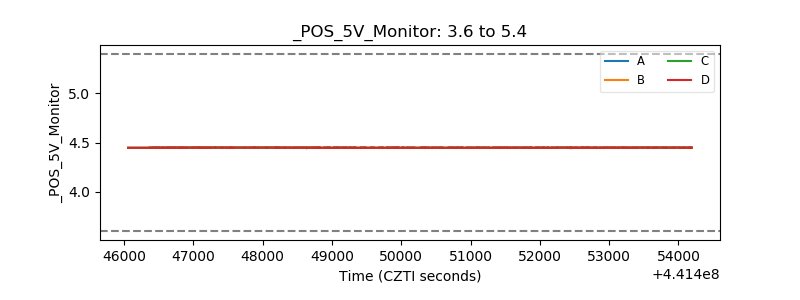 |
| _ROLL_ROT | 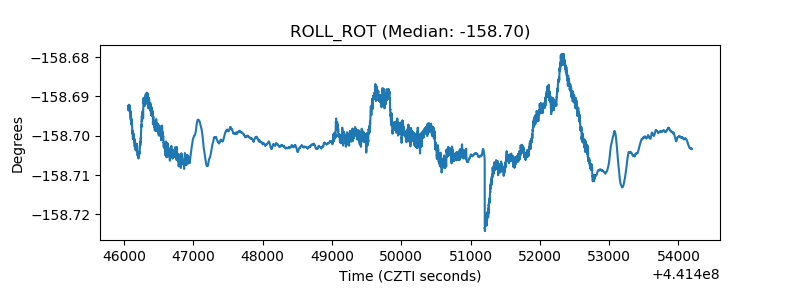 |
| _Roll_DEC | 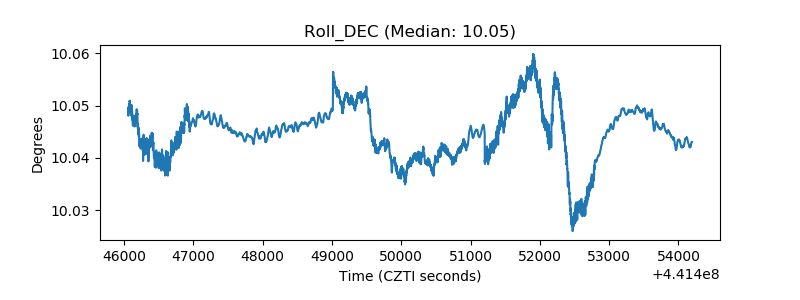 |
| _Roll_RA | 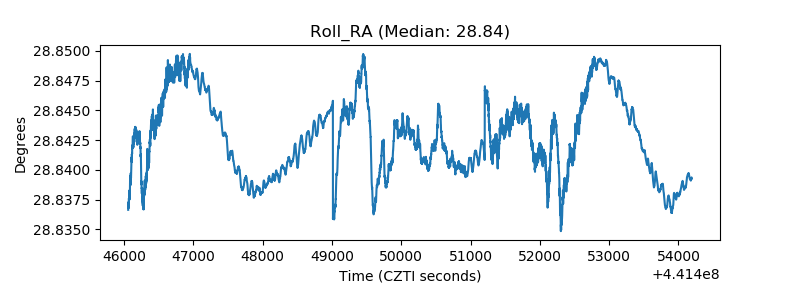 |
| Veto Counter | 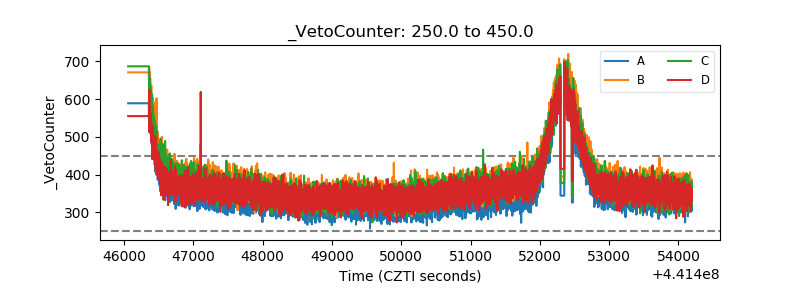 |