| Param | Original file | Final file |
|---|---|---|
| Filename | modeM0/AS1A13_009T03_9000006006_44609cztM0_level2.fits | modeM0/AS1A13_009T03_9000006006_44609cztM0_level2_quad_clean.evt |
| Size (bytes) | 547,223,040 | 129,104,640 |
| Size | 521.9 MB | 123.1 MB |
| Events in quadrant A | 6,532,504 | 857,282 |
| Events in quadrant B | 3,884,259 | 885,306 |
| Events in quadrant C | 4,007,924 | 845,423 |
| Events in quadrant D | 5,214,401 | 767,686 |
| Mode SS | |||
|---|---|---|---|
| Quadrant | BADHDUFLAG | Total packets | Discarded packets |
| A | 0 | 160 | 0 |
| B | 0 | 160 | 0 |
| C | 0 | 160 | 0 |
| D | 0 | 160 | 0 |
| Mode M0 | |||
|---|---|---|---|
| Quadrant | BADHDUFLAG | Total packets | Discarded packets |
| A | 0 | 25295 | 1 |
| B | 0 | 17090 | 1 |
| C | 0 | 17497 | 1 |
| D | 0 | 20930 | 1 |
| Quadrant | Total seconds | Saturated seconds | Saturation percentage |
|---|---|---|---|
| A | 7959 | 163 | 2.047996% |
| B | 7959 | 114 | 1.432341% |
| C | 7960 | 62 | 0.778894% |
| D | 7959 | 254 | 3.191356% |
Noise dominated data is calculated using 1-second bins in cleaned event files. If a bin has >2000 counts, and if more than 50% of those come from <1% of pixels, then it is considered to be noise-dominated and hence unusable.
| Quadrant | # 1 sec bins | Bins with >0 counts | Bins with >2000 counts | High rate bins dominated by noise | Noise dominated (total time) | Noise dominated (detector-on time) | Marked lightcurve |
|---|---|---|---|---|---|---|---|
| A | 7958 | 7958 | 26 | 26 | 0.33% | 0.33% | 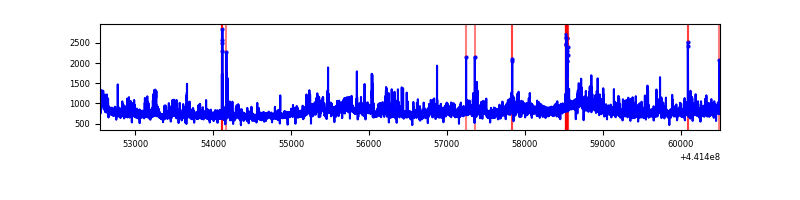 |
| B | 7959 | 7959 | 36 | 36 | 0.45% | 0.45% | 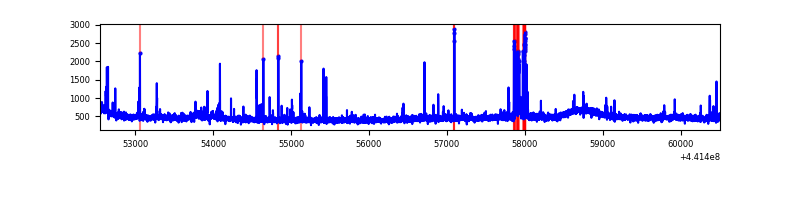 |
| C | 7959 | 7959 | 36 | 36 | 0.45% | 0.45% | 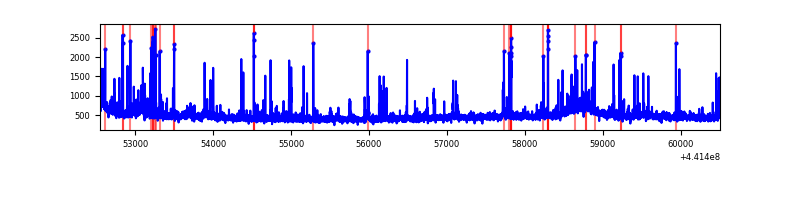 |
| D | 7959 | 7959 | 259 | 259 | 3.25% | 3.25% | 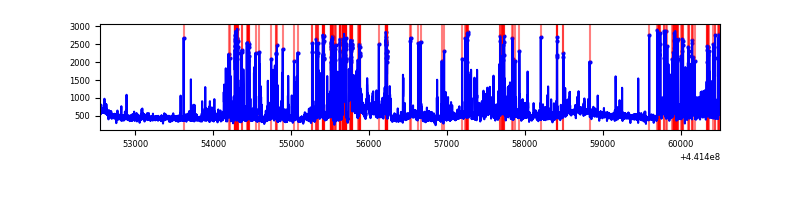 |
Top three noisy pixels from each quadrant. If the there are fewer than three noisy pixels in the level2.evt file, extra rows are filled as -1
| Pixel properties | Quadrant properties | ||||||
|---|---|---|---|---|---|---|---|
| Quadrant | DetID | PixID | Counts | Sigma | Mean | Median | Sigma |
| A | 10 | 83 | 1934140 | 10138.78 | 913 | 893 | 190.7 |
| A | 15 | 223 | 959098 | 5025.24 | 913 | 893 | 190.7 |
| A | 13 | 248 | 52294 | 269.57 | 913 | 893 | 190.7 |
| B | 5 | 172 | 187239 | 1017.95 | 911 | 881 | 183.1 |
| B | 0 | 189 | 40178 | 214.65 | 911 | 881 | 183.1 |
| B | 12 | 111 | 23817 | 125.28 | 911 | 881 | 183.1 |
| C | 3 | 233 | 185603 | 875.92 | 893 | 899 | 210.9 |
| C | 12 | 2 | 166334 | 784.54 | 893 | 899 | 210.9 |
| C | 14 | 254 | 63650 | 297.58 | 893 | 899 | 210.9 |
| D | 13 | 249 | 1173839 | 5214.93 | 889 | 860 | 224.9 |
| D | 1 | 52 | 351429 | 1558.59 | 889 | 860 | 224.9 |
| D | 2 | 249 | 112388 | 495.84 | 889 | 860 | 224.9 |
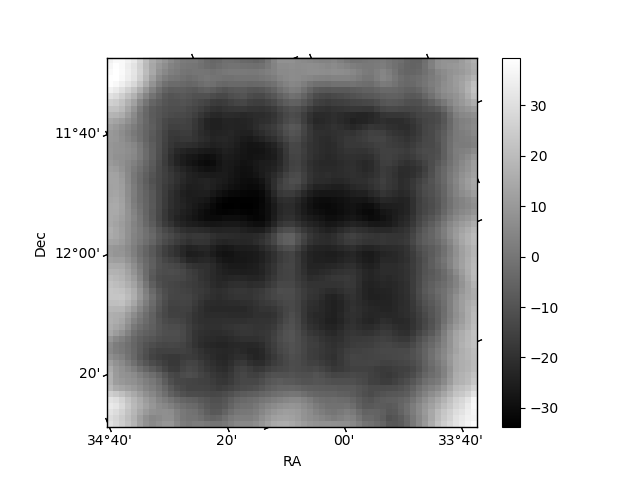
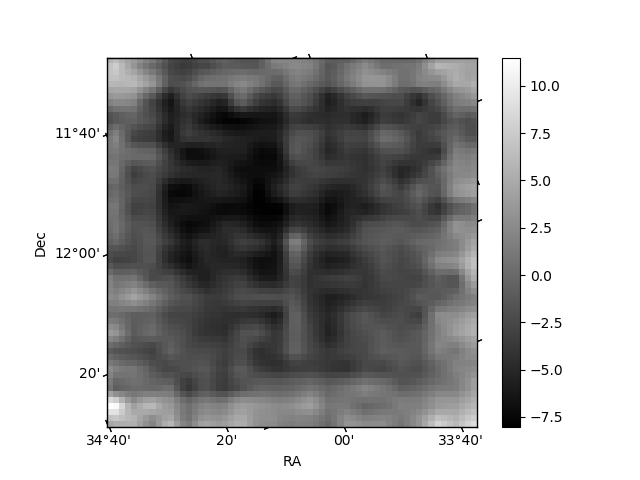
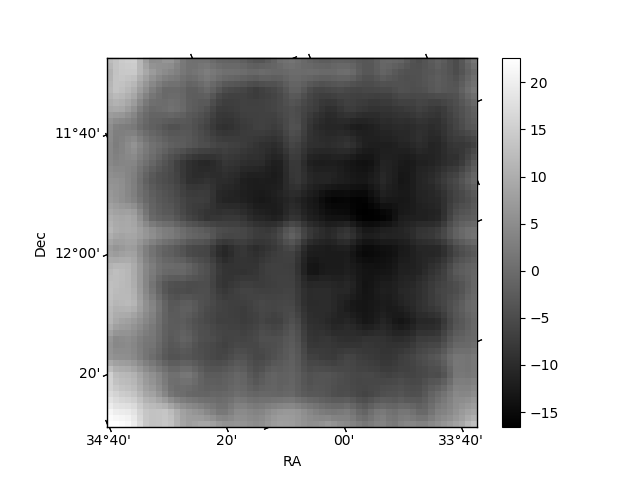
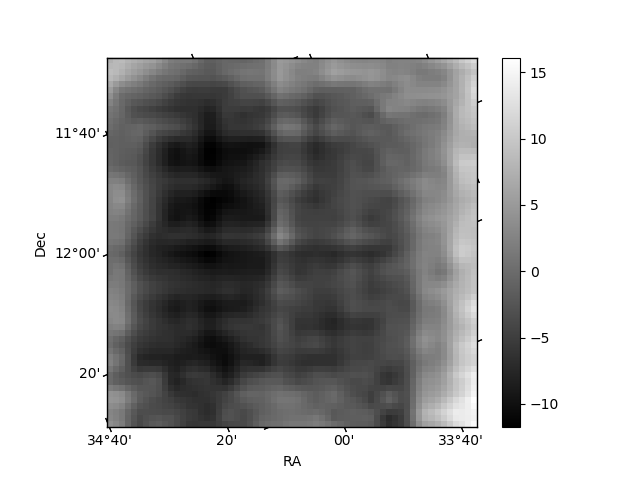
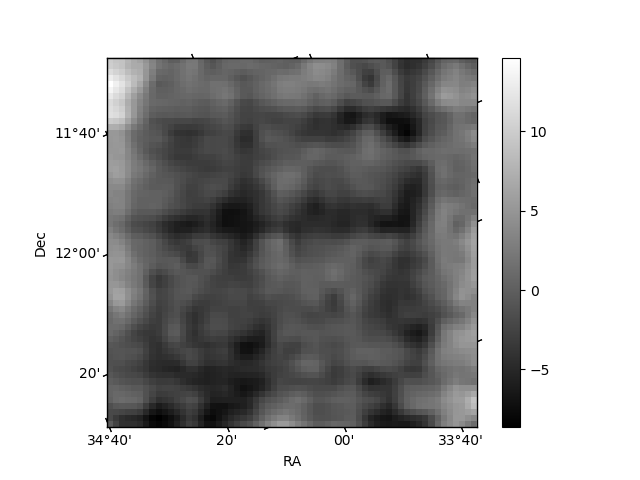
Histogram calculated using DETX and DETY for each event in the final _common_clean file
| Quadrant A | 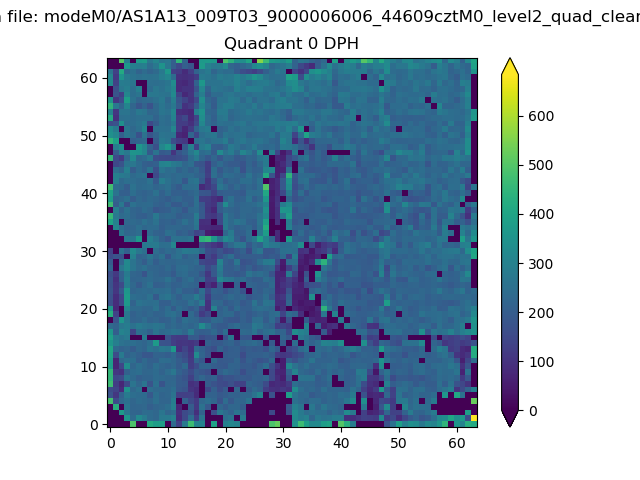 |
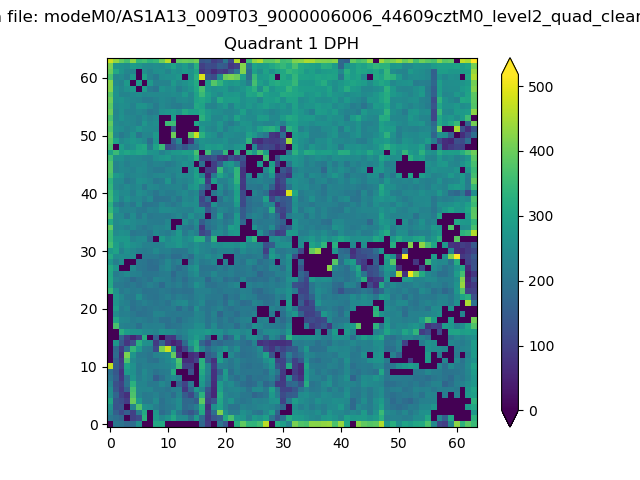 |
Quadrant B |
|---|---|---|---|
| Quadrant D | 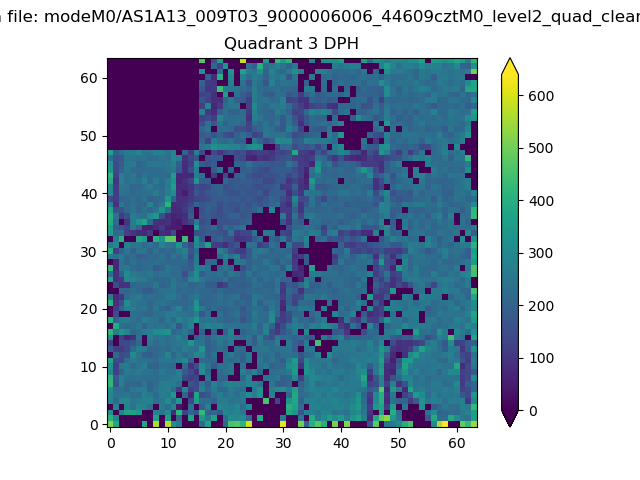 |
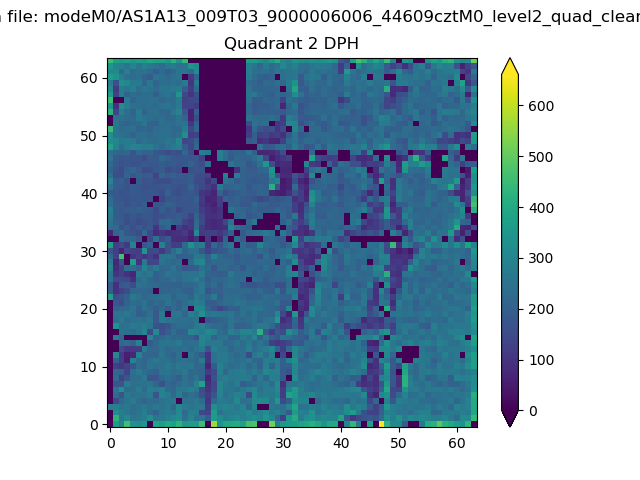 |
Quadrant C |
| Plot type | Count rate plots | Images |
|---|---|---|
| Comparison with Poisson distribution Blue bars denote a histogram of data divided into 1 sec bins. Red curve is a Poisson curve with rate = median count rate of data. |
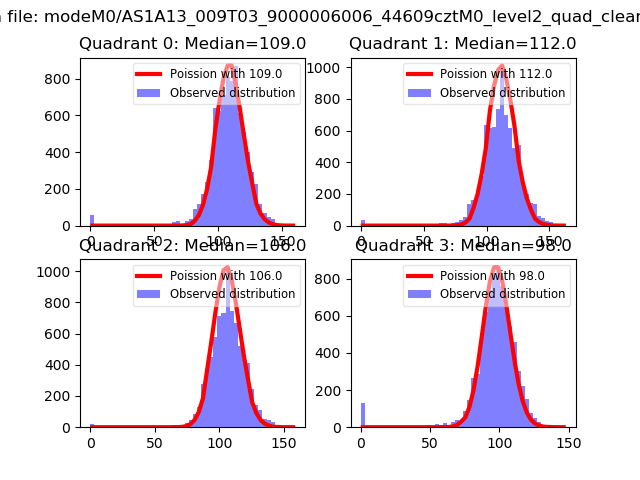 |
 |
| Quadrant-wise count rates Data is divided into 100 sec bins |
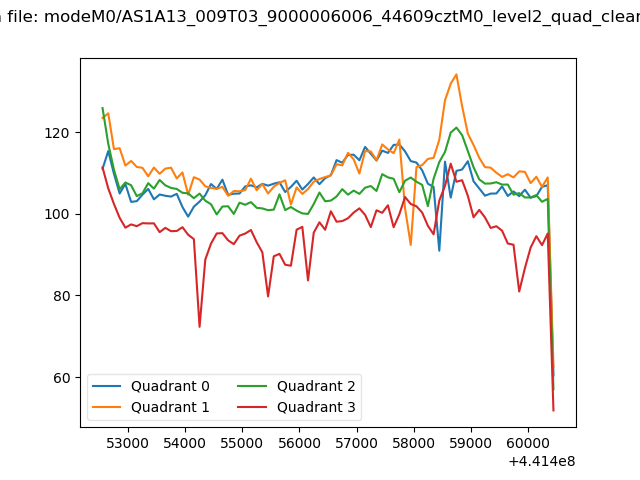 |
|
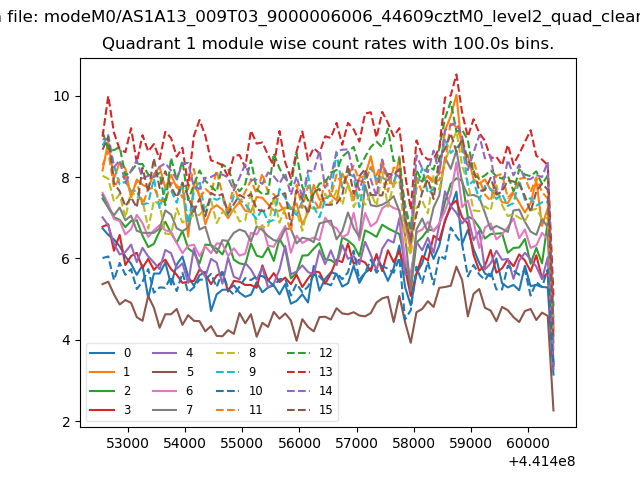
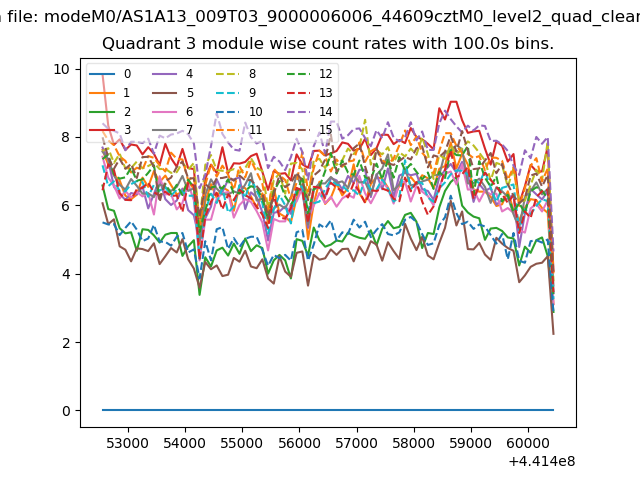
| Module-wise count rates for Quadrant A Data is divided into 100 sec bins |
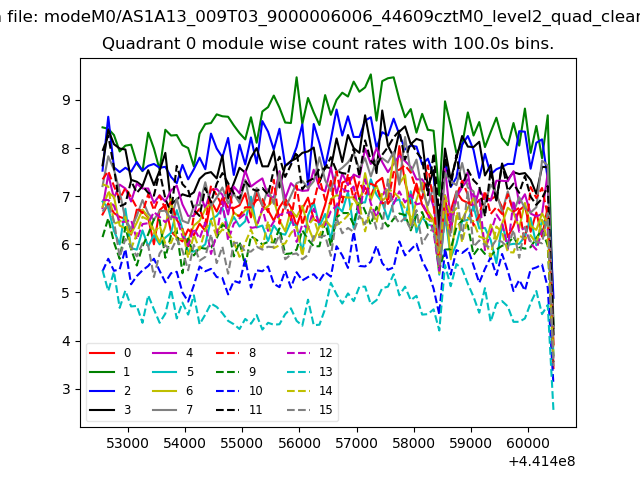 |
 |
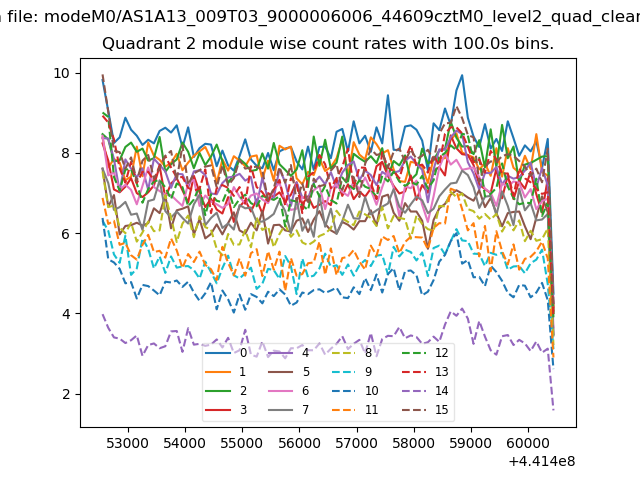
| Module-wise count rates for Quadrant B Data is divided into 100 sec bins |
 |
 |
| Module-wise count rates for Quadrant C Data is divided into 100 sec bins |
 |
 |
| Module-wise count rates for Quadrant D Data is divided into 100 sec bins |
 |
 |
| Parameter | Plot |
|---|---|
| CZT HV Monitor | 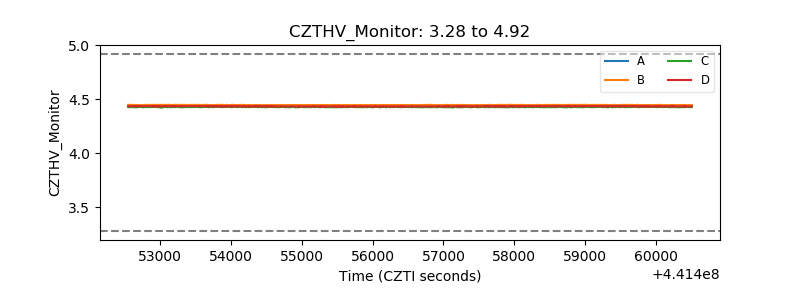 |
| D_VDD | 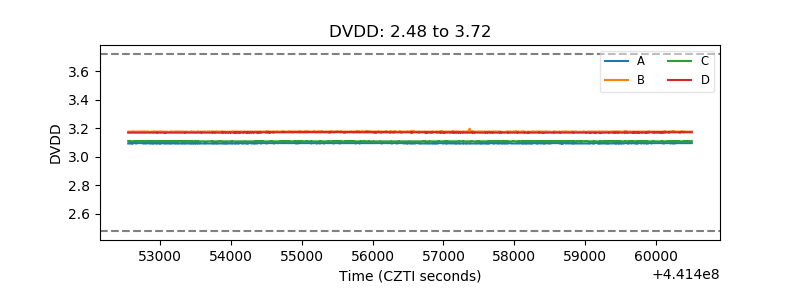 |
| Temperature 1 | 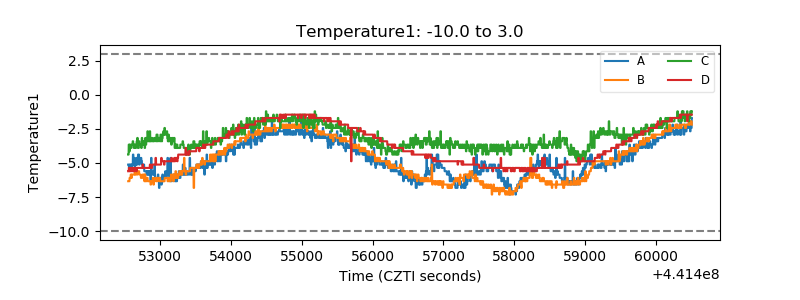 |
| Veto HV Monitor |  |
| Veto LLD | 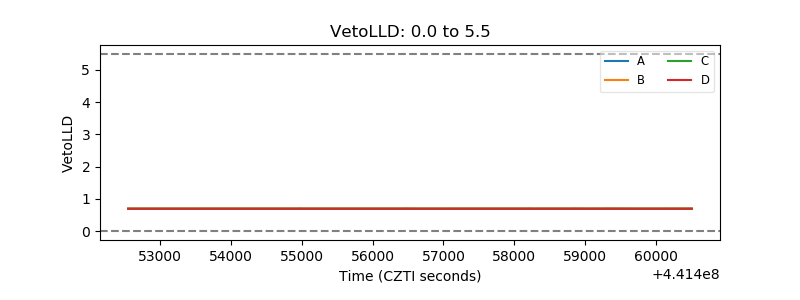 |
| Alpha Counter | 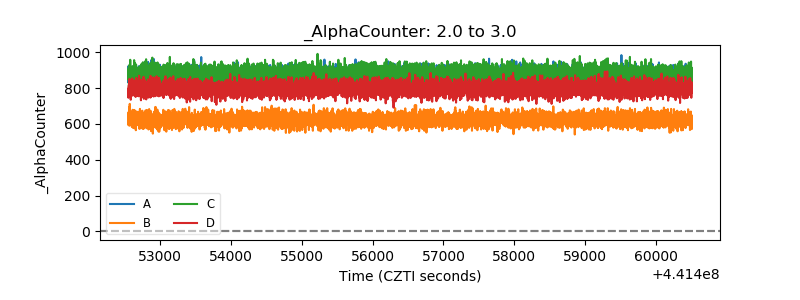 |
| _CPM_Rate | 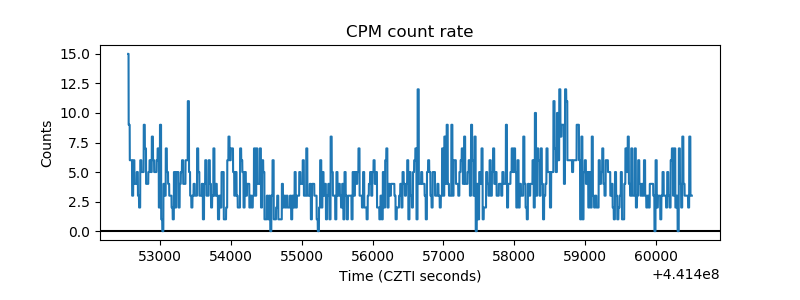 |
| CZT Counter | 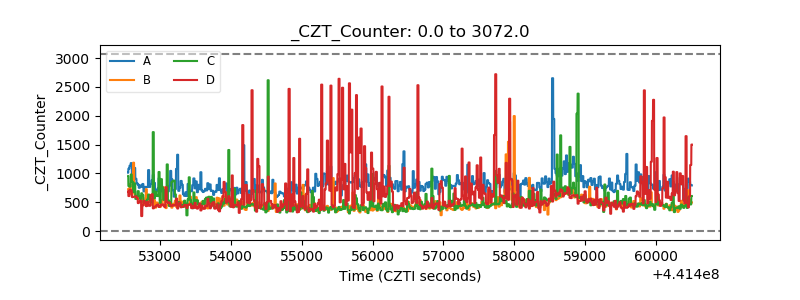 |
| +2.5 Volts monitor | 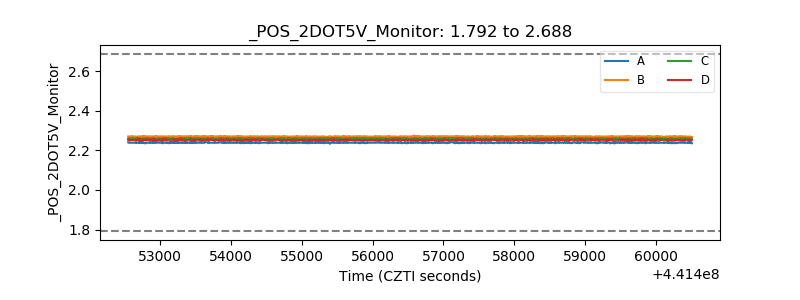 |
| +5 Volts monitor | 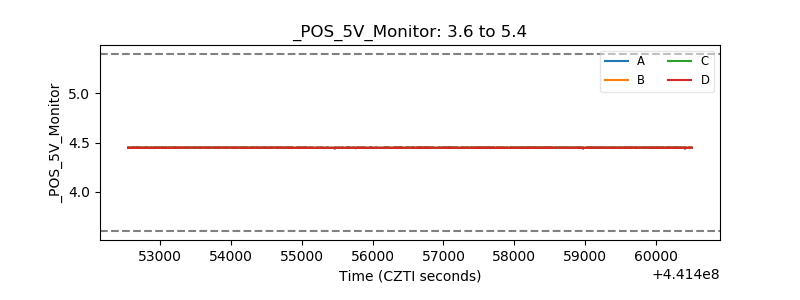 |
| _ROLL_ROT | 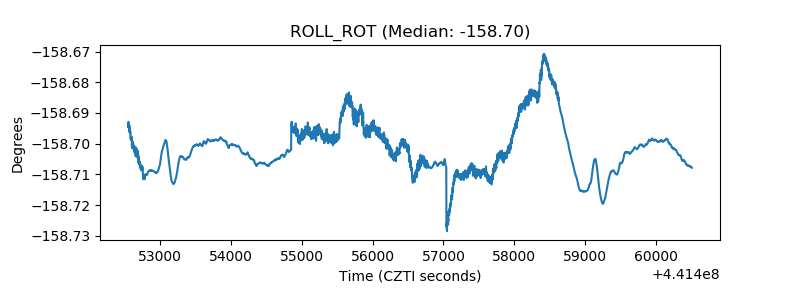 |
| _Roll_DEC | 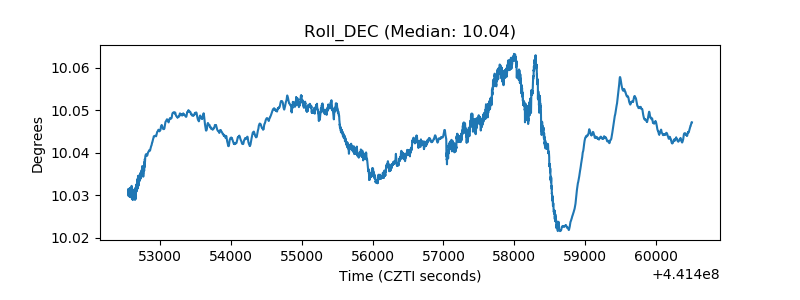 |
| _Roll_RA | 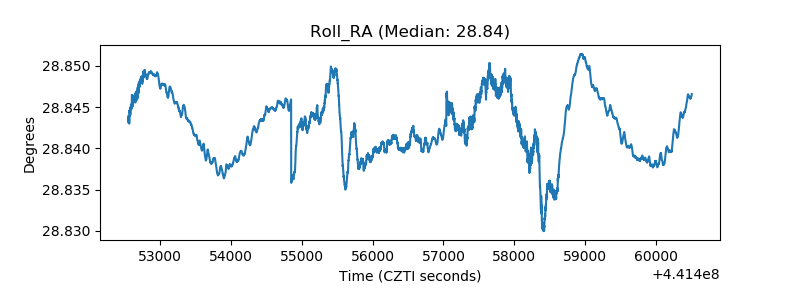 |
| Veto Counter | 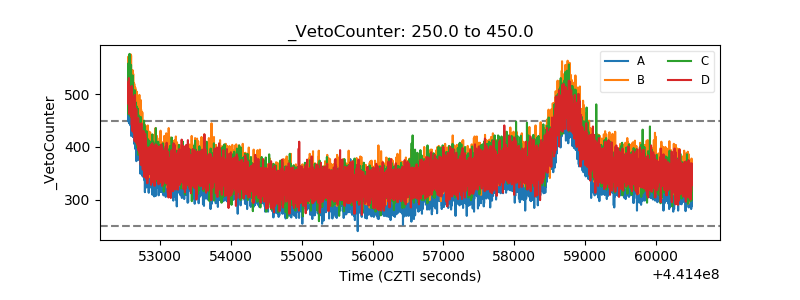 |