| Param | Original file | Final file |
|---|---|---|
| Filename | modeM0/AS1A13_009T03_9000006006_44610cztM0_level2.fits | modeM0/AS1A13_009T03_9000006006_44610cztM0_level2_quad_clean.evt |
| Size (bytes) | 510,900,480 | 113,875,200 |
| Size | 487.2 MB | 108.6 MB |
| Events in quadrant A | 5,958,726 | 767,680 |
| Events in quadrant B | 3,414,839 | 782,316 |
| Events in quadrant C | 3,748,521 | 735,266 |
| Events in quadrant D | 5,239,811 | 669,399 |
| Mode SS | |||
|---|---|---|---|
| Quadrant | BADHDUFLAG | Total packets | Discarded packets |
| A | 0 | 140 | 0 |
| B | 0 | 140 | 0 |
| C | 0 | 140 | 0 |
| D | 0 | 140 | 0 |
| Mode M0 | |||
|---|---|---|---|
| Quadrant | BADHDUFLAG | Total packets | Discarded packets |
| A | 0 | 22813 | 0 |
| B | 0 | 15164 | 0 |
| C | 0 | 16111 | 0 |
| D | 0 | 20435 | 0 |
| Quadrant | Total seconds | Saturated seconds | Saturation percentage |
|---|---|---|---|
| A | 7085 | 145 | 2.046577% |
| B | 7086 | 85 | 1.199548% |
| C | 7086 | 163 | 2.300310% |
| D | 7086 | 386 | 5.447361% |
Noise dominated data is calculated using 1-second bins in cleaned event files. If a bin has >2000 counts, and if more than 50% of those come from <1% of pixels, then it is considered to be noise-dominated and hence unusable.
| Quadrant | # 1 sec bins | Bins with >0 counts | Bins with >2000 counts | High rate bins dominated by noise | Noise dominated (total time) | Noise dominated (detector-on time) | Marked lightcurve |
|---|---|---|---|---|---|---|---|
| A | 7084 | 7084 | 65 | 65 | 0.92% | 0.92% | 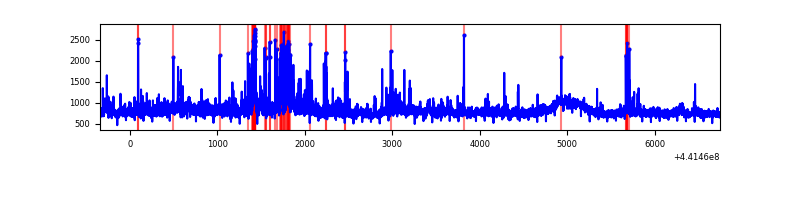 |
| B | 7085 | 7085 | 17 | 17 | 0.24% | 0.24% | 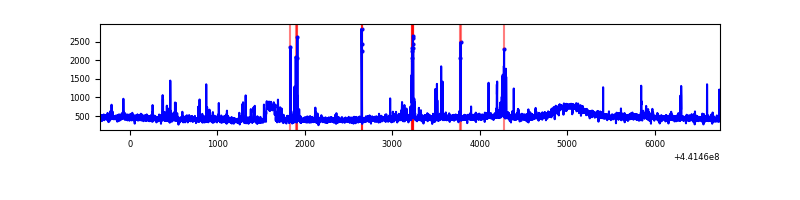 |
| C | 7085 | 7085 | 95 | 95 | 1.34% | 1.34% | 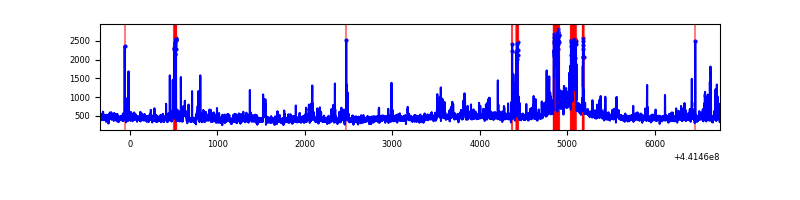 |
| D | 7085 | 7085 | 376 | 376 | 5.31% | 5.31% | 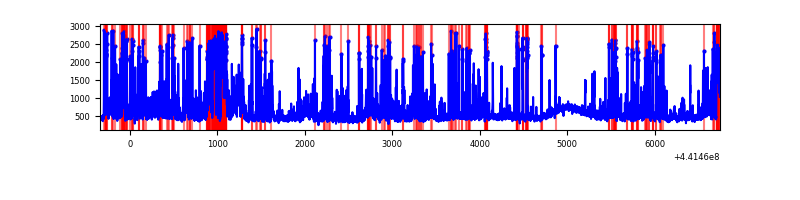 |
Top three noisy pixels from each quadrant. If the there are fewer than three noisy pixels in the level2.evt file, extra rows are filled as -1
| Pixel properties | Quadrant properties | ||||||
|---|---|---|---|---|---|---|---|
| Quadrant | DetID | PixID | Counts | Sigma | Mean | Median | Sigma |
| A | 10 | 83 | 1766037 | 10386.87 | 810 | 793 | 169.9 |
| A | 15 | 223 | 885354 | 5204.84 | 810 | 793 | 169.9 |
| A | 13 | 248 | 159411 | 933.32 | 810 | 793 | 169.9 |
| B | 5 | 172 | 93916 | 573.66 | 804 | 778 | 162.4 |
| B | 12 | 0 | 47171 | 285.75 | 804 | 778 | 162.4 |
| B | 0 | 186 | 29521 | 177.04 | 804 | 778 | 162.4 |
| C | 3 | 233 | 292314 | 1573.84 | 780 | 785 | 185.2 |
| C | 1 | 3 | 197897 | 1064.12 | 780 | 785 | 185.2 |
| C | 12 | 2 | 111377 | 597.04 | 780 | 785 | 185.2 |
| D | 13 | 249 | 899071 | 4527.69 | 780 | 754 | 198.4 |
| D | 1 | 52 | 617474 | 3108.39 | 780 | 754 | 198.4 |
| D | 12 | 233 | 172153 | 863.88 | 780 | 754 | 198.4 |
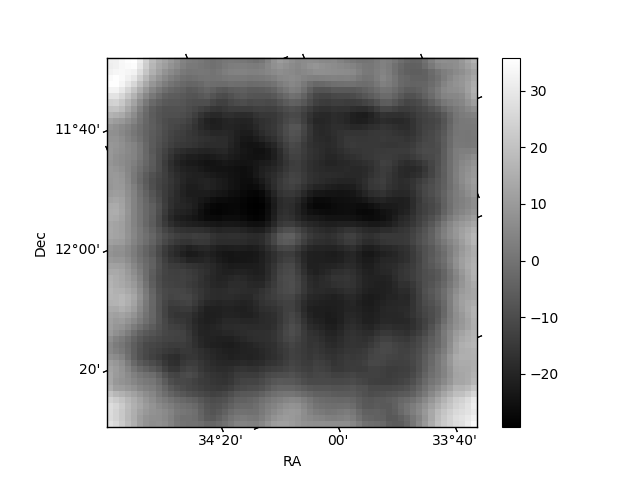
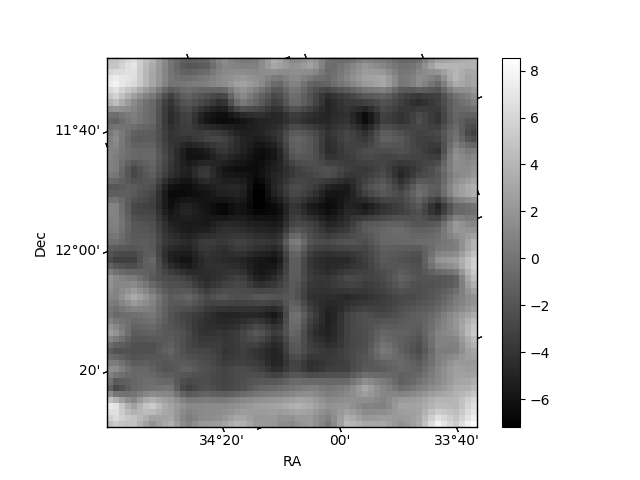
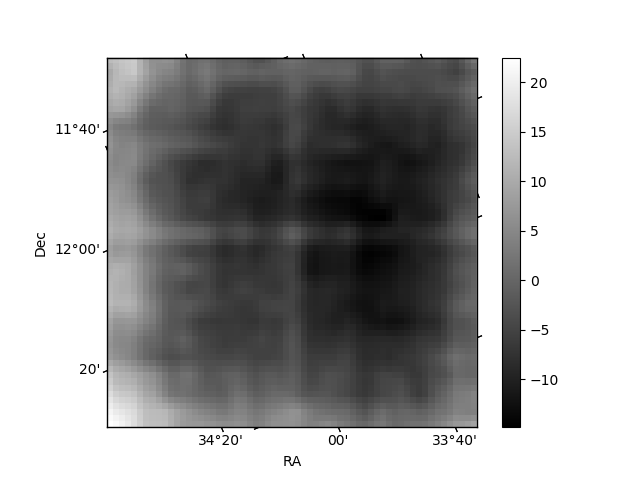
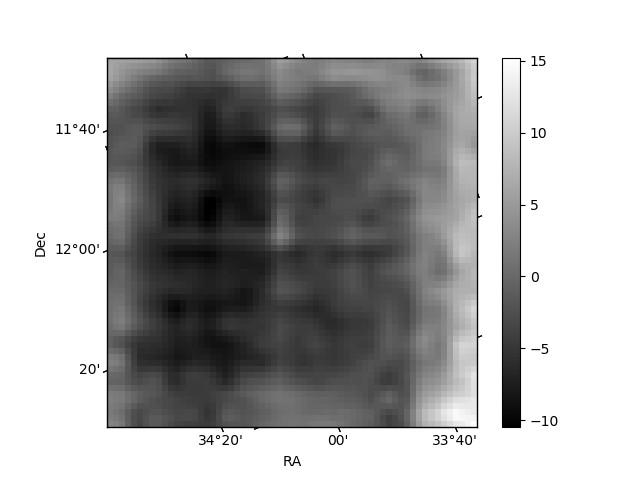
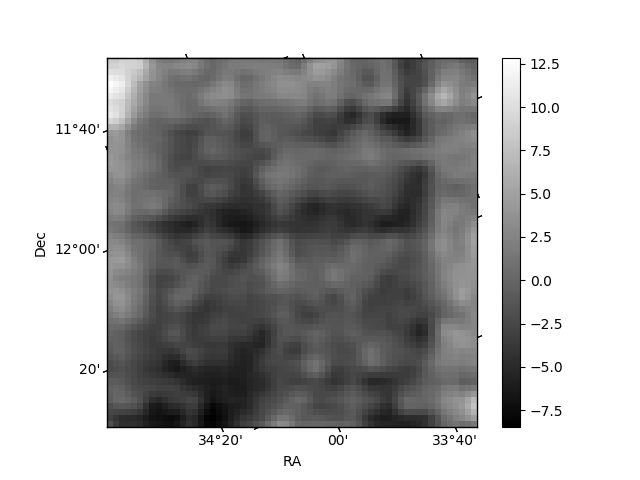
Histogram calculated using DETX and DETY for each event in the final _common_clean file
| Quadrant A | 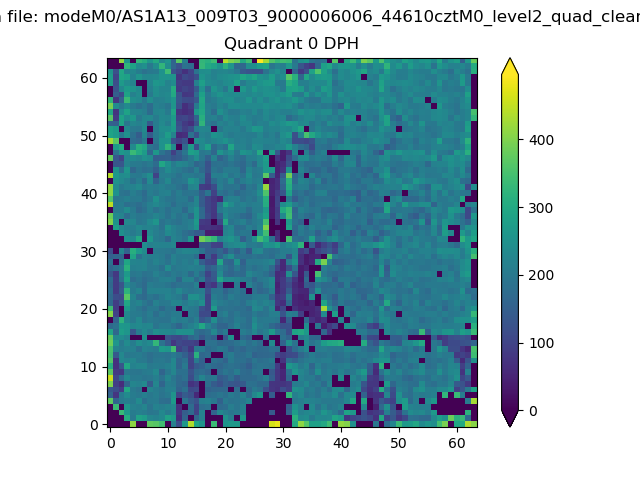 |
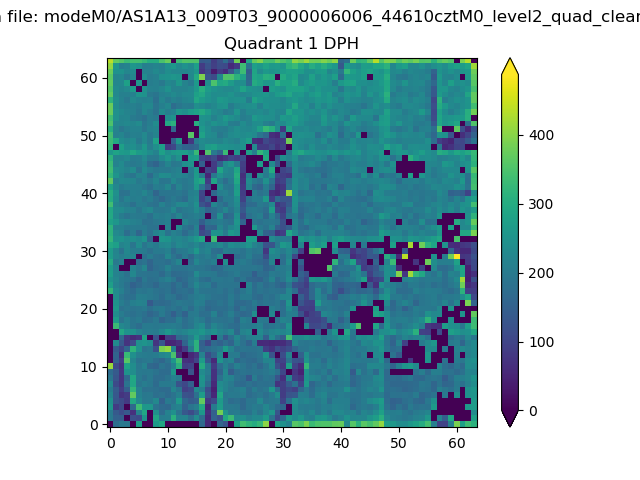 |
Quadrant B |
|---|---|---|---|
| Quadrant D | 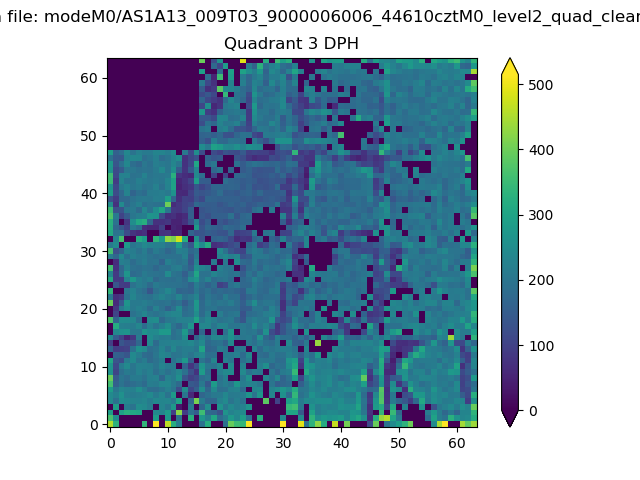 |
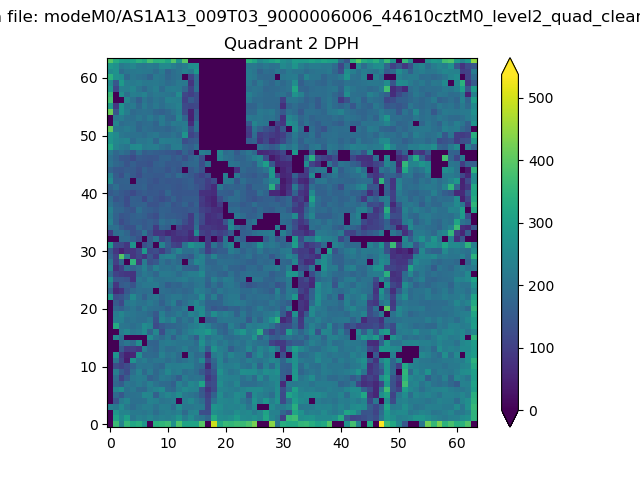 |
Quadrant C |
| Plot type | Count rate plots | Images |
|---|---|---|
| Comparison with Poisson distribution Blue bars denote a histogram of data divided into 1 sec bins. Red curve is a Poisson curve with rate = median count rate of data. |
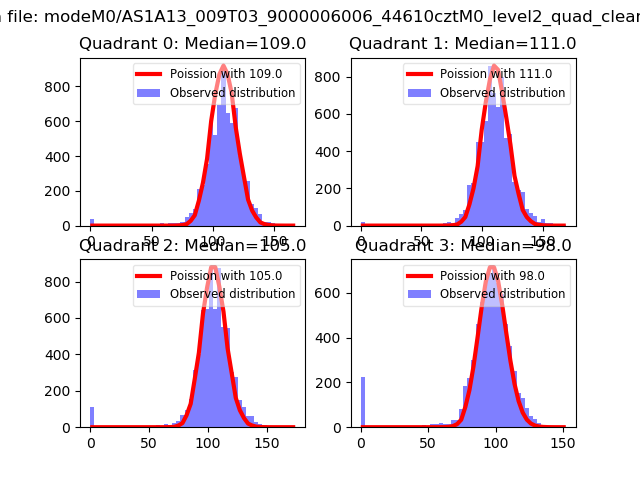 |
 |
| Quadrant-wise count rates Data is divided into 100 sec bins |
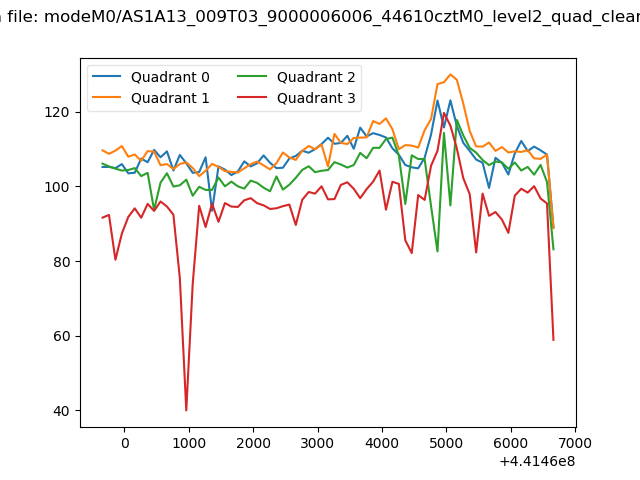 |
|
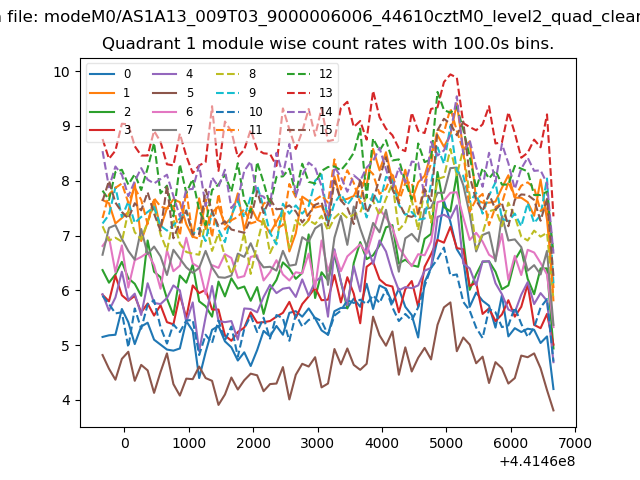
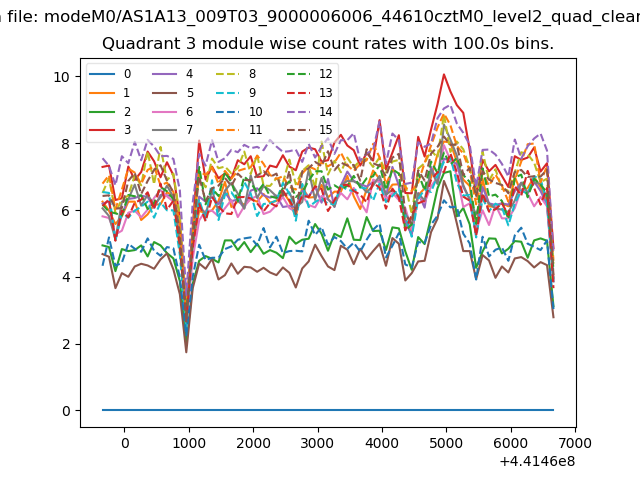
| Module-wise count rates for Quadrant A Data is divided into 100 sec bins |
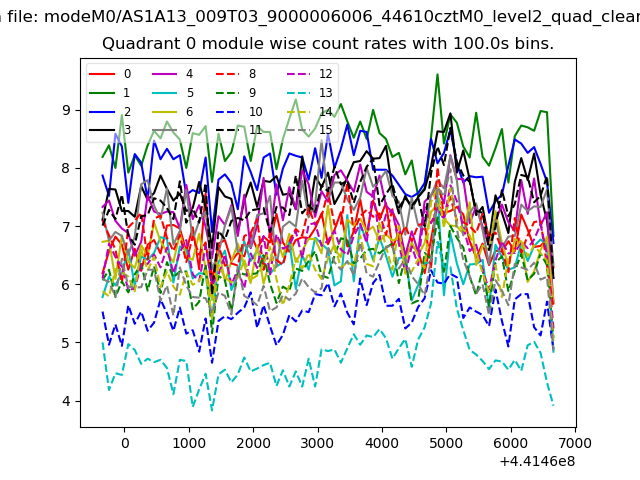 |
 |
| Module-wise count rates for Quadrant B Data is divided into 100 sec bins |
 |
 |
| Module-wise count rates for Quadrant C Data is divided into 100 sec bins |
 |
 |
| Module-wise count rates for Quadrant D Data is divided into 100 sec bins |
 |
 |
| Parameter | Plot |
|---|---|
| CZT HV Monitor | 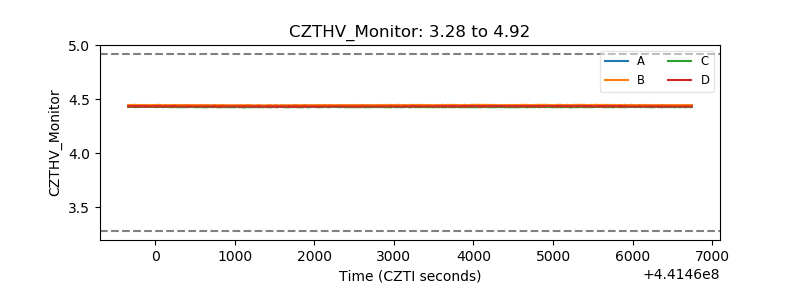 |
| D_VDD | 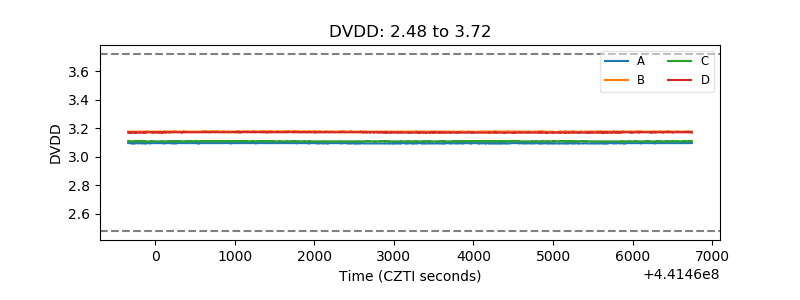 |
| Temperature 1 | 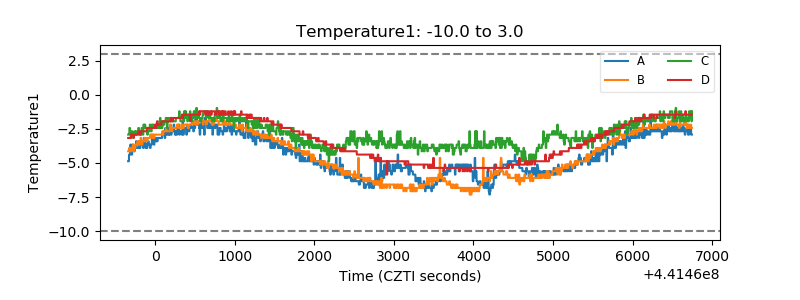 |
| Veto HV Monitor | 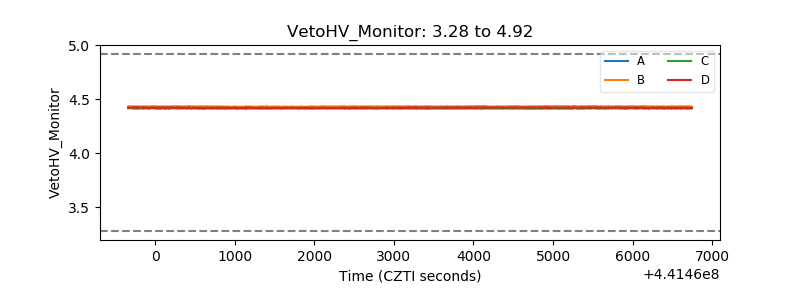 |
| Veto LLD | 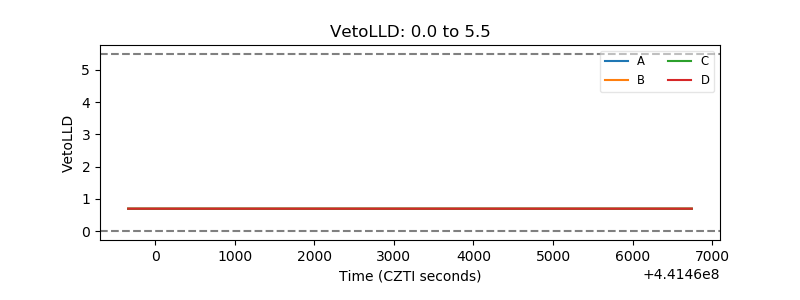 |
| Alpha Counter | 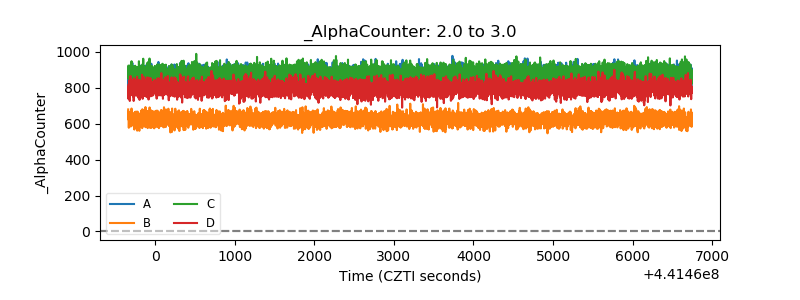 |
| _CPM_Rate | 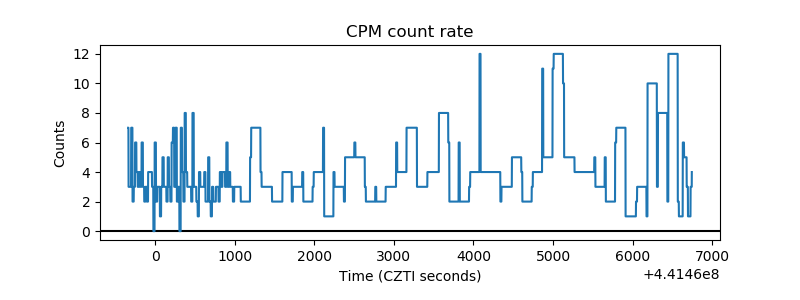 |
| CZT Counter | 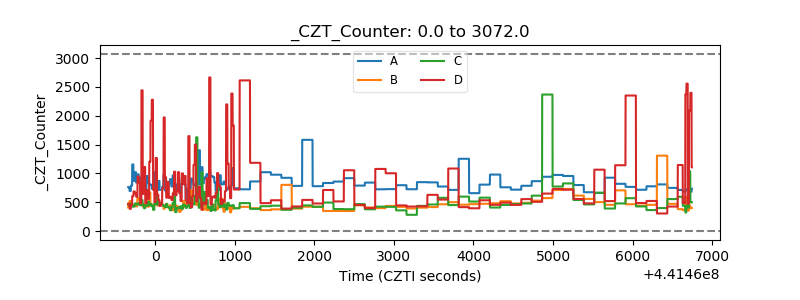 |
| +2.5 Volts monitor | 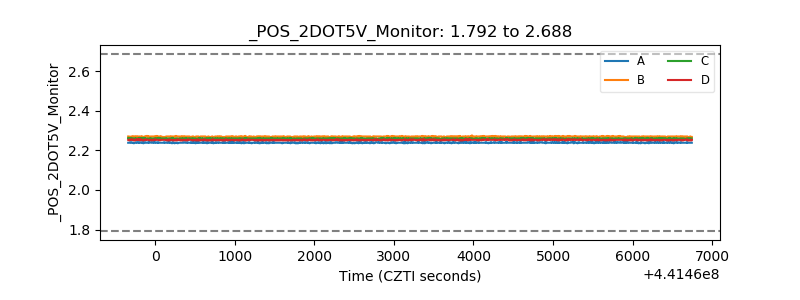 |
| +5 Volts monitor | 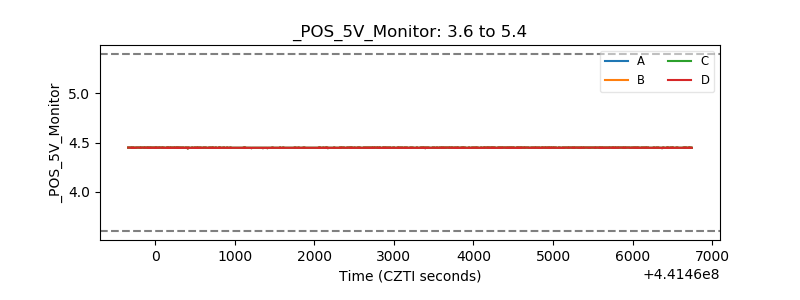 |
| _ROLL_ROT | 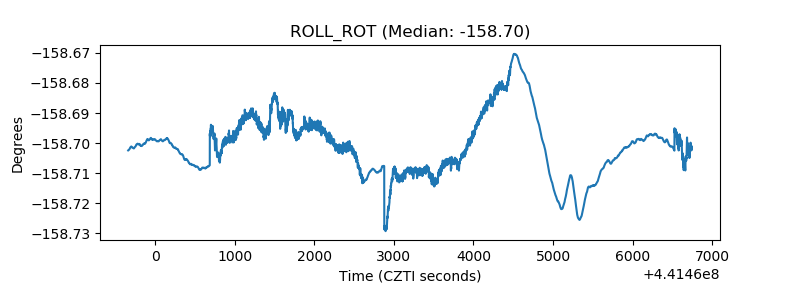 |
| _Roll_DEC | 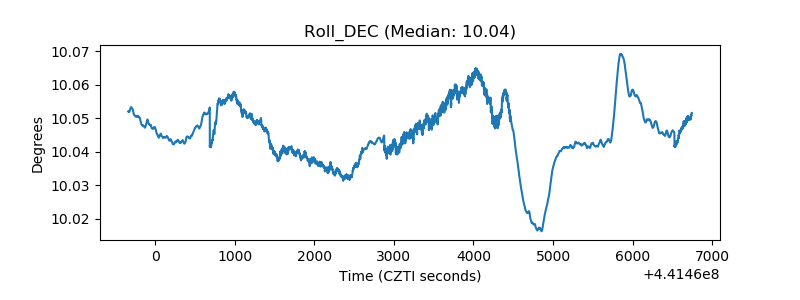 |
| _Roll_RA | 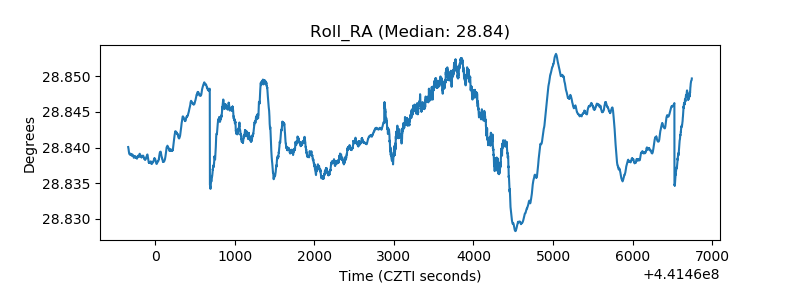 |
| Veto Counter | 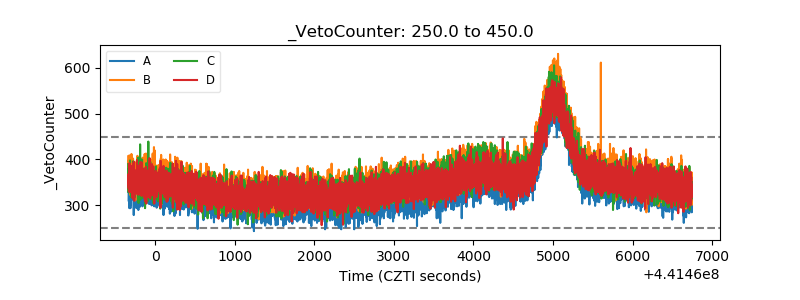 |