| Param | Original file | Final file |
|---|---|---|
| Filename | modeM0/AS1A13_009T03_9000006006_44614cztM0_level2.fits | modeM0/AS1A13_009T03_9000006006_44614cztM0_level2_quad_clean.evt |
| Size (bytes) | 698,878,080 | 148,688,640 |
| Size | 666.5 MB | 141.8 MB |
| Events in quadrant A | 7,153,956 | 1,011,870 |
| Events in quadrant B | 4,996,502 | 1,014,430 |
| Events in quadrant C | 4,667,672 | 988,157 |
| Events in quadrant D | 8,320,068 | 832,954 |
| Mode SS | |||
|---|---|---|---|
| Quadrant | BADHDUFLAG | Total packets | Discarded packets |
| A | 0 | 190 | 0 |
| B | 0 | 190 | 0 |
| C | 0 | 190 | 0 |
| D | 0 | 190 | 0 |
| Mode M9 | |||
|---|---|---|---|
| Quadrant | BADHDUFLAG | Total packets | Discarded packets |
| A | 0 | 17 | 0 |
| B | 0 | 17 | 0 |
| C | 0 | 17 | 0 |
| D | 0 | 17 | 0 |
| Mode M0 | |||
|---|---|---|---|
| Quadrant | BADHDUFLAG | Total packets | Discarded packets |
| A | 0 | 29167 | 2 |
| B | 0 | 21461 | 2 |
| C | 0 | 20573 | 2 |
| D | 0 | 31187 | 3 |
| Quadrant | Total seconds | Saturated seconds | Saturation percentage |
|---|---|---|---|
| A | 9444 | 213 | 2.255400% |
| B | 9445 | 345 | 3.652726% |
| C | 9445 | 97 | 1.026998% |
| D | 9444 | 1087 | 11.509953% |
Noise dominated data is calculated using 1-second bins in cleaned event files. If a bin has >2000 counts, and if more than 50% of those come from <1% of pixels, then it is considered to be noise-dominated and hence unusable.
| Quadrant | # 1 sec bins | Bins with >0 counts | Bins with >2000 counts | High rate bins dominated by noise | Noise dominated (total time) | Noise dominated (detector-on time) | Marked lightcurve |
|---|---|---|---|---|---|---|---|
| A | 11059 | 9446 | 32 | 32 | 0.29% | 0.34% | 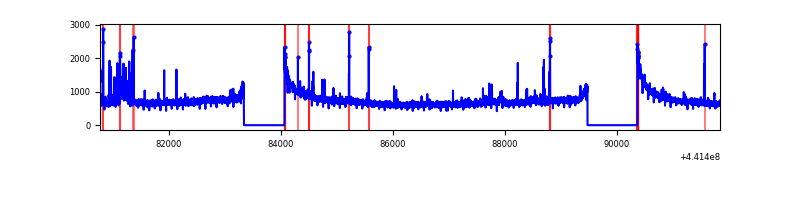 |
| B | 11060 | 9445 | 111 | 111 | 1.00% | 1.18% | 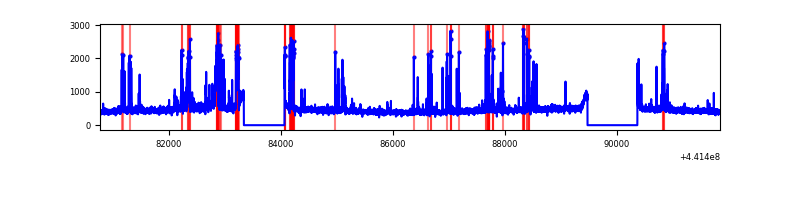 |
| C | 11060 | 9445 | 42 | 42 | 0.38% | 0.44% | 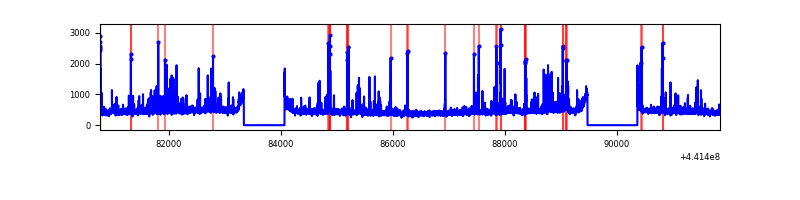 |
| D | 11059 | 9444 | 998 | 998 | 9.02% | 10.57% | 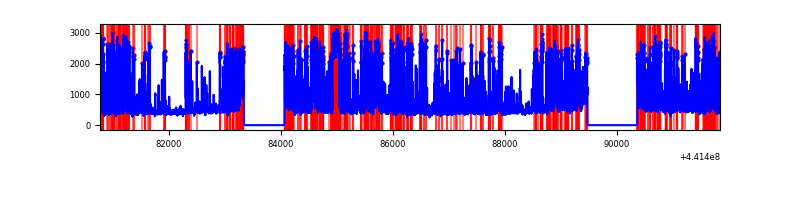 |
Top three noisy pixels from each quadrant. If the there are fewer than three noisy pixels in the level2.evt file, extra rows are filled as -1
| Pixel properties | Quadrant properties | ||||||
|---|---|---|---|---|---|---|---|
| Quadrant | DetID | PixID | Counts | Sigma | Mean | Median | Sigma |
| A | 10 | 83 | 2664639 | 11965.39 | 1068 | 1045 | 222.6 |
| A | 15 | 223 | 194860 | 870.65 | 1068 | 1045 | 222.6 |
| A | 13 | 248 | 70675 | 312.79 | 1068 | 1045 | 222.6 |
| B | 5 | 172 | 595480 | 2843.32 | 1057 | 1025 | 209.1 |
| B | 15 | 36 | 116932 | 554.39 | 1057 | 1025 | 209.1 |
| B | 0 | 186 | 53598 | 251.46 | 1057 | 1025 | 209.1 |
| C | 12 | 2 | 236793 | 953.13 | 1045 | 1053 | 247.3 |
| C | 14 | 254 | 174808 | 702.52 | 1045 | 1053 | 247.3 |
| C | 12 | 249 | 95327 | 381.16 | 1045 | 1053 | 247.3 |
| D | 13 | 249 | 2061723 | 8176.47 | 996 | 965 | 252.0 |
| D | 1 | 52 | 1816955 | 7205.3 | 996 | 965 | 252.0 |
| D | 13 | 153 | 264441 | 1045.39 | 996 | 965 | 252.0 |
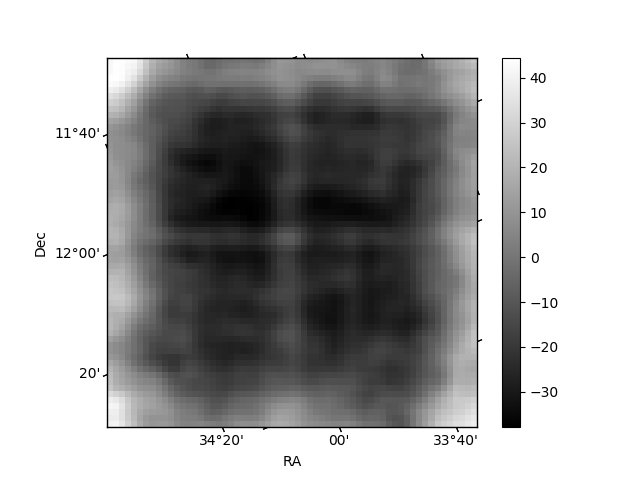
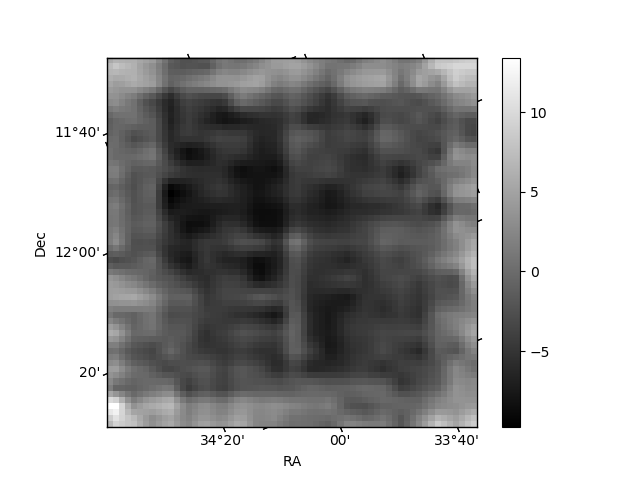
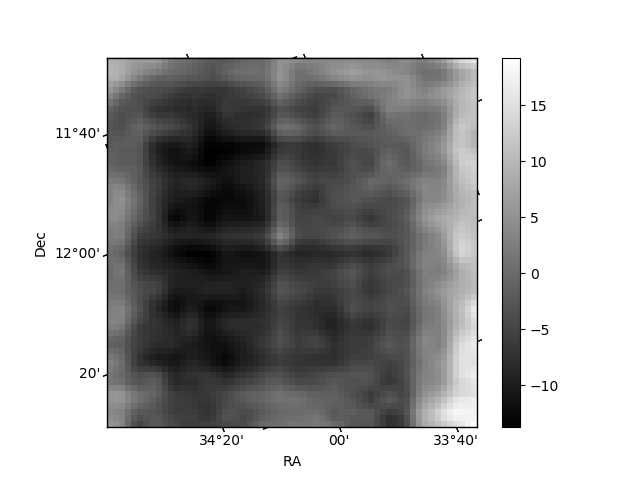
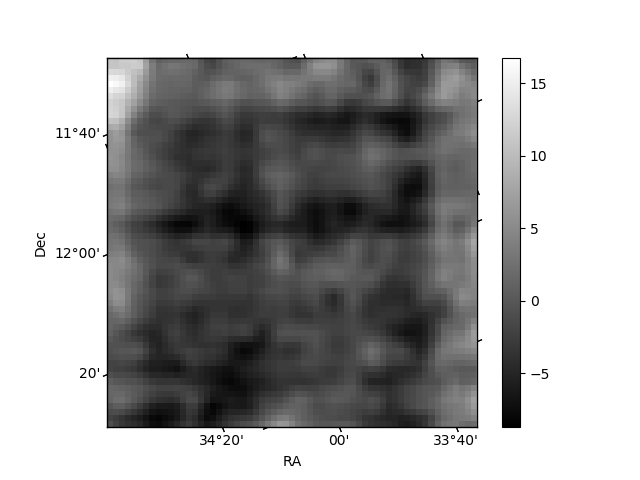
Histogram calculated using DETX and DETY for each event in the final _common_clean file
| Quadrant A | 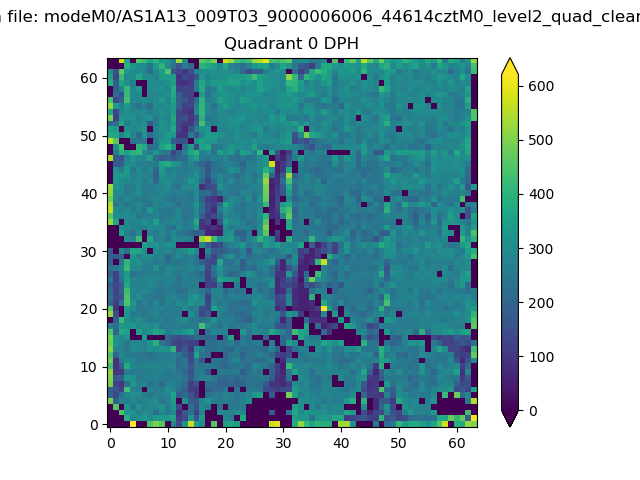 |
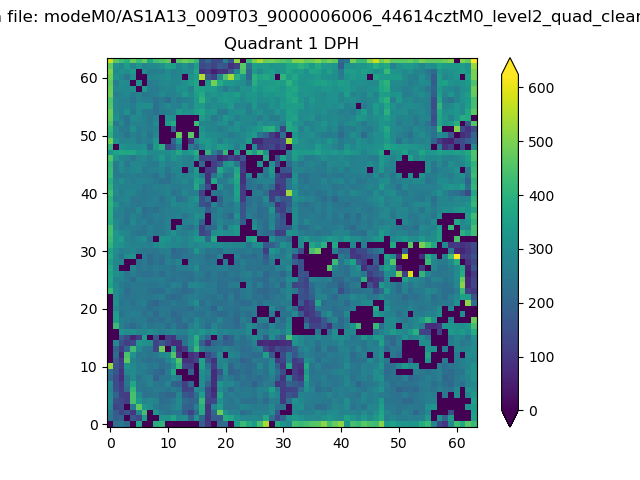 |
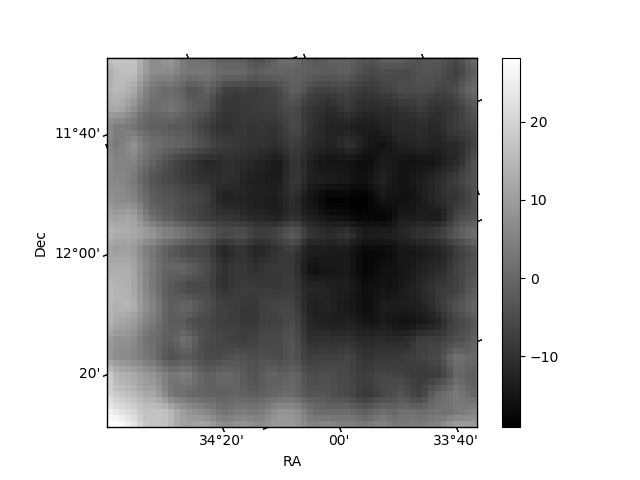
Quadrant B |
|---|---|---|---|
| Quadrant D | 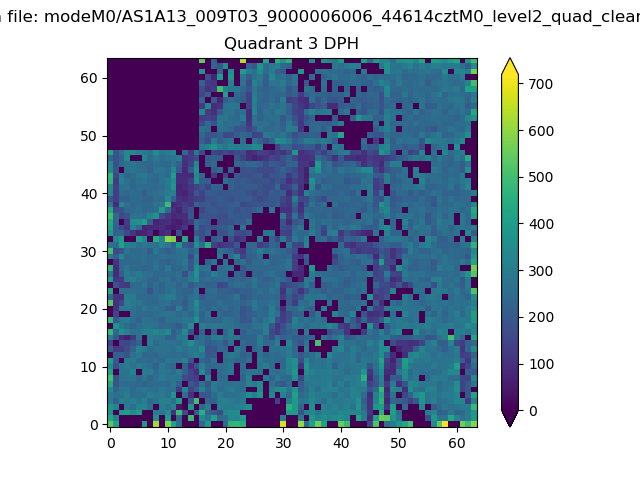 |
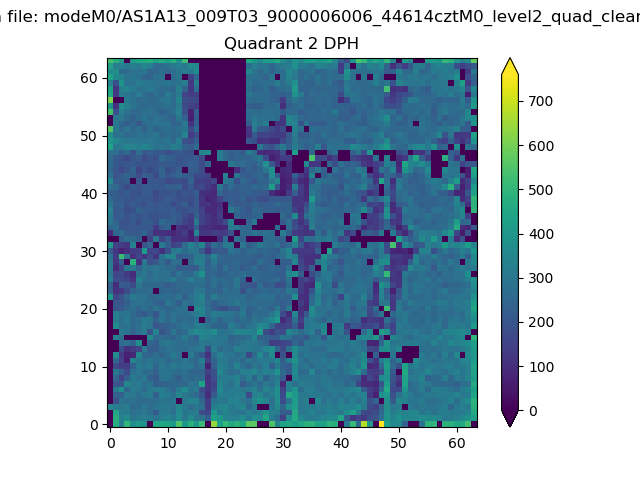 |
Quadrant C |
| Plot type | Count rate plots | Images |
|---|---|---|
| Comparison with Poisson distribution Blue bars denote a histogram of data divided into 1 sec bins. Red curve is a Poisson curve with rate = median count rate of data. |
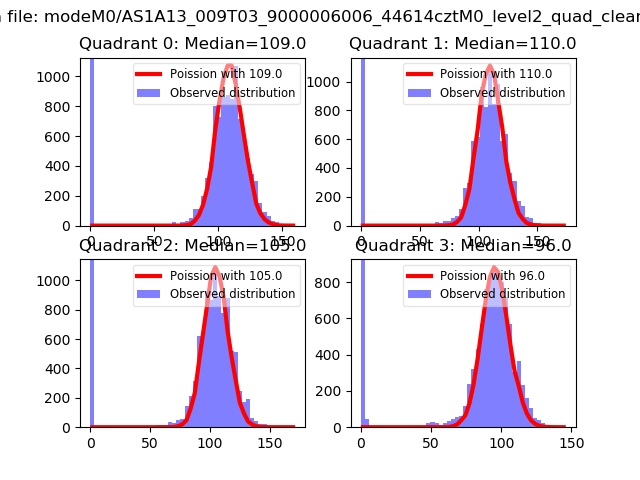 |
 |
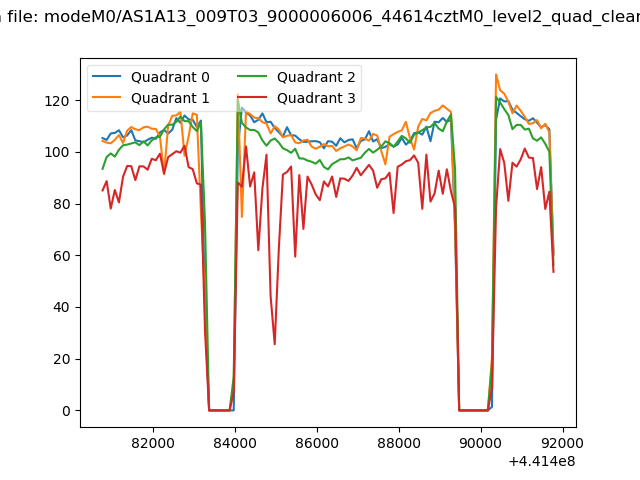
| Quadrant-wise count rates Data is divided into 100 sec bins |
 |
|
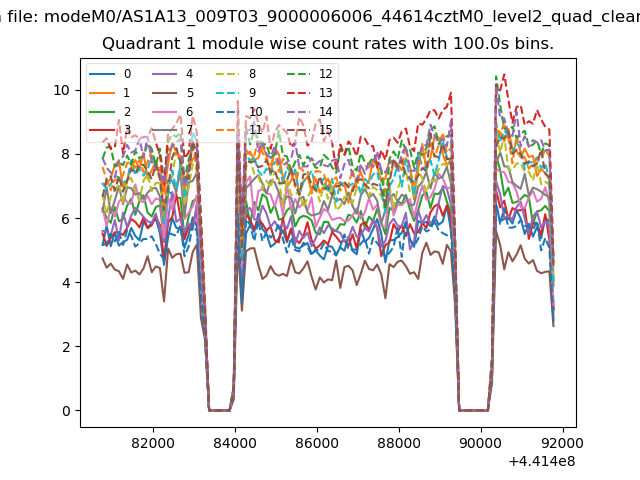
| Module-wise count rates for Quadrant A Data is divided into 100 sec bins |
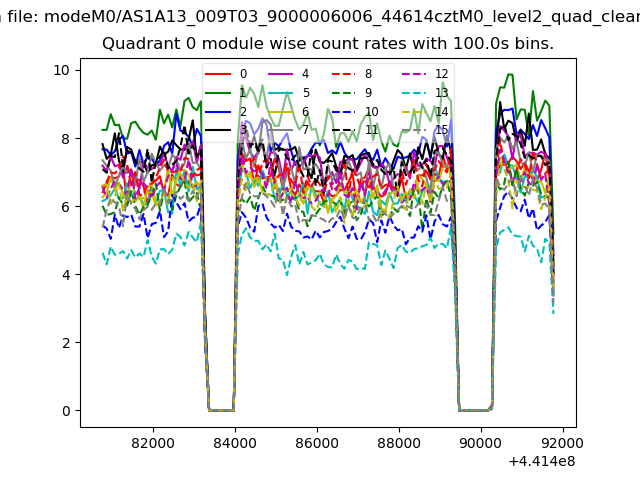 |
 |
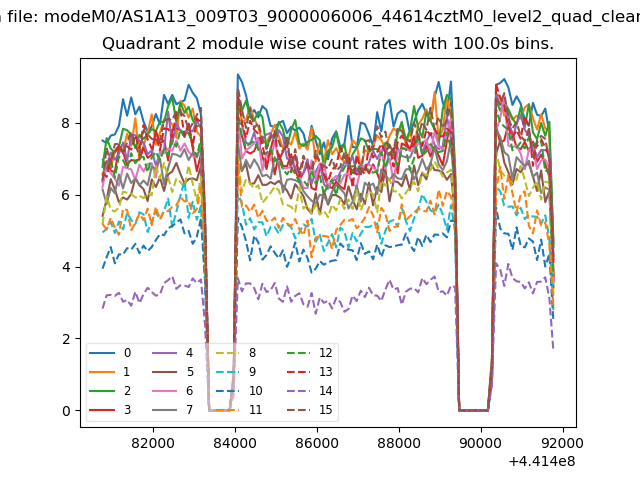
| Module-wise count rates for Quadrant B Data is divided into 100 sec bins |
 |
 |
| Module-wise count rates for Quadrant C Data is divided into 100 sec bins |
 |
 |
| Module-wise count rates for Quadrant D Data is divided into 100 sec bins |
 |
 |
| Parameter | Plot |
|---|---|
| CZT HV Monitor |  |
| D_VDD | 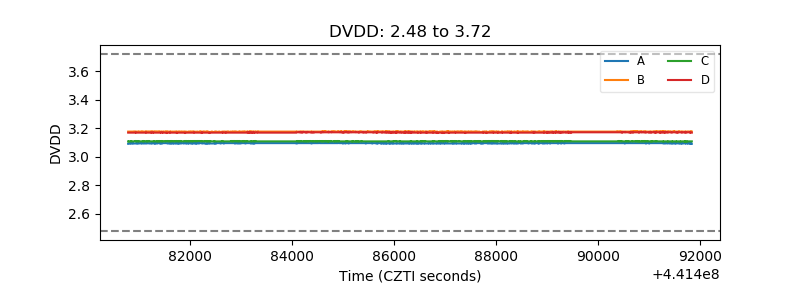 |
| Temperature 1 | 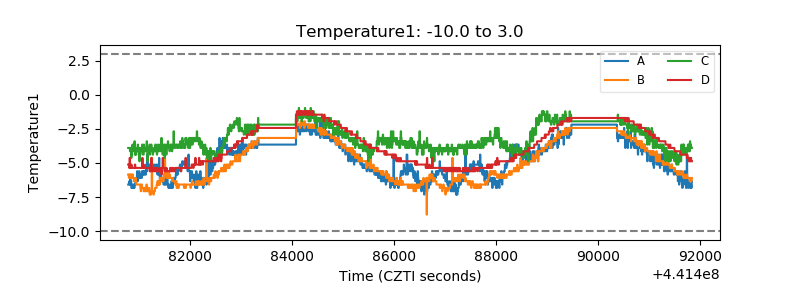 |
| Veto HV Monitor | 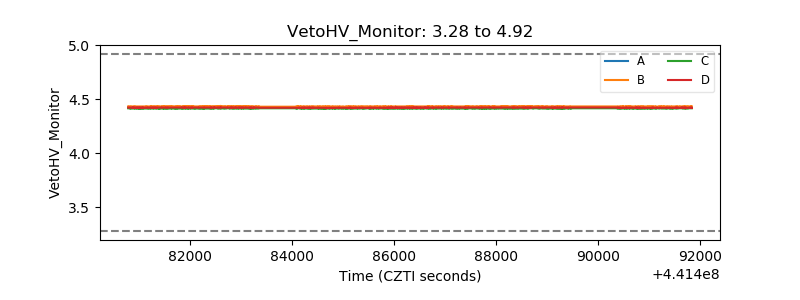 |
| Veto LLD | 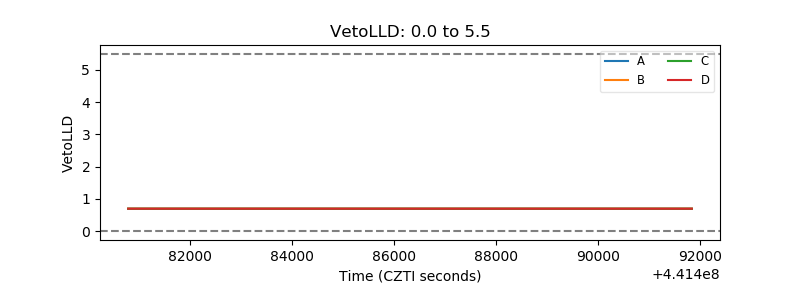 |
| Alpha Counter | 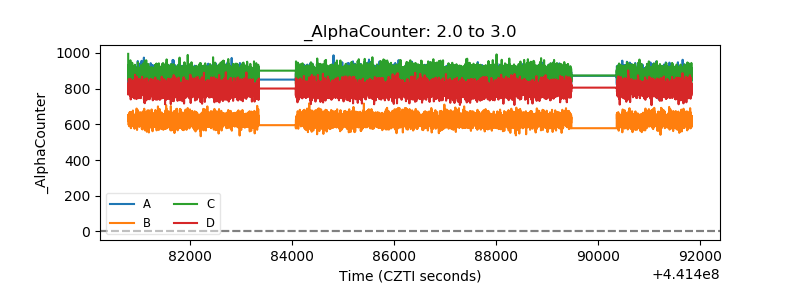 |
| _CPM_Rate | 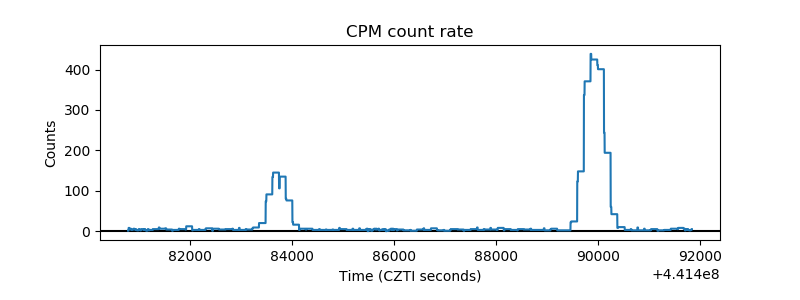 |
| CZT Counter | 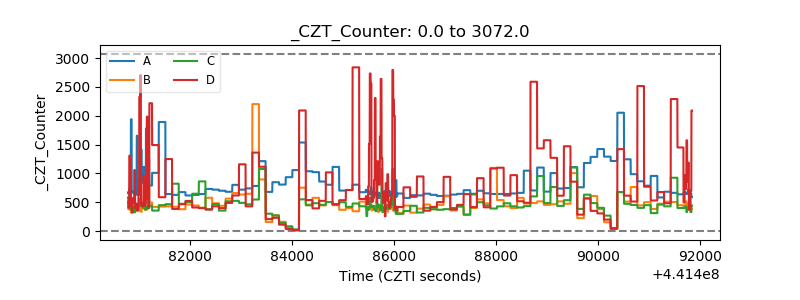 |
| +2.5 Volts monitor | 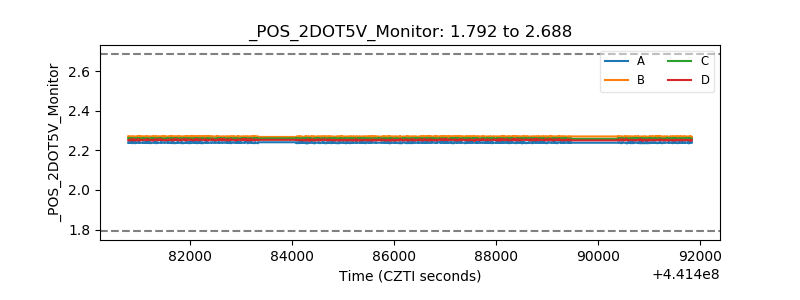 |
| +5 Volts monitor | 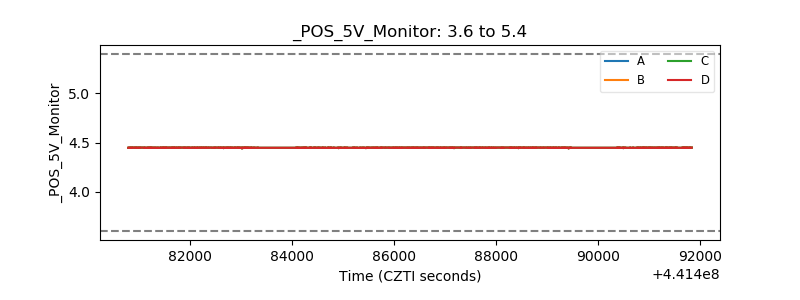 |
| _ROLL_ROT | 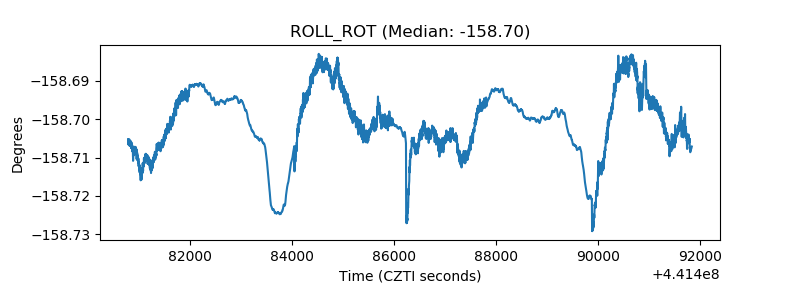 |
| _Roll_DEC | 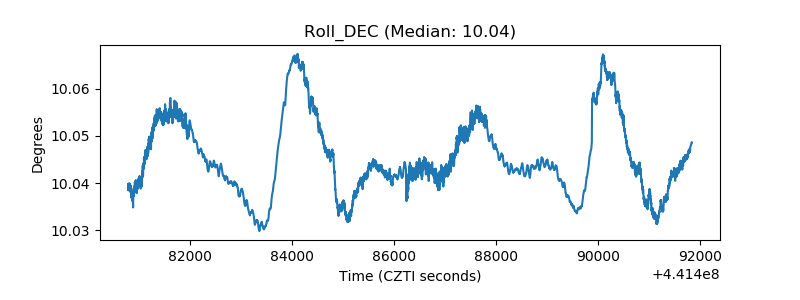 |
| _Roll_RA | 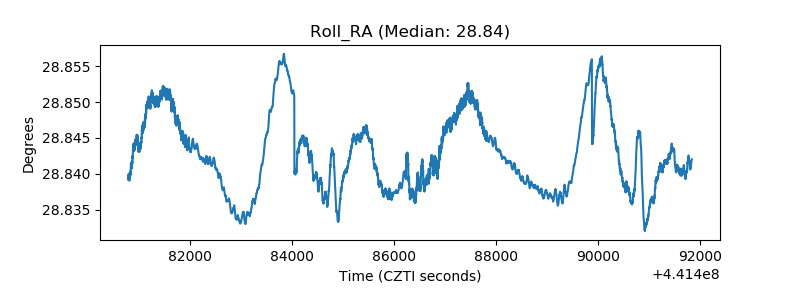 |
| Veto Counter | 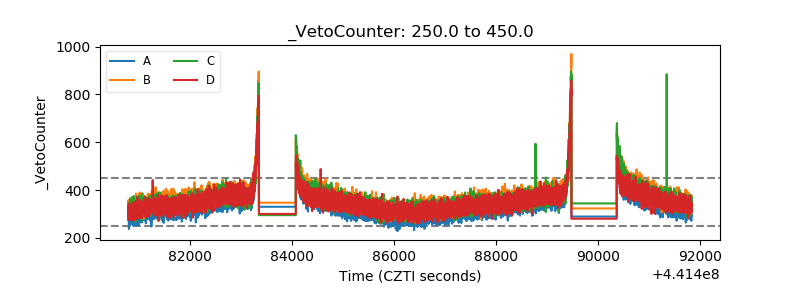 |