| Param | Original file | Final file |
|---|---|---|
| Filename | modeM0/AS1A13_009T03_9000006006_44618cztM0_level2.fits | modeM0/AS1A13_009T03_9000006006_44618cztM0_level2_quad_clean.evt |
| Size (bytes) | 561,542,400 | 111,729,600 |
| Size | 535.5 MB | 106.6 MB |
| Events in quadrant A | 5,759,906 | 765,620 |
| Events in quadrant B | 3,266,972 | 801,241 |
| Events in quadrant C | 3,359,692 | 751,891 |
| Events in quadrant D | 7,899,174 | 613,345 |
| Mode SS | |||
|---|---|---|---|
| Quadrant | BADHDUFLAG | Total packets | Discarded packets |
| A | 0 | 132 | 0 |
| B | 0 | 132 | 0 |
| C | 0 | 132 | 0 |
| D | 0 | 132 | 0 |
| Mode M9 | |||
|---|---|---|---|
| Quadrant | BADHDUFLAG | Total packets | Discarded packets |
| A | 0 | 14 | 0 |
| B | 0 | 15 | 0 |
| C | 0 | 15 | 0 |
| D | 0 | 15 | 0 |
| Mode M0 | |||
|---|---|---|---|
| Quadrant | BADHDUFLAG | Total packets | Discarded packets |
| A | 0 | 22346 | 2 |
| B | 0 | 13831 | 2 |
| C | 0 | 14290 | 2 |
| D | 0 | 27962 | 2 |
| Quadrant | Total seconds | Saturated seconds | Saturation percentage |
|---|---|---|---|
| A | 6466 | 159 | 2.459016% |
| B | 6466 | 52 | 0.804207% |
| C | 6466 | 58 | 0.897000% |
| D | 6465 | 1009 | 15.607115% |
Noise dominated data is calculated using 1-second bins in cleaned event files. If a bin has >2000 counts, and if more than 50% of those come from <1% of pixels, then it is considered to be noise-dominated and hence unusable.
| Quadrant | # 1 sec bins | Bins with >0 counts | Bins with >2000 counts | High rate bins dominated by noise | Noise dominated (total time) | Noise dominated (detector-on time) | Marked lightcurve |
|---|---|---|---|---|---|---|---|
| A | 7746 | 6467 | 118 | 118 | 1.52% | 1.82% | 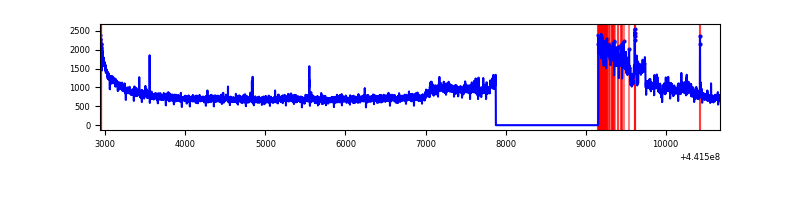 |
| B | 7746 | 6466 | 30 | 30 | 0.39% | 0.46% | 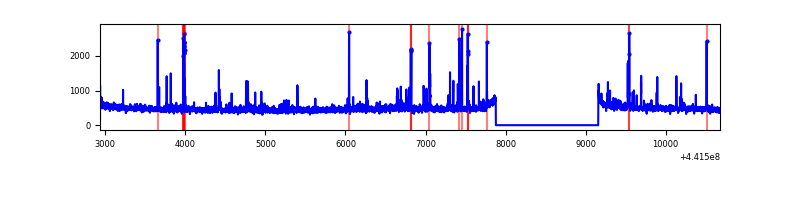 |
| C | 7745 | 6466 | 46 | 46 | 0.59% | 0.71% | 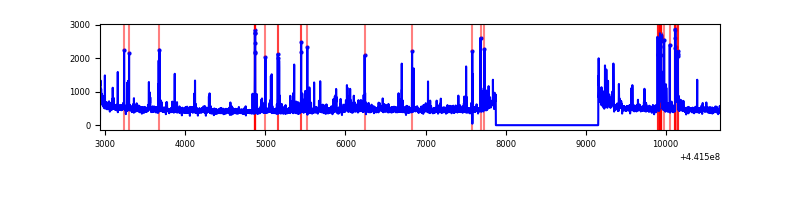 |
| D | 7744 | 6465 | 1055 | 1055 | 13.62% | 16.32% | 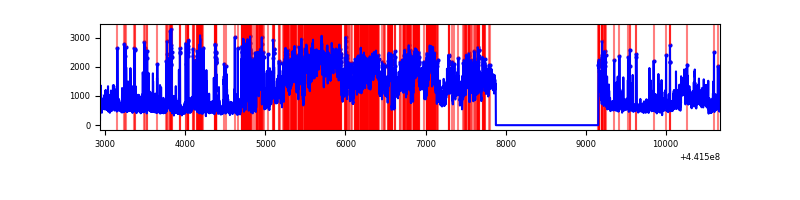 |
Top three noisy pixels from each quadrant. If the there are fewer than three noisy pixels in the level2.evt file, extra rows are filled as -1
| Pixel properties | Quadrant properties | ||||||
|---|---|---|---|---|---|---|---|
| Quadrant | DetID | PixID | Counts | Sigma | Mean | Median | Sigma |
| A | 10 | 83 | 1929338 | 12290.6 | 757 | 746 | 156.9 |
| A | 15 | 223 | 862865 | 5494.14 | 757 | 746 | 156.9 |
| A | 10 | 248 | 15333 | 92.96 | 757 | 746 | 156.9 |
| B | 5 | 172 | 121786 | 812.21 | 764 | 743 | 149.0 |
| B | 0 | 189 | 59112 | 391.66 | 764 | 743 | 149.0 |
| B | 5 | 171 | 35428 | 232.74 | 764 | 743 | 149.0 |
| C | 12 | 2 | 250131 | 1426.36 | 748 | 756 | 174.8 |
| C | 3 | 233 | 71692 | 405.74 | 748 | 756 | 174.8 |
| C | 14 | 254 | 63374 | 358.16 | 748 | 756 | 174.8 |
| D | 13 | 153 | 3455835 | 19079.36 | 711 | 691 | 181.1 |
| D | 1 | 52 | 1017108 | 5612.67 | 711 | 691 | 181.1 |
| D | 13 | 249 | 359643 | 1982.14 | 711 | 691 | 181.1 |
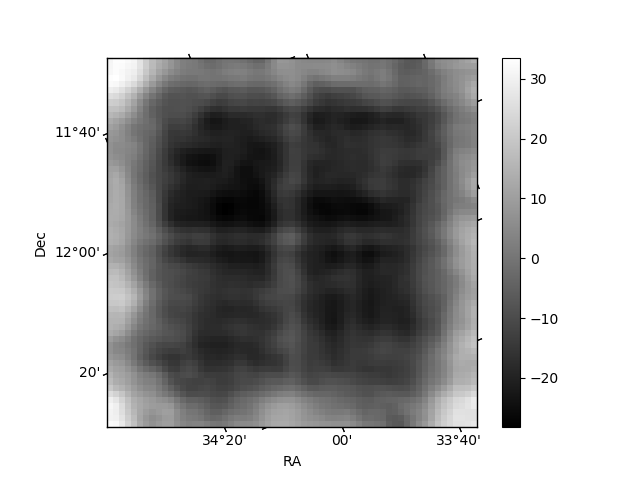
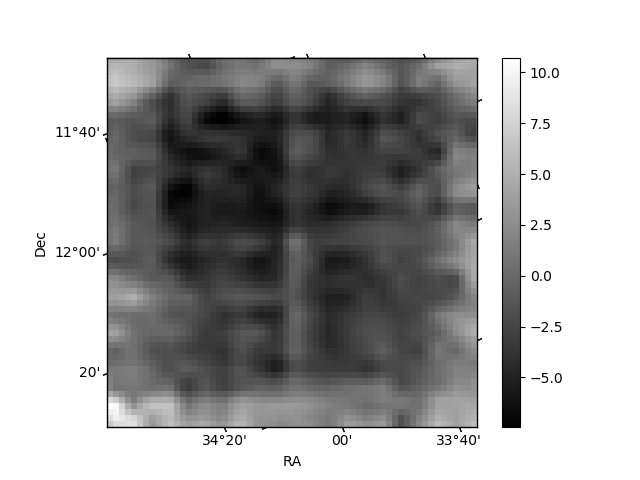
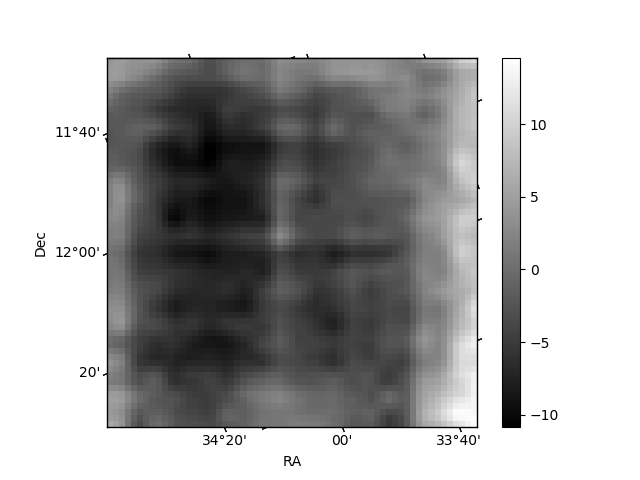
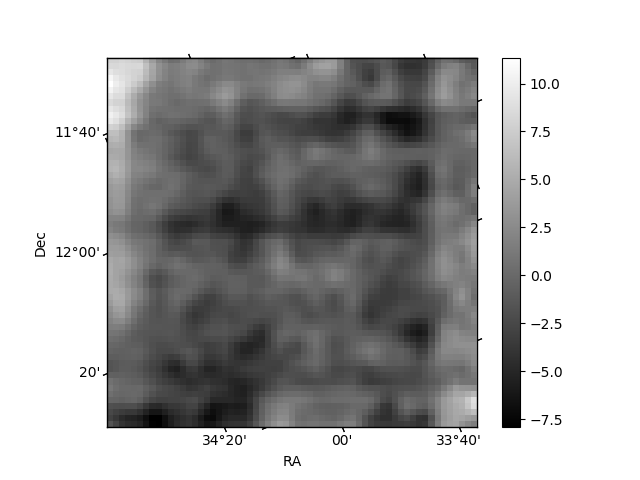
Histogram calculated using DETX and DETY for each event in the final _common_clean file
| Quadrant A | 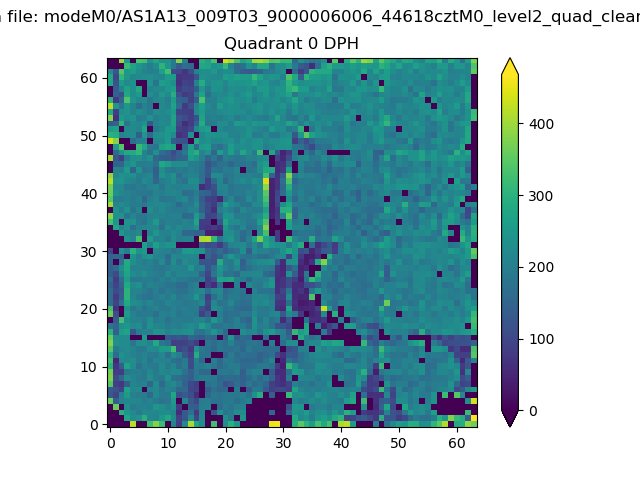 |
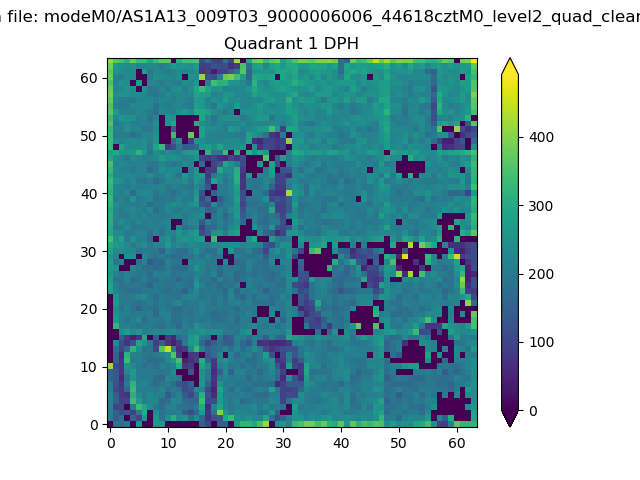 |
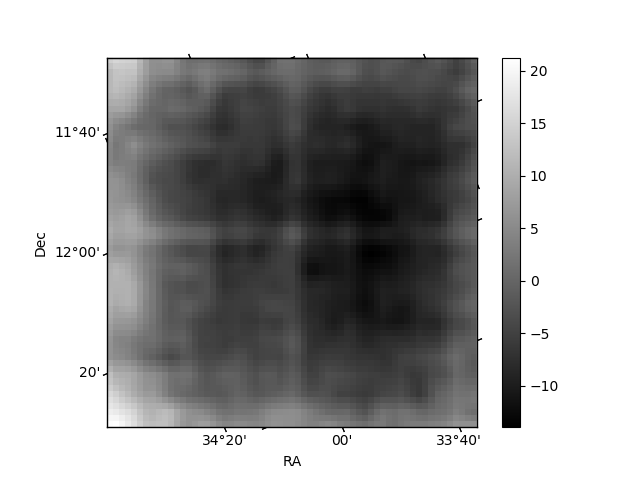
Quadrant B |
|---|---|---|---|
| Quadrant D | 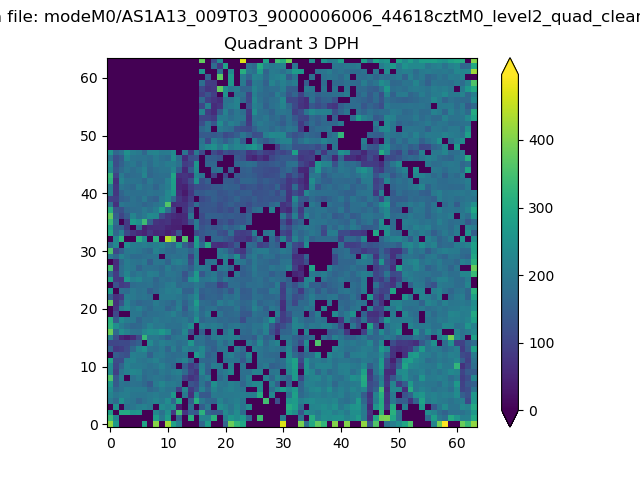 |
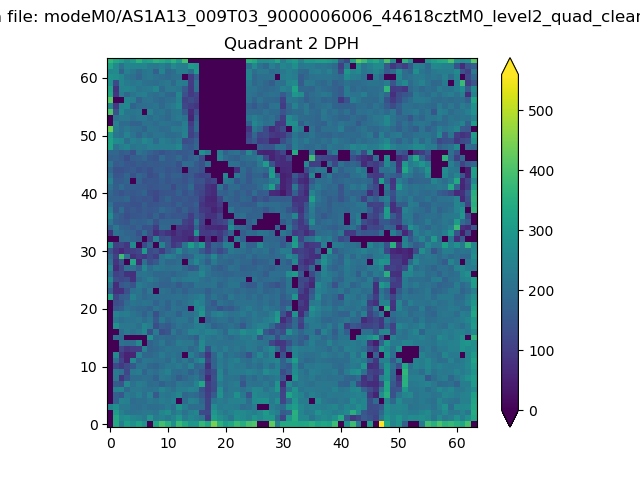 |
Quadrant C |
| Plot type | Count rate plots | Images |
|---|---|---|
| Comparison with Poisson distribution Blue bars denote a histogram of data divided into 1 sec bins. Red curve is a Poisson curve with rate = median count rate of data. |
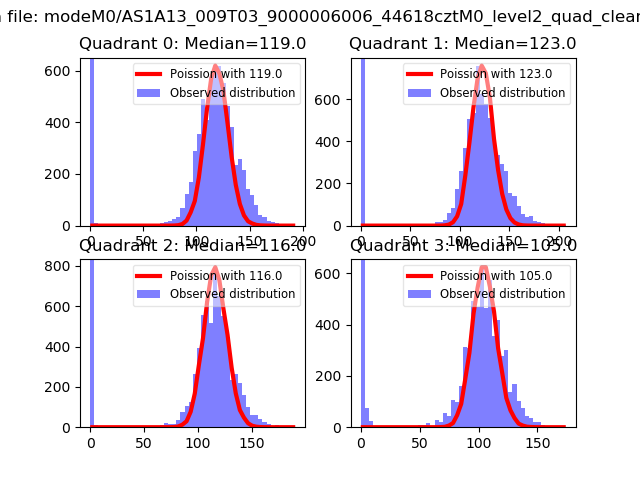 |
 |
| Quadrant-wise count rates Data is divided into 100 sec bins |
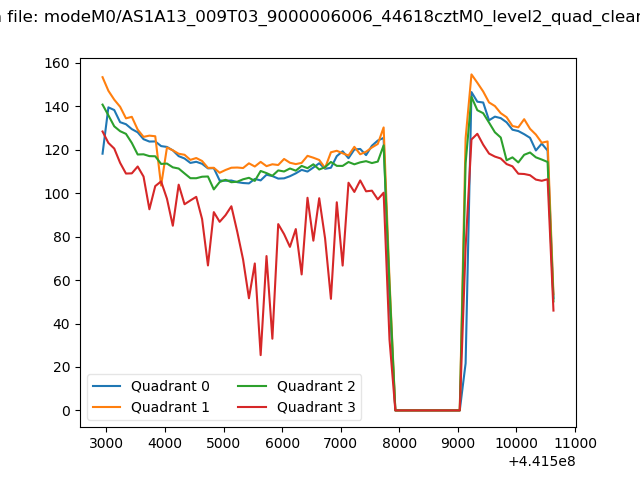 |
|
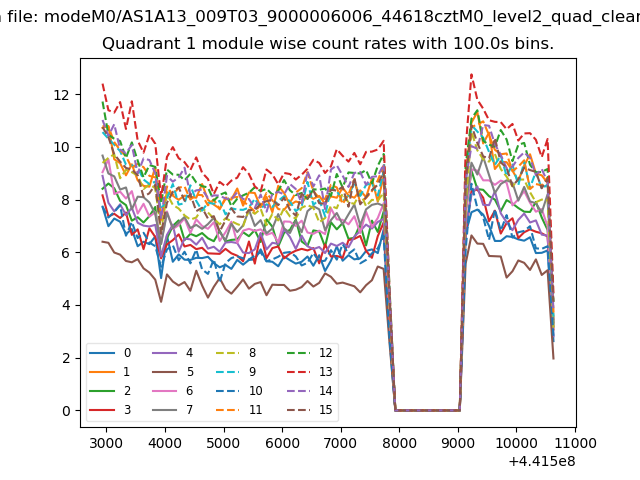
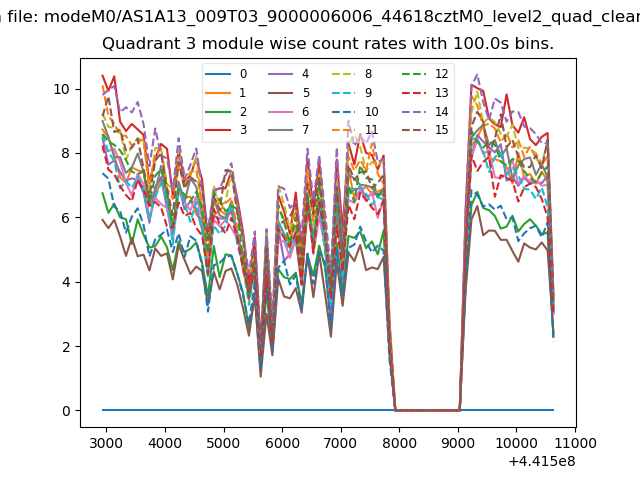
| Module-wise count rates for Quadrant A Data is divided into 100 sec bins |
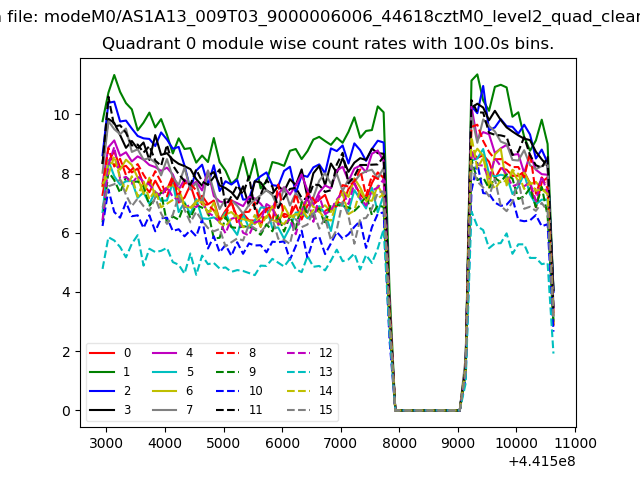 |
 |
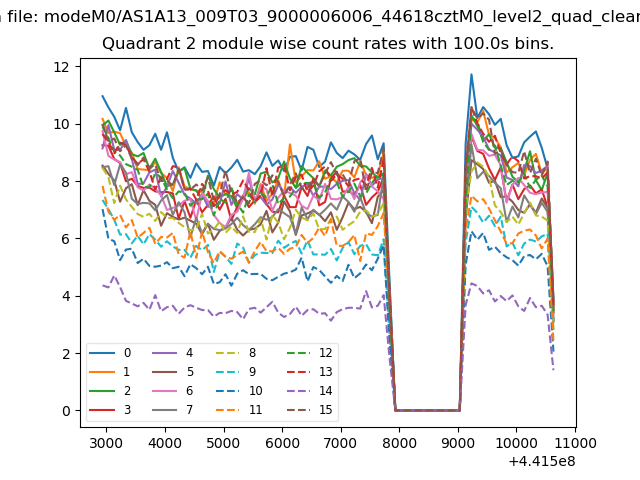
| Module-wise count rates for Quadrant B Data is divided into 100 sec bins |
 |
 |
| Module-wise count rates for Quadrant C Data is divided into 100 sec bins |
 |
 |
| Module-wise count rates for Quadrant D Data is divided into 100 sec bins |
 |
 |
| Parameter | Plot |
|---|---|
| CZT HV Monitor |  |
| D_VDD | 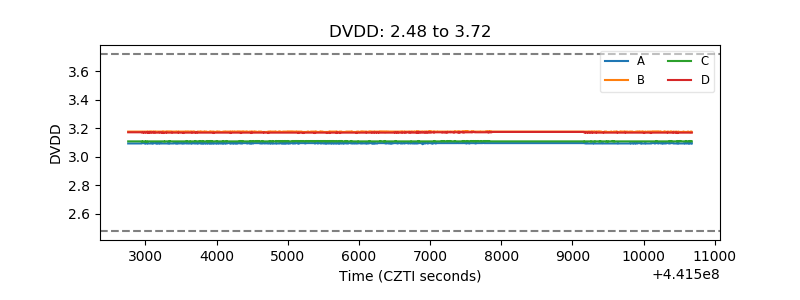 |
| Temperature 1 | 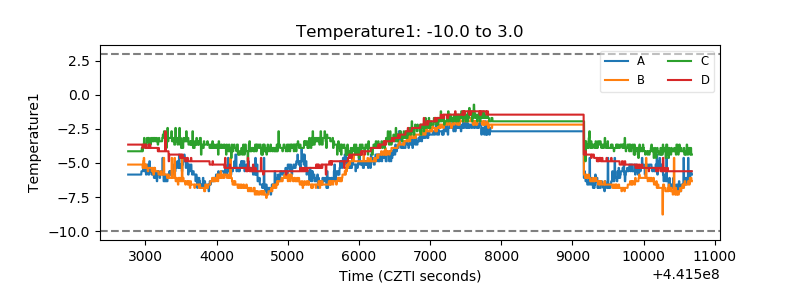 |
| Veto HV Monitor | 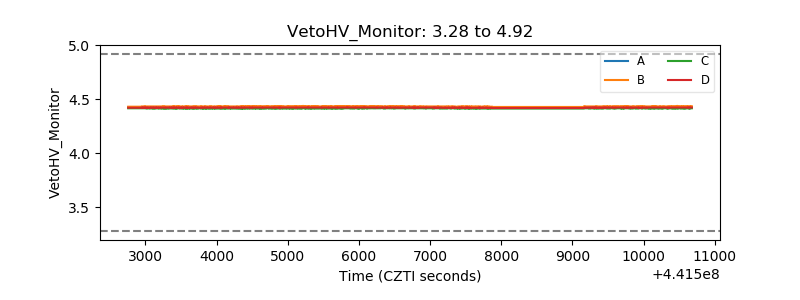 |
| Veto LLD | 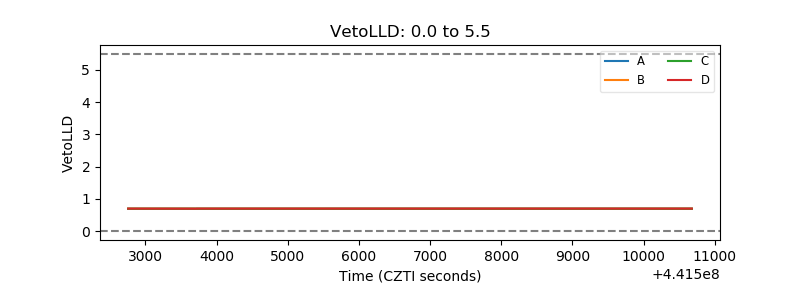 |
| Alpha Counter | 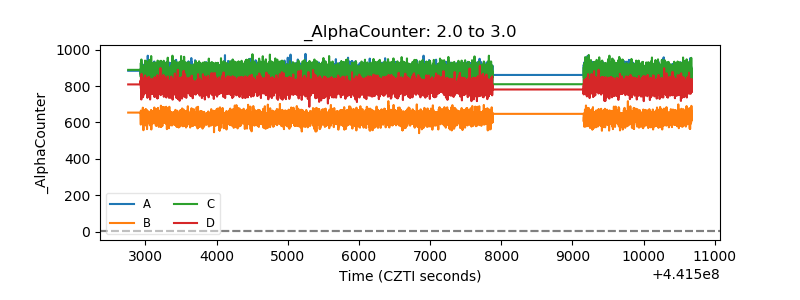 |
| _CPM_Rate | 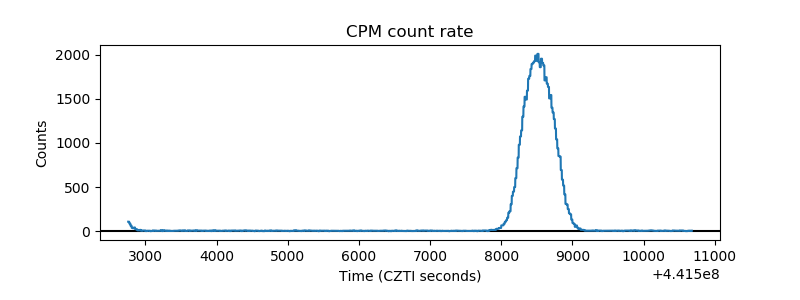 |
| CZT Counter | 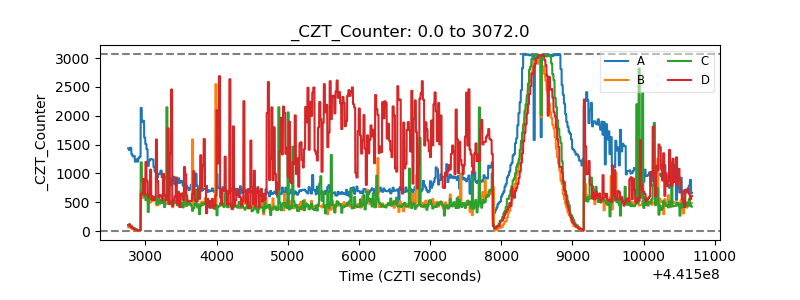 |
| +2.5 Volts monitor | 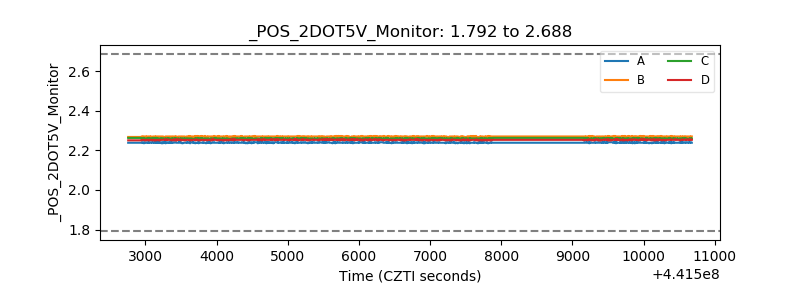 |
| +5 Volts monitor | 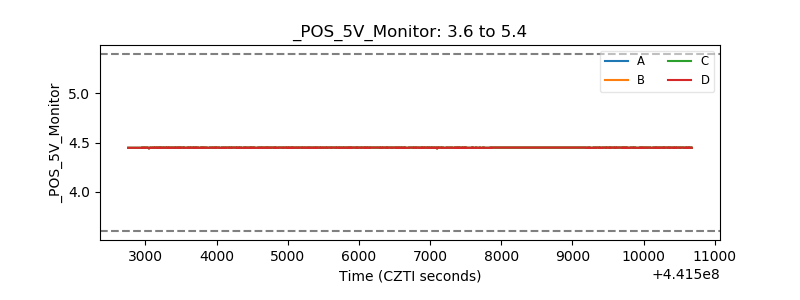 |
| _ROLL_ROT |  |
| _Roll_DEC | 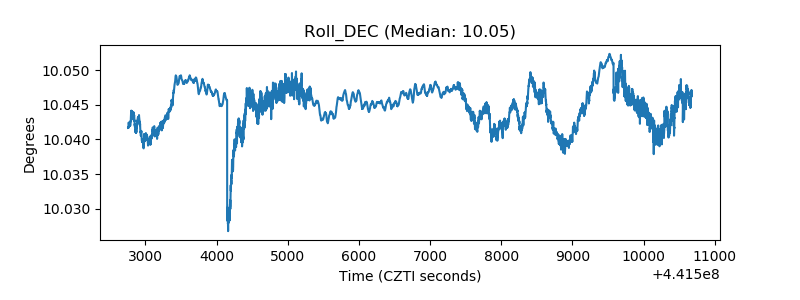 |
| _Roll_RA | 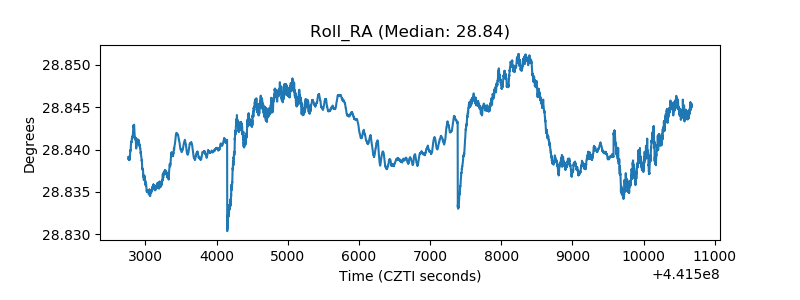 |
| Veto Counter |  |