| Param | Original file | Final file |
|---|---|---|
| Filename | modeM0/AS1A13_009T03_9000006006_44620cztM0_level2.fits | modeM0/AS1A13_009T03_9000006006_44620cztM0_level2_quad_clean.evt |
| Size (bytes) | 458,311,680 | 115,217,280 |
| Size | 437.1 MB | 109.9 MB |
| Events in quadrant A | 5,219,430 | 774,757 |
| Events in quadrant B | 3,440,476 | 808,870 |
| Events in quadrant C | 3,388,837 | 762,510 |
| Events in quadrant D | 4,404,297 | 683,088 |
| Mode SS | |||
|---|---|---|---|
| Quadrant | BADHDUFLAG | Total packets | Discarded packets |
| A | 0 | 134 | 0 |
| B | 0 | 134 | 0 |
| C | 0 | 134 | 0 |
| D | 0 | 134 | 0 |
| Mode M9 | |||
|---|---|---|---|
| Quadrant | BADHDUFLAG | Total packets | Discarded packets |
| A | 0 | 17 | 0 |
| B | 0 | 18 | 0 |
| C | 0 | 18 | 0 |
| D | 0 | 18 | 0 |
| Mode M0 | |||
|---|---|---|---|
| Quadrant | BADHDUFLAG | Total packets | Discarded packets |
| A | 0 | 20933 | 2 |
| B | 0 | 14396 | 2 |
| C | 0 | 14459 | 2 |
| D | 0 | 17612 | 4 |
| Quadrant | Total seconds | Saturated seconds | Saturation percentage |
|---|---|---|---|
| A | 6593 | 183 | 2.775671% |
| B | 6593 | 144 | 2.184135% |
| C | 6593 | 114 | 1.729107% |
| D | 6591 | 320 | 4.855105% |
Noise dominated data is calculated using 1-second bins in cleaned event files. If a bin has >2000 counts, and if more than 50% of those come from <1% of pixels, then it is considered to be noise-dominated and hence unusable.
| Quadrant | # 1 sec bins | Bins with >0 counts | Bins with >2000 counts | High rate bins dominated by noise | Noise dominated (total time) | Noise dominated (detector-on time) | Marked lightcurve |
|---|---|---|---|---|---|---|---|
| A | 7793 | 6594 | 14 | 14 | 0.18% | 0.21% | 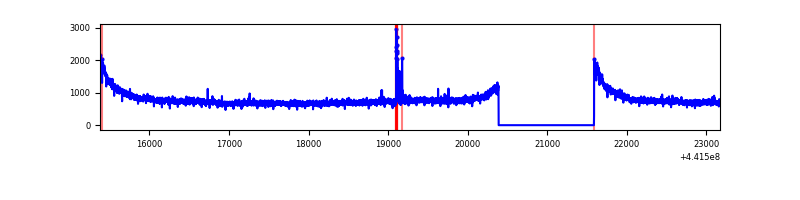 |
| B | 7793 | 6594 | 21 | 21 | 0.27% | 0.32% | 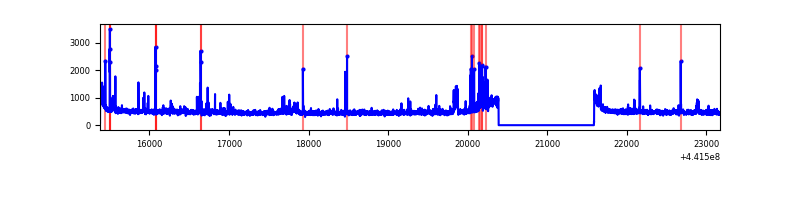 |
| C | 7793 | 6594 | 29 | 29 | 0.37% | 0.44% | 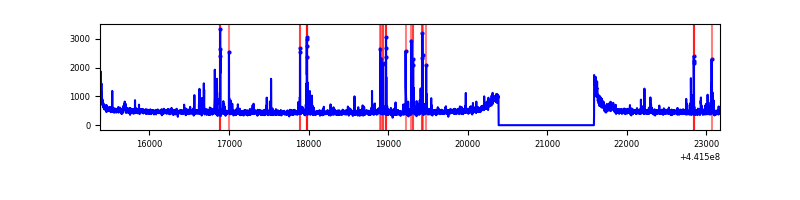 |
| D | 7792 | 6593 | 247 | 247 | 3.17% | 3.75% | 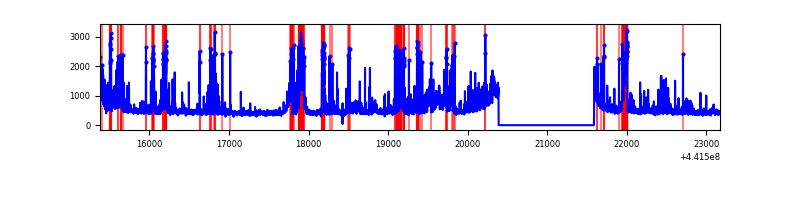 |
Top three noisy pixels from each quadrant. If the there are fewer than three noisy pixels in the level2.evt file, extra rows are filled as -1
| Pixel properties | Quadrant properties | ||||||
|---|---|---|---|---|---|---|---|
| Quadrant | DetID | PixID | Counts | Sigma | Mean | Median | Sigma |
| A | 10 | 83 | 1979009 | 12113.9 | 791 | 774 | 163.3 |
| A | 15 | 223 | 128425 | 781.68 | 791 | 774 | 163.3 |
| A | 13 | 248 | 42015 | 252.54 | 791 | 774 | 163.3 |
| B | 0 | 186 | 115019 | 731.16 | 798 | 772 | 156.3 |
| B | 0 | 190 | 85205 | 540.36 | 798 | 772 | 156.3 |
| B | 5 | 172 | 79705 | 505.16 | 798 | 772 | 156.3 |
| C | 12 | 2 | 158329 | 859.77 | 779 | 787 | 183.2 |
| C | 3 | 233 | 112841 | 611.52 | 779 | 787 | 183.2 |
| C | 9 | 54 | 40151 | 214.83 | 779 | 787 | 183.2 |
| D | 13 | 153 | 503067 | 2596.82 | 764 | 741 | 193.4 |
| D | 13 | 249 | 389411 | 2009.27 | 764 | 741 | 193.4 |
| D | 1 | 52 | 365840 | 1887.42 | 764 | 741 | 193.4 |
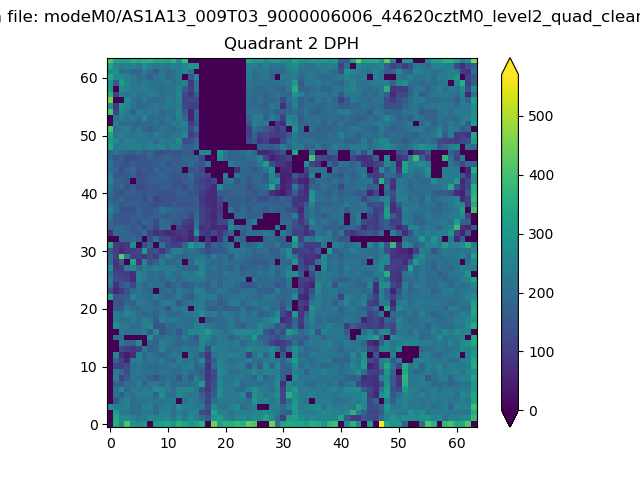
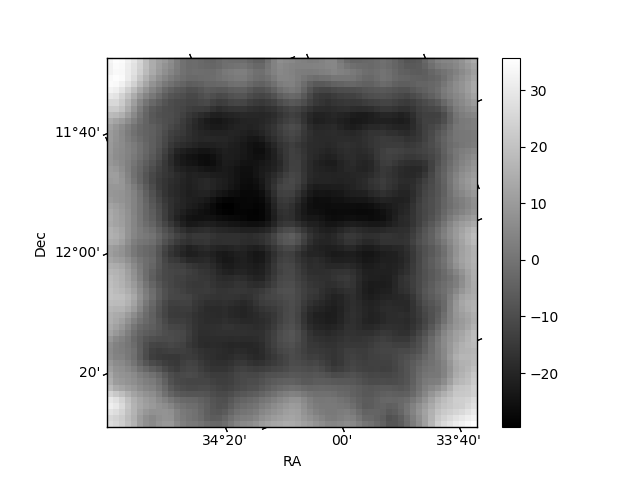
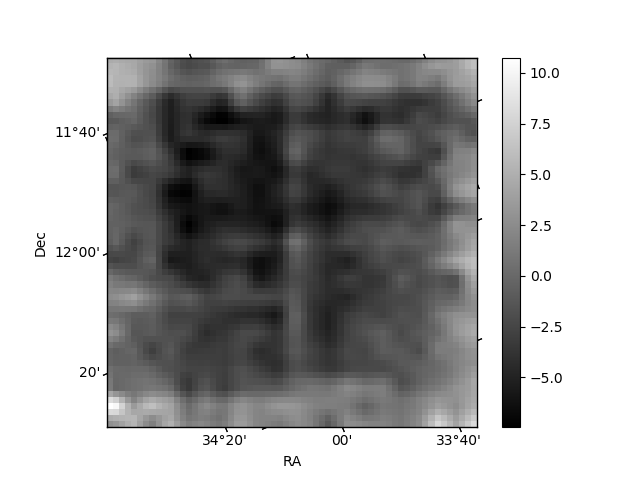
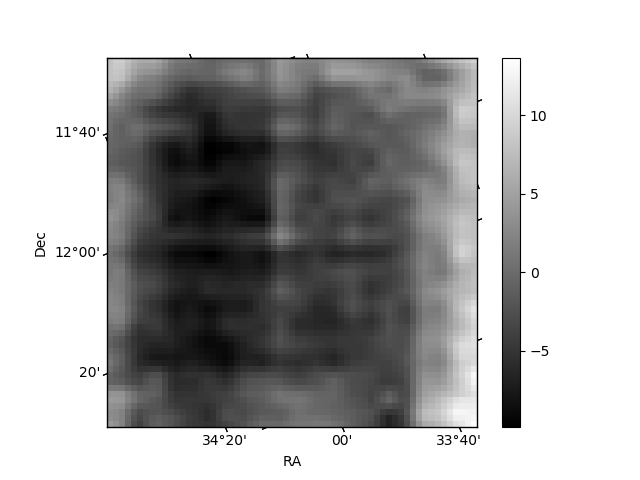
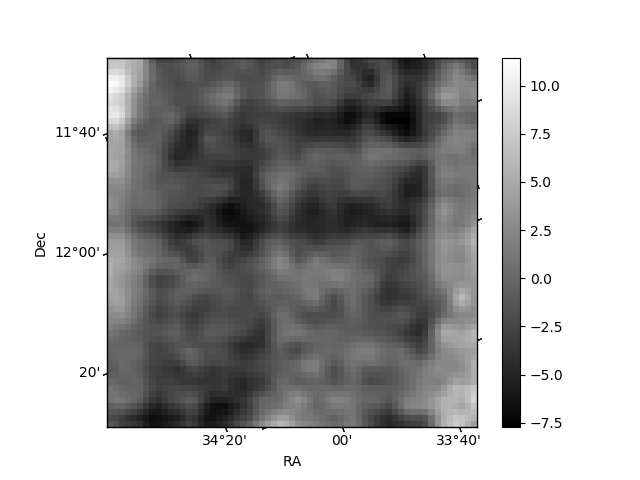
Histogram calculated using DETX and DETY for each event in the final _common_clean file
| Quadrant A | 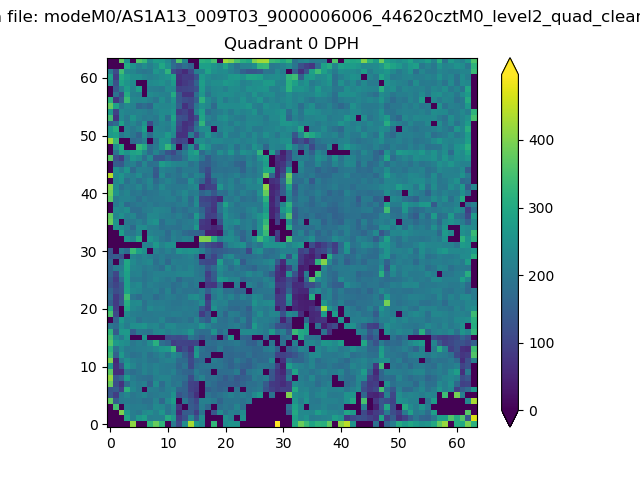 |
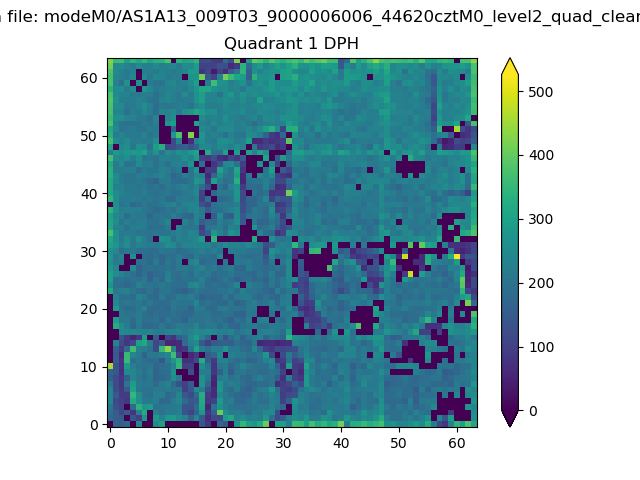 |
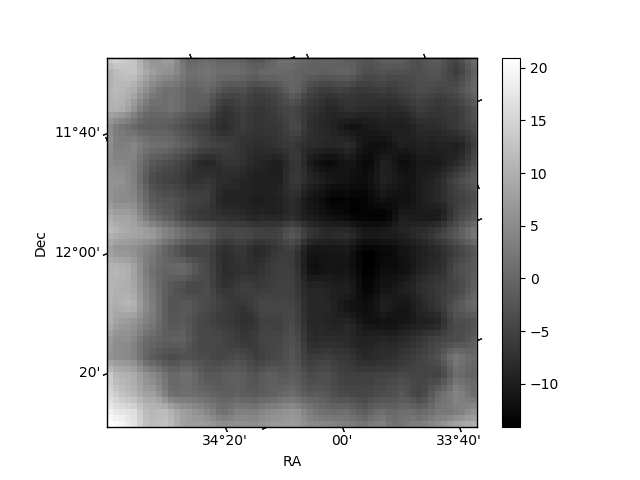
Quadrant B |
|---|---|---|---|
| Quadrant D | 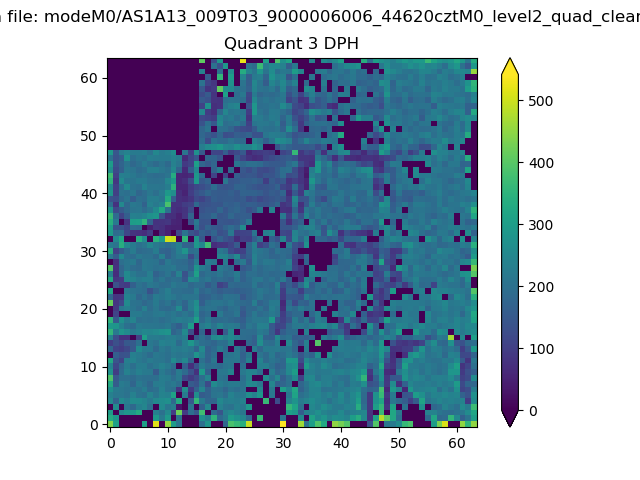 |
 |
Quadrant C |
| Plot type | Count rate plots | Images |
|---|---|---|
| Comparison with Poisson distribution Blue bars denote a histogram of data divided into 1 sec bins. Red curve is a Poisson curve with rate = median count rate of data. |
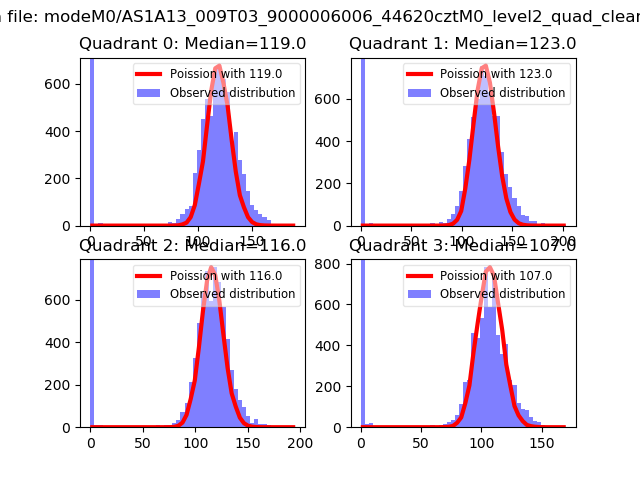 |
 |
| Quadrant-wise count rates Data is divided into 100 sec bins |
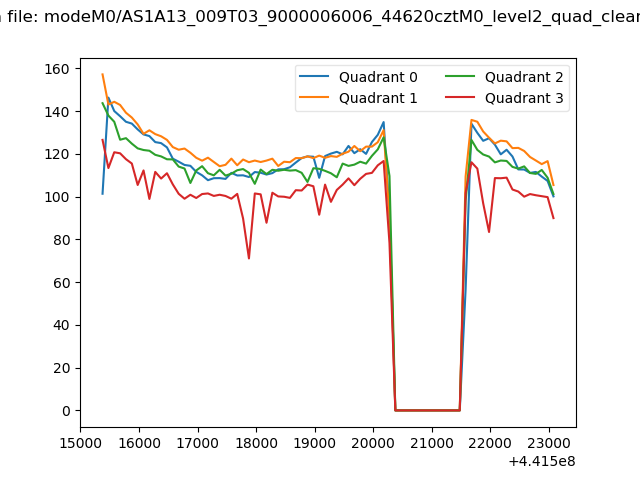 |
|
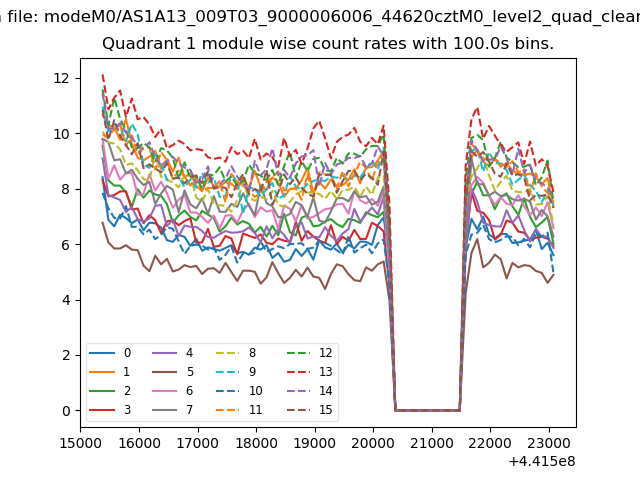
| Module-wise count rates for Quadrant A Data is divided into 100 sec bins |
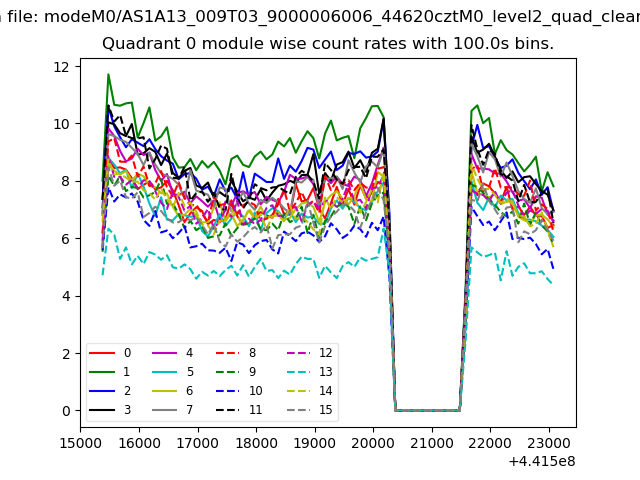 |
 |
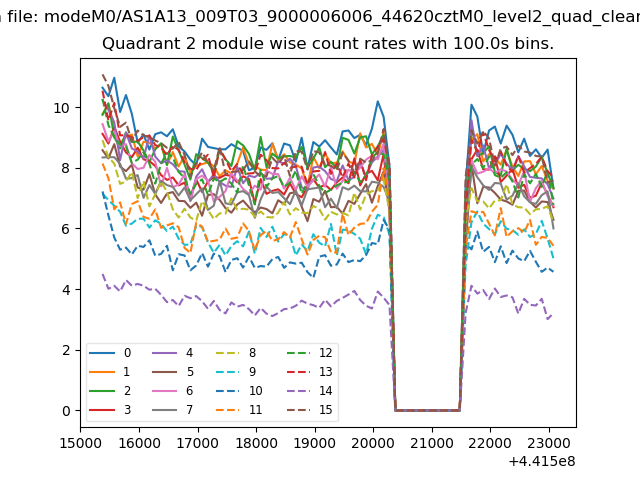
| Module-wise count rates for Quadrant B Data is divided into 100 sec bins |
 |
 |
| Module-wise count rates for Quadrant C Data is divided into 100 sec bins |
 |
 |
| Module-wise count rates for Quadrant D Data is divided into 100 sec bins |
 |
 |
| Parameter | Plot |
|---|---|
| CZT HV Monitor | 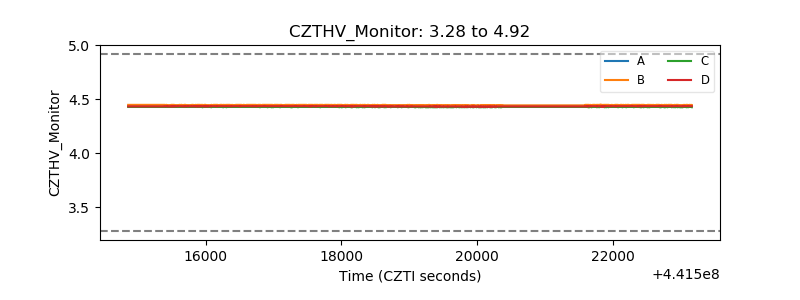 |
| D_VDD | 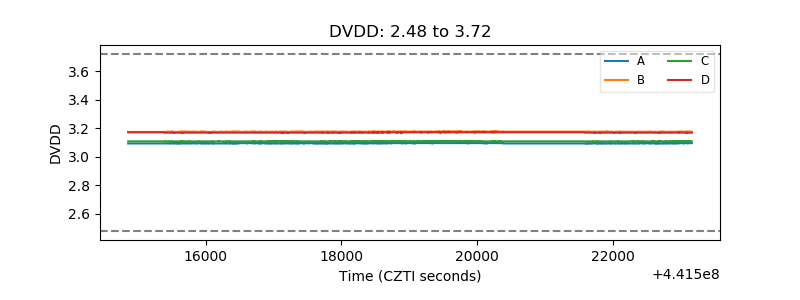 |
| Temperature 1 | 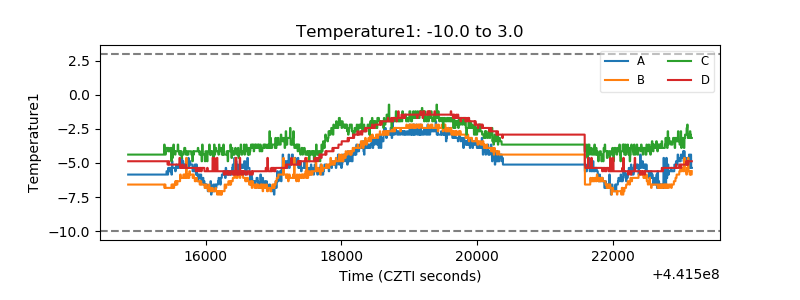 |
| Veto HV Monitor | 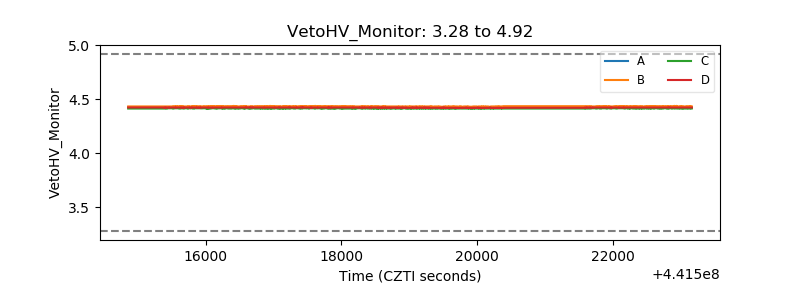 |
| Veto LLD | 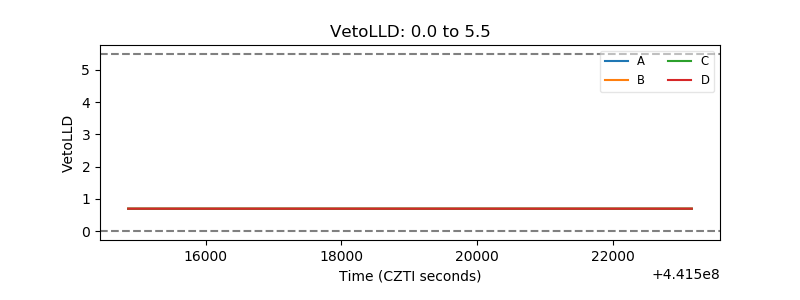 |
| Alpha Counter | 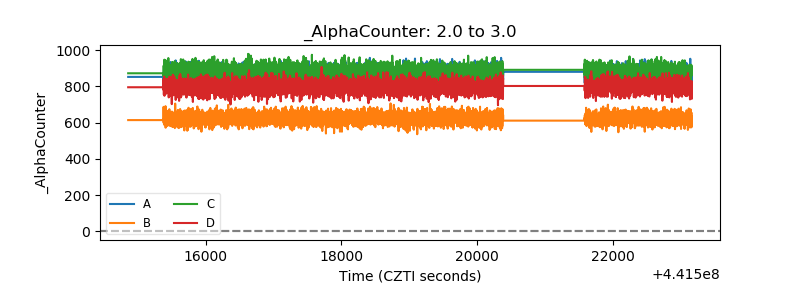 |
| _CPM_Rate | 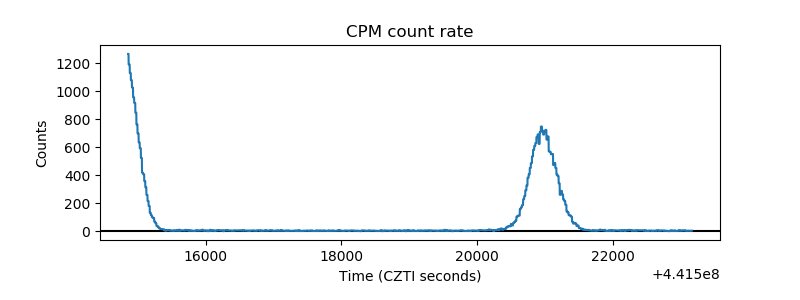 |
| CZT Counter | 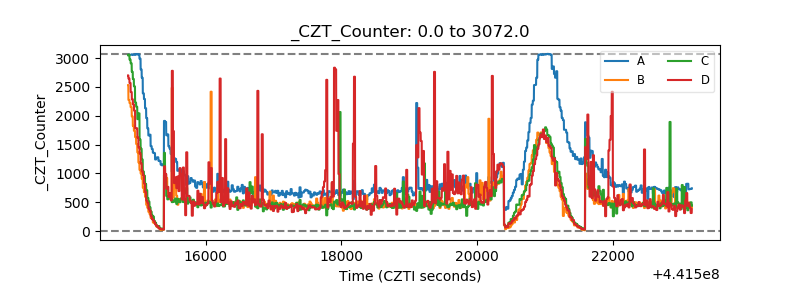 |
| +2.5 Volts monitor | 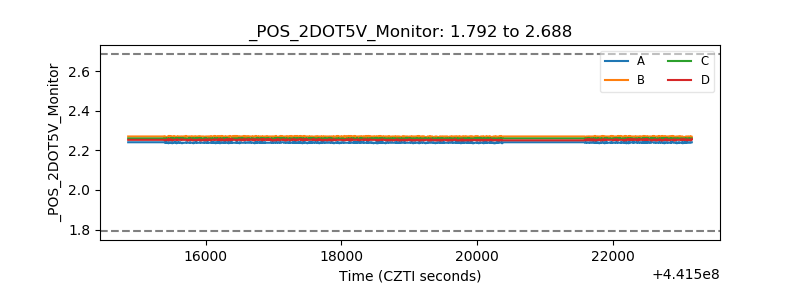 |
| +5 Volts monitor | 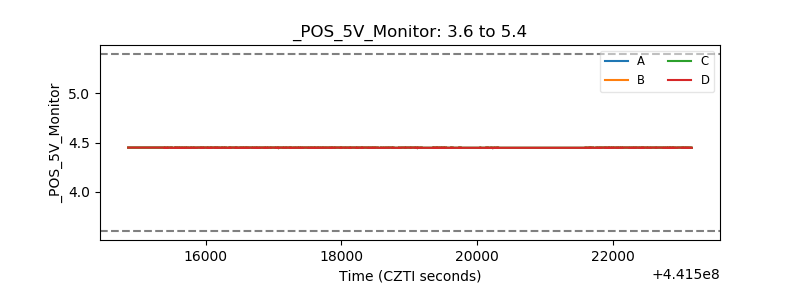 |
| _ROLL_ROT | 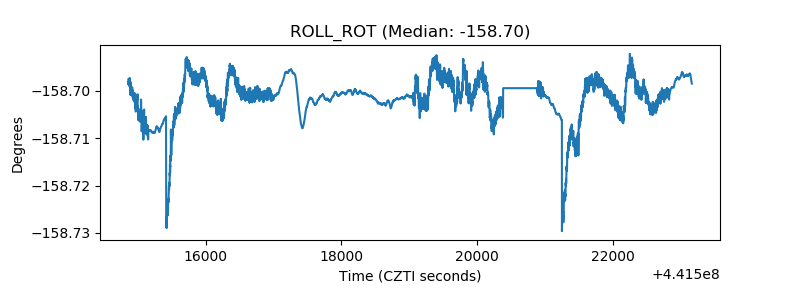 |
| _Roll_DEC | 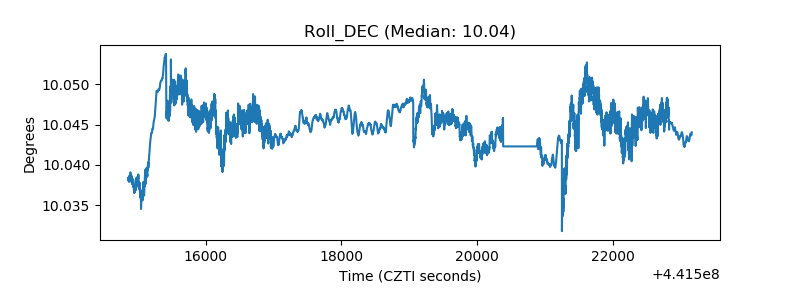 |
| _Roll_RA | 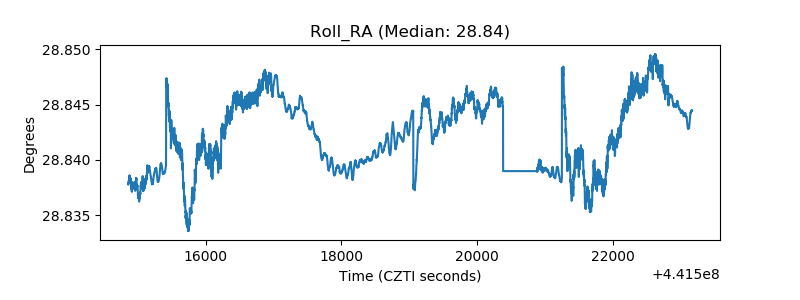 |
| Veto Counter |  |