| Param | Original file | Final file |
|---|---|---|
| Filename | modeM0/AS1A13_009T03_9000006006_44622cztM0_level2.fits | modeM0/AS1A13_009T03_9000006006_44622cztM0_level2_quad_clean.evt |
| Size (bytes) | 529,447,680 | 114,655,680 |
| Size | 504.9 MB | 109.3 MB |
| Events in quadrant A | 5,419,592 | 764,550 |
| Events in quadrant B | 3,517,349 | 795,557 |
| Events in quadrant C | 4,410,676 | 749,083 |
| Events in quadrant D | 5,686,326 | 656,817 |
| Mode SS | |||
|---|---|---|---|
| Quadrant | BADHDUFLAG | Total packets | Discarded packets |
| A | 0 | 146 | 0 |
| B | 0 | 146 | 0 |
| C | 0 | 146 | 0 |
| D | 0 | 146 | 0 |
| Mode M9 | |||
|---|---|---|---|
| Quadrant | BADHDUFLAG | Total packets | Discarded packets |
| A | 0 | 9 | 0 |
| B | 0 | 10 | 0 |
| C | 0 | 10 | 0 |
| D | 0 | 10 | 0 |
| Mode M0 | |||
|---|---|---|---|
| Quadrant | BADHDUFLAG | Total packets | Discarded packets |
| A | 0 | 22512 | 2 |
| B | 0 | 15372 | 6 |
| C | 0 | 18117 | 2 |
| D | 0 | 21837 | 6 |
| Quadrant | Total seconds | Saturated seconds | Saturation percentage |
|---|---|---|---|
| A | 7267 | 385 | 5.297922% |
| B | 7265 | 318 | 4.377151% |
| C | 7267 | 422 | 5.807073% |
| D | 7265 | 811 | 11.163111% |
Noise dominated data is calculated using 1-second bins in cleaned event files. If a bin has >2000 counts, and if more than 50% of those come from <1% of pixels, then it is considered to be noise-dominated and hence unusable.
| Quadrant | # 1 sec bins | Bins with >0 counts | Bins with >2000 counts | High rate bins dominated by noise | Noise dominated (total time) | Noise dominated (detector-on time) | Marked lightcurve |
|---|---|---|---|---|---|---|---|
| A | 7737 | 7268 | 16 | 16 | 0.21% | 0.22% | 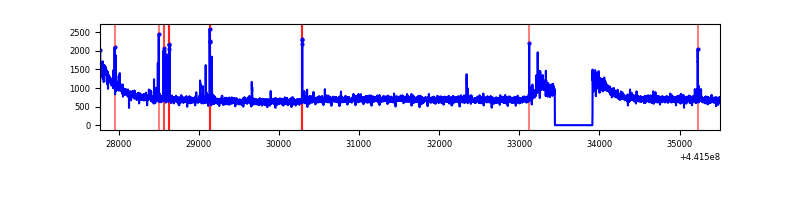 |
| B | 7737 | 7268 | 5 | 5 | 0.06% | 0.07% | 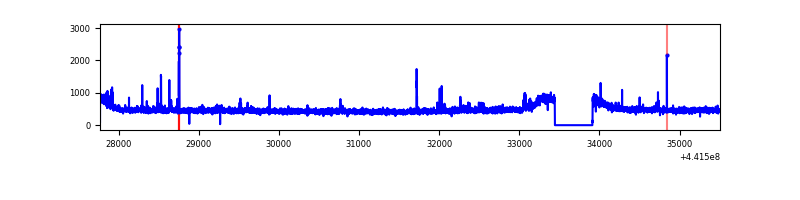 |
| C | 7737 | 7268 | 203 | 203 | 2.62% | 2.79% | 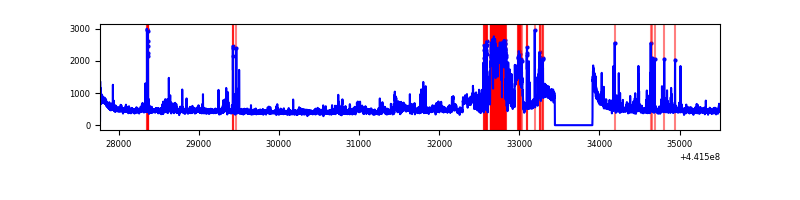 |
| D | 7736 | 7267 | 517 | 517 | 6.68% | 7.11% | 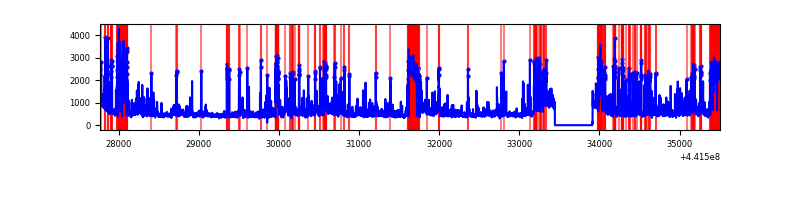 |
Top three noisy pixels from each quadrant. If the there are fewer than three noisy pixels in the level2.evt file, extra rows are filled as -1
| Pixel properties | Quadrant properties | ||||||
|---|---|---|---|---|---|---|---|
| Quadrant | DetID | PixID | Counts | Sigma | Mean | Median | Sigma |
| A | 10 | 83 | 1949632 | 10910.29 | 854 | 833 | 178.6 |
| A | 13 | 248 | 92724 | 514.45 | 854 | 833 | 178.6 |
| A | 15 | 223 | 50978 | 280.74 | 854 | 833 | 178.6 |
| B | 0 | 190 | 49696 | 283.22 | 855 | 827 | 172.5 |
| B | 0 | 219 | 23846 | 133.41 | 855 | 827 | 172.5 |
| B | 0 | 183 | 22532 | 125.79 | 855 | 827 | 172.5 |
| C | 9 | 54 | 837970 | 4245.88 | 835 | 841 | 197.2 |
| C | 12 | 2 | 149623 | 754.62 | 835 | 841 | 197.2 |
| C | 3 | 233 | 95281 | 479.0 | 835 | 841 | 197.2 |
| D | 13 | 249 | 1195046 | 5862.5 | 805 | 781 | 203.7 |
| D | 1 | 52 | 701010 | 3437.34 | 805 | 781 | 203.7 |
| D | 13 | 153 | 580624 | 2846.38 | 805 | 781 | 203.7 |
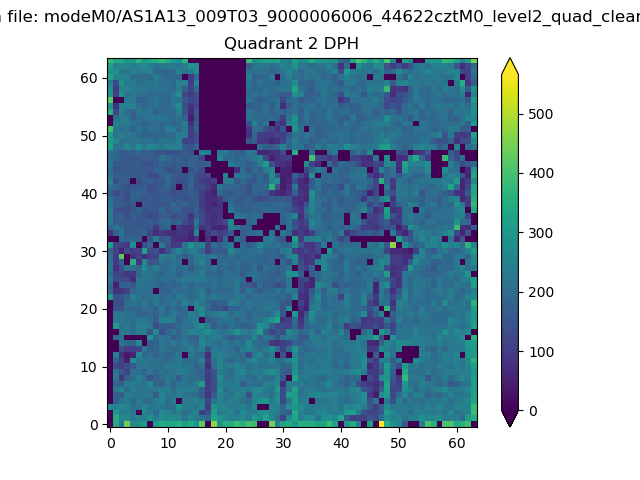
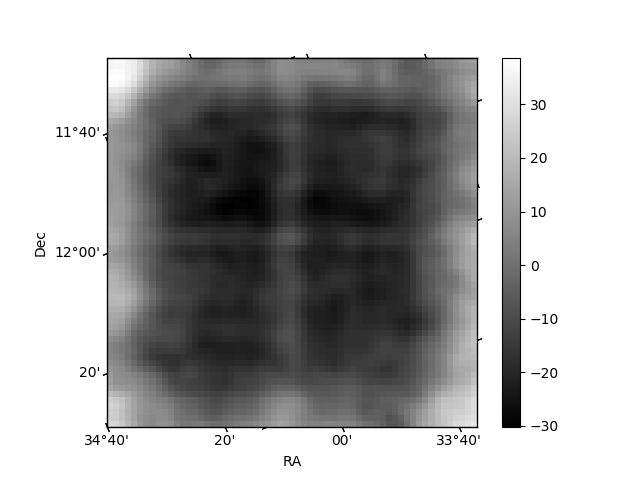
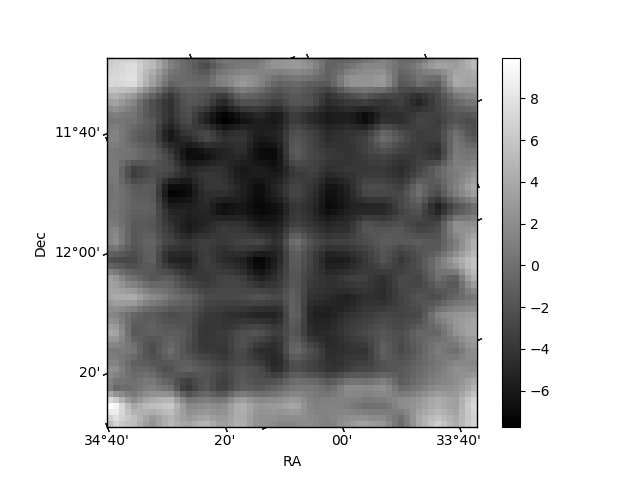
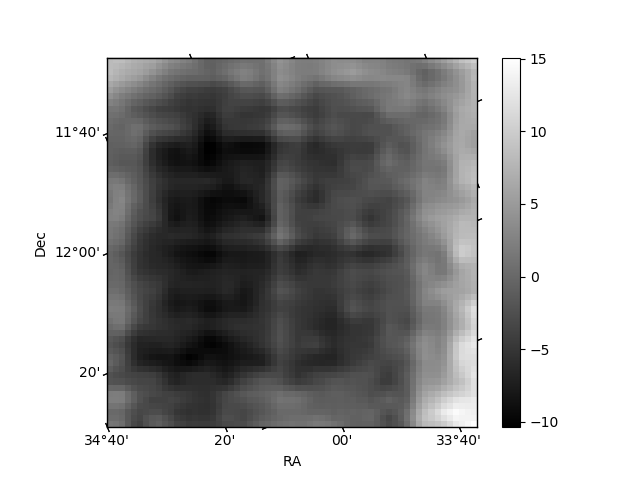
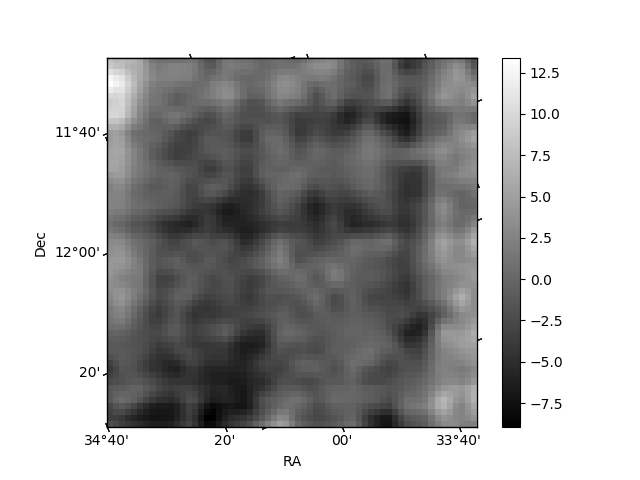
Histogram calculated using DETX and DETY for each event in the final _common_clean file
| Quadrant A | 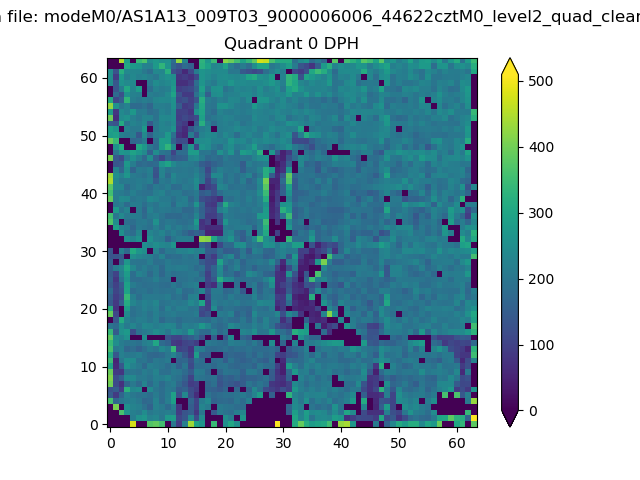 |
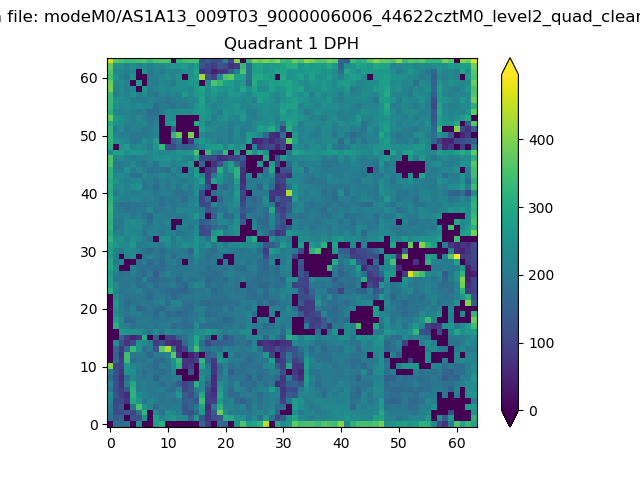 |
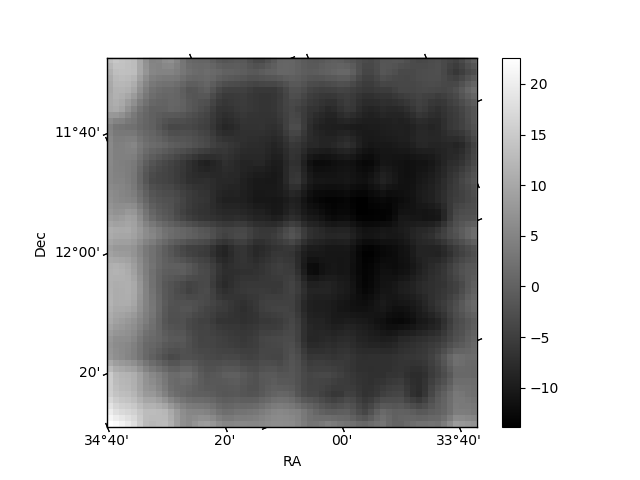
Quadrant B |
|---|---|---|---|
| Quadrant D | 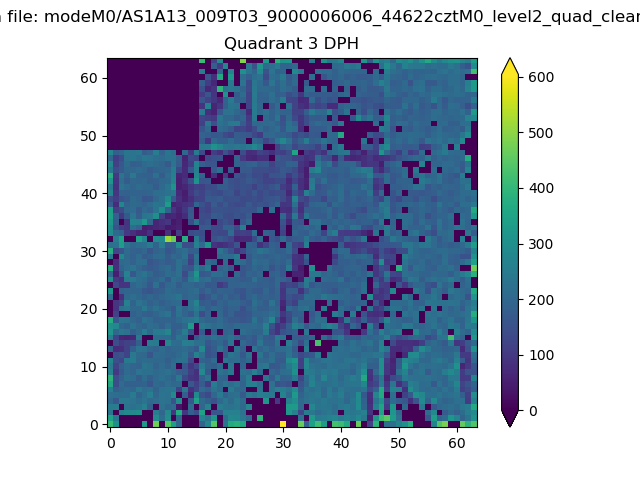 |
 |
Quadrant C |
| Plot type | Count rate plots | Images |
|---|---|---|
| Comparison with Poisson distribution Blue bars denote a histogram of data divided into 1 sec bins. Red curve is a Poisson curve with rate = median count rate of data. |
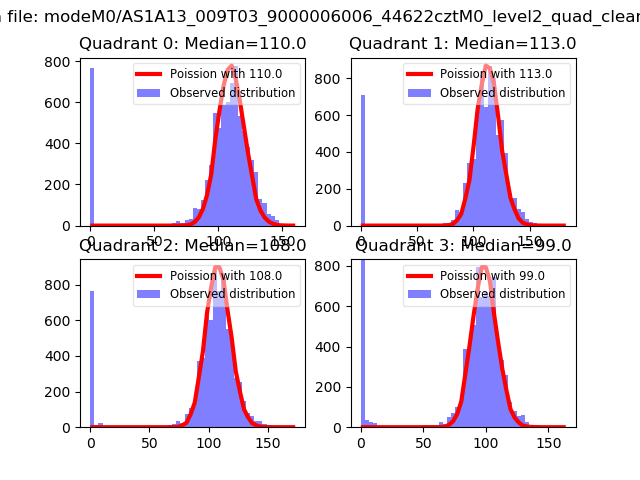 |
 |
| Quadrant-wise count rates Data is divided into 100 sec bins |
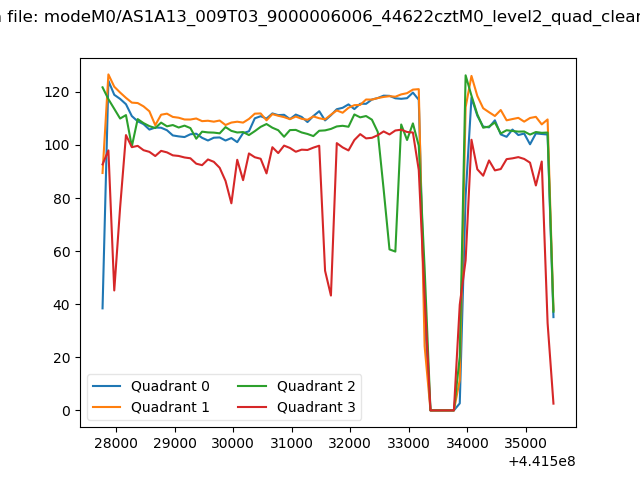 |
|
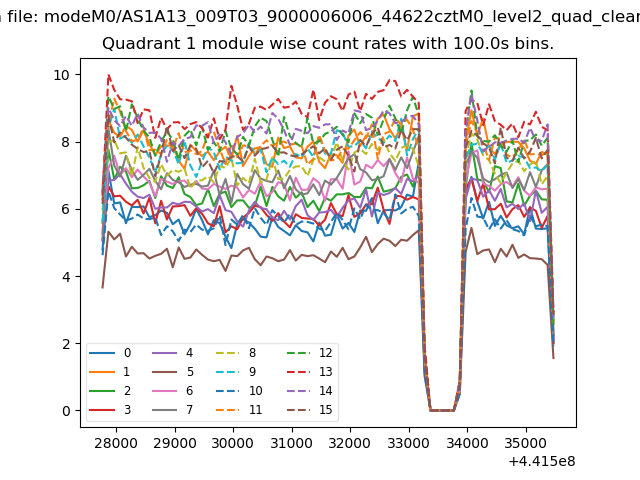
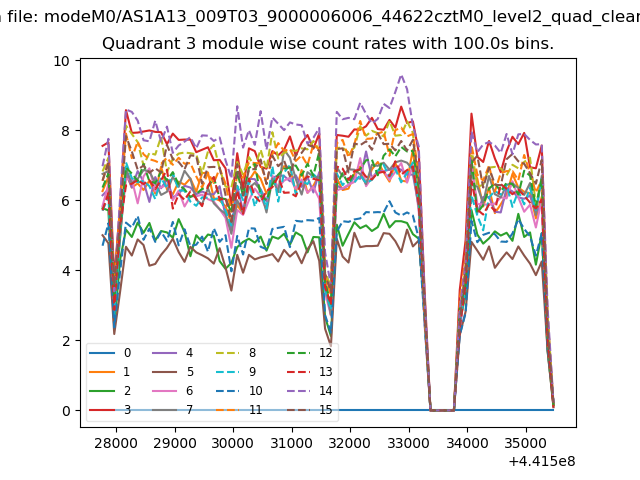
| Module-wise count rates for Quadrant A Data is divided into 100 sec bins |
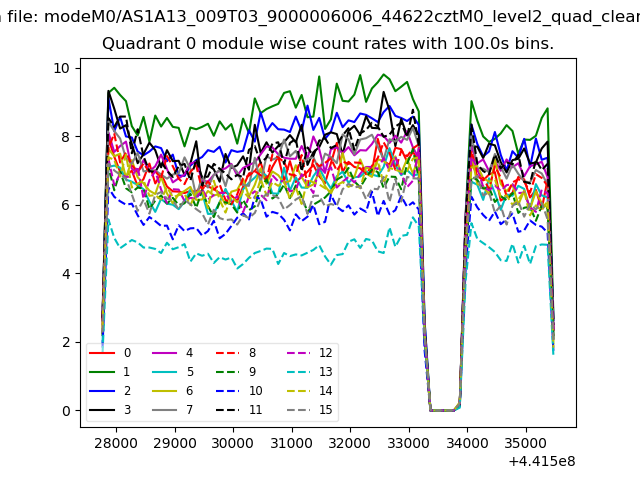 |
 |
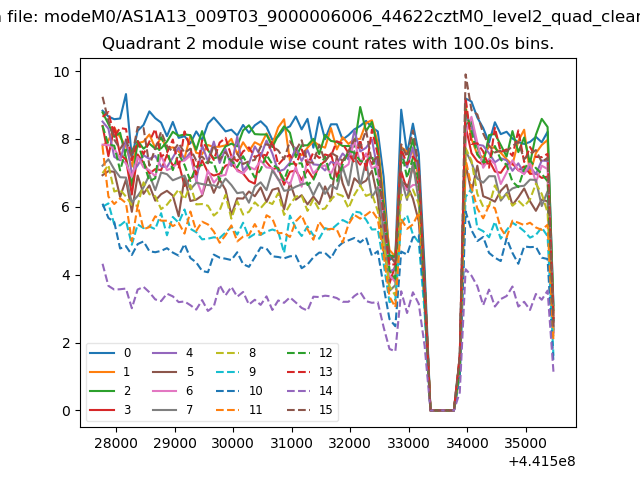
| Module-wise count rates for Quadrant B Data is divided into 100 sec bins |
 |
 |
| Module-wise count rates for Quadrant C Data is divided into 100 sec bins |
 |
 |
| Module-wise count rates for Quadrant D Data is divided into 100 sec bins |
 |
 |
| Parameter | Plot |
|---|---|
| CZT HV Monitor | 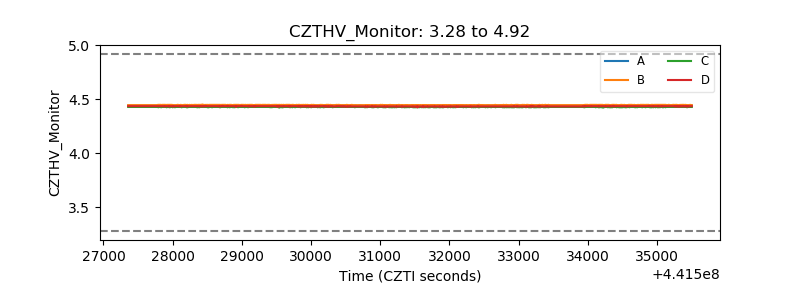 |
| D_VDD | 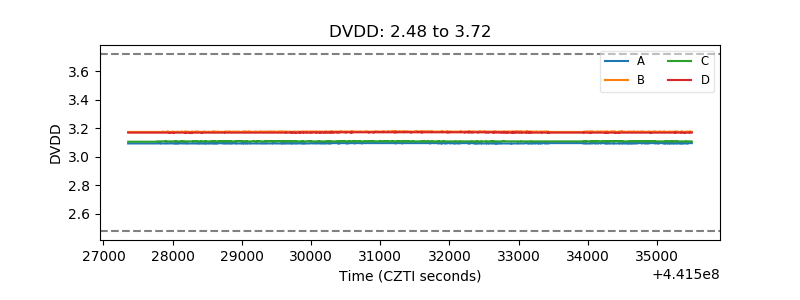 |
| Temperature 1 | 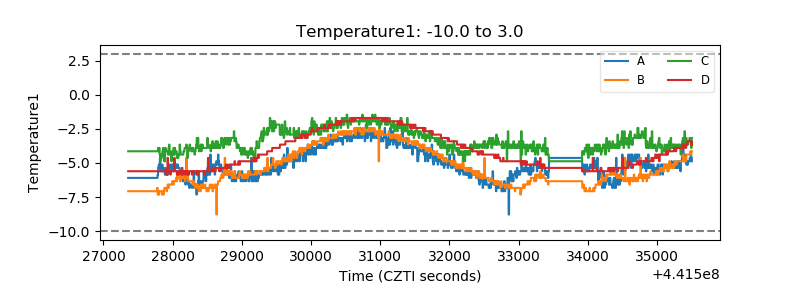 |
| Veto HV Monitor | 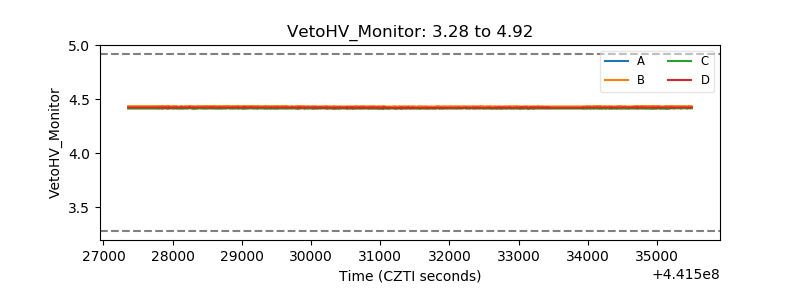 |
| Veto LLD | 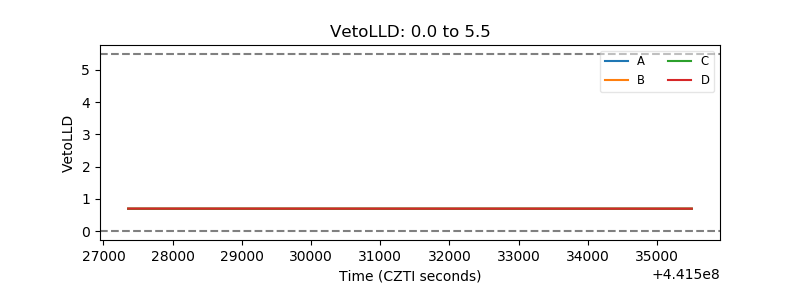 |
| Alpha Counter | 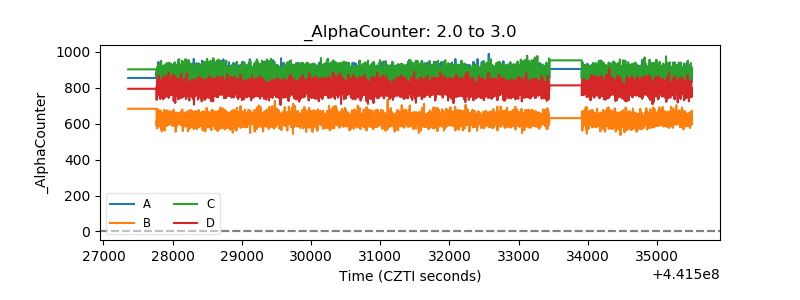 |
| _CPM_Rate | 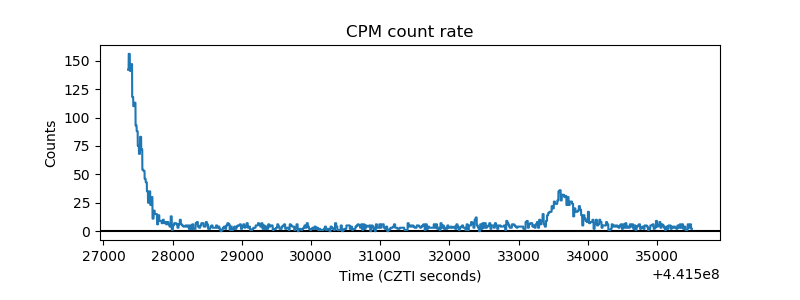 |
| CZT Counter | 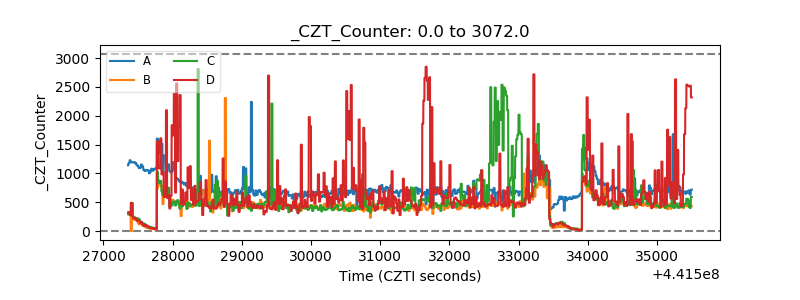 |
| +2.5 Volts monitor | 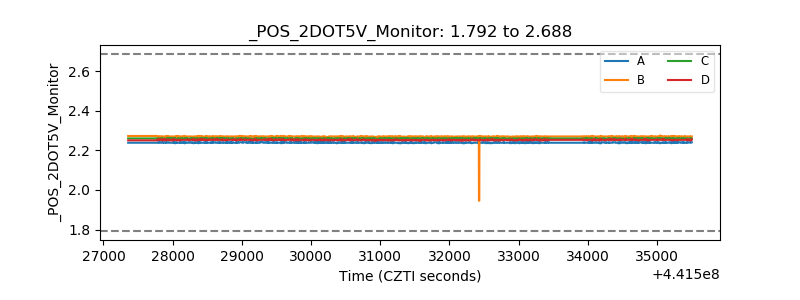 |
| +5 Volts monitor | 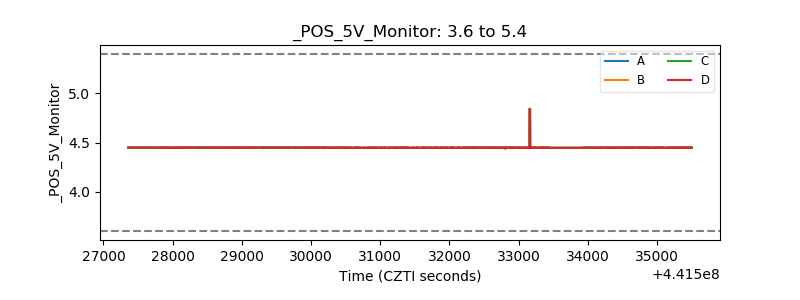 |
| _ROLL_ROT | 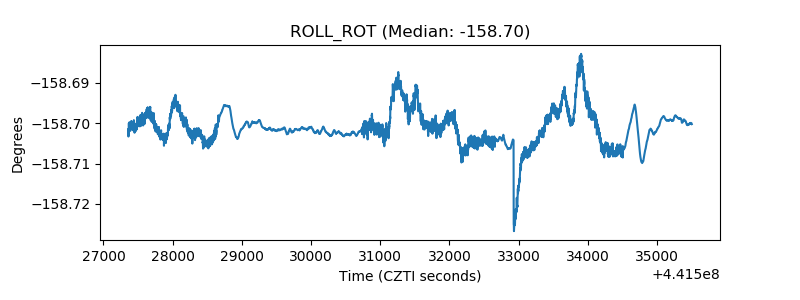 |
| _Roll_DEC |  |
| _Roll_RA | 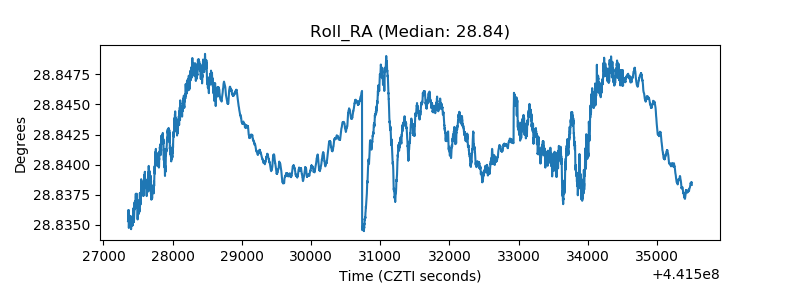 |
| Veto Counter | 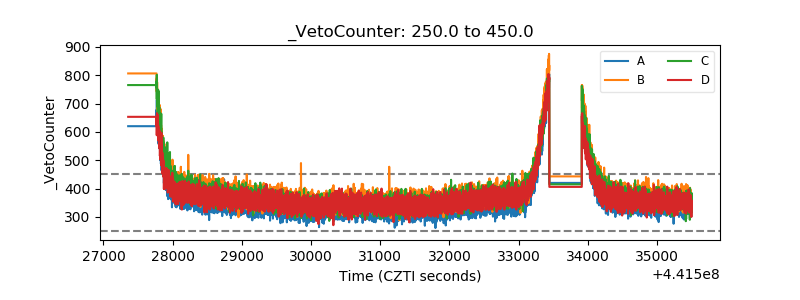 |