| Param | Original file | Final file |
|---|---|---|
| Filename | modeM0/AS1A13_080T04_9000006004_44579cztM0_level2.fits | modeM0/AS1A13_080T04_9000006004_44579cztM0_level2_quad_clean.evt |
| Size (bytes) | 612,855,360 | 113,656,320 |
| Size | 584.5 MB | 108.4 MB |
| Events in quadrant A | 5,356,576 | 778,674 |
| Events in quadrant B | 5,801,063 | 738,542 |
| Events in quadrant C | 4,786,699 | 728,609 |
| Events in quadrant D | 6,164,246 | 677,522 |
| Mode M9 | |||
|---|---|---|---|
| Quadrant | BADHDUFLAG | Total packets | Discarded packets |
| A | 0 | 1 | 0 |
| B | 0 | 1 | 0 |
| C | 0 | 1 | 0 |
| D | 0 | 1 | 0 |
| Mode SS | |||
|---|---|---|---|
| Quadrant | BADHDUFLAG | Total packets | Discarded packets |
| A | 0 | 150 | 0 |
| B | 0 | 150 | 0 |
| C | 0 | 150 | 0 |
| D | 0 | 150 | 0 |
| Mode M0 | |||
|---|---|---|---|
| Quadrant | BADHDUFLAG | Total packets | Discarded packets |
| A | 0 | 22416 | 1 |
| B | 0 | 22331 | 1 |
| C | 0 | 19451 | 1 |
| D | 0 | 23576 | 1 |
| Quadrant | Total seconds | Saturated seconds | Saturation percentage |
|---|---|---|---|
| A | 7441 | 398 | 5.348743% |
| B | 7442 | 1074 | 14.431604% |
| C | 7441 | 742 | 9.971778% |
| D | 7441 | 628 | 8.439726% |
Noise dominated data is calculated using 1-second bins in cleaned event files. If a bin has >2000 counts, and if more than 50% of those come from <1% of pixels, then it is considered to be noise-dominated and hence unusable.
| Quadrant | # 1 sec bins | Bins with >0 counts | Bins with >2000 counts | High rate bins dominated by noise | Noise dominated (total time) | Noise dominated (detector-on time) | Marked lightcurve |
|---|---|---|---|---|---|---|---|
| A | 7456 | 7441 | 9 | 9 | 0.12% | 0.12% | 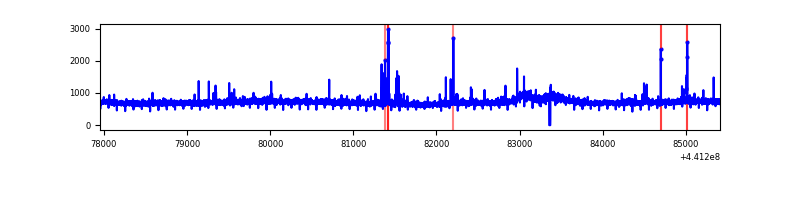 |
| B | 7457 | 7443 | 521 | 521 | 6.99% | 7.00% | 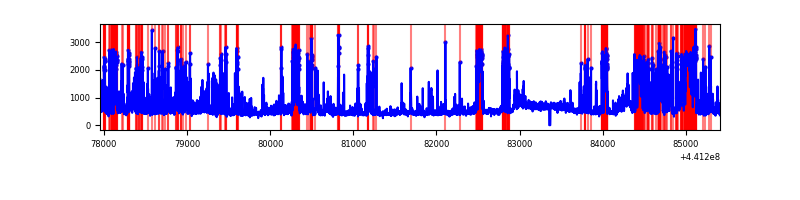 |
| C | 7455 | 7441 | 315 | 315 | 4.23% | 4.23% | 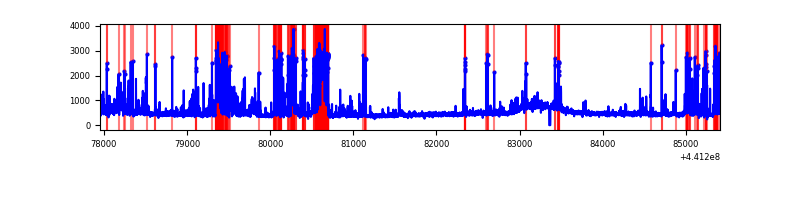 |
| D | 7456 | 7441 | 362 | 362 | 4.86% | 4.86% | 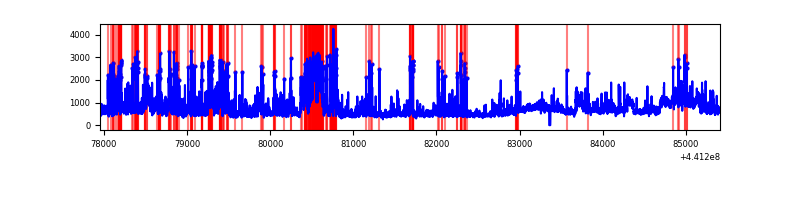 |
Top three noisy pixels from each quadrant. If the there are fewer than three noisy pixels in the level2.evt file, extra rows are filled as -1
| Pixel properties | Quadrant properties | ||||||
|---|---|---|---|---|---|---|---|
| Quadrant | DetID | PixID | Counts | Sigma | Mean | Median | Sigma |
| A | 10 | 83 | 1954983 | 11017.84 | 847 | 828 | 177.4 |
| A | 10 | 248 | 70073 | 390.41 | 847 | 828 | 177.4 |
| A | 13 | 248 | 27021 | 147.68 | 847 | 828 | 177.4 |
| B | 0 | 189 | 873700 | 5487.71 | 812 | 785 | 159.1 |
| B | 5 | 172 | 866622 | 5443.21 | 812 | 785 | 159.1 |
| B | 4 | 171 | 530597 | 3330.74 | 812 | 785 | 159.1 |
| C | 15 | 208 | 1313488 | 6976.62 | 802 | 803 | 188.2 |
| C | 14 | 254 | 144894 | 765.81 | 802 | 803 | 188.2 |
| C | 12 | 249 | 60403 | 316.76 | 802 | 803 | 188.2 |
| D | 13 | 249 | 1015128 | 4931.0 | 822 | 793 | 205.7 |
| D | 1 | 52 | 867666 | 4214.14 | 822 | 793 | 205.7 |
| D | 13 | 174 | 765395 | 3716.97 | 822 | 793 | 205.7 |
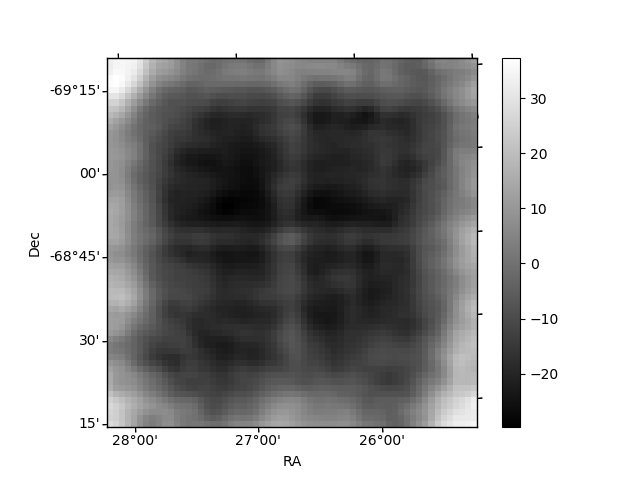
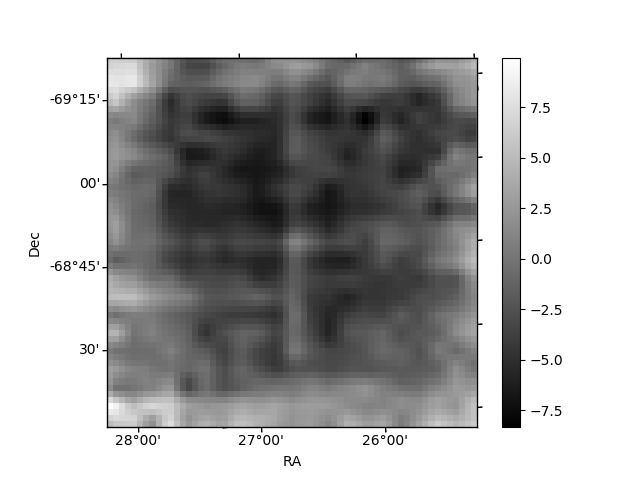
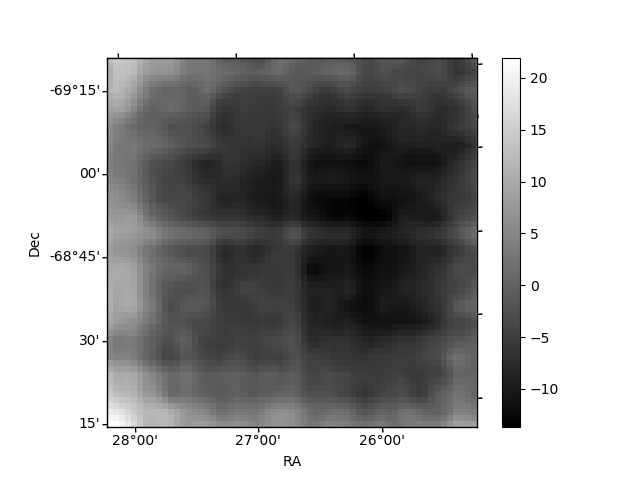
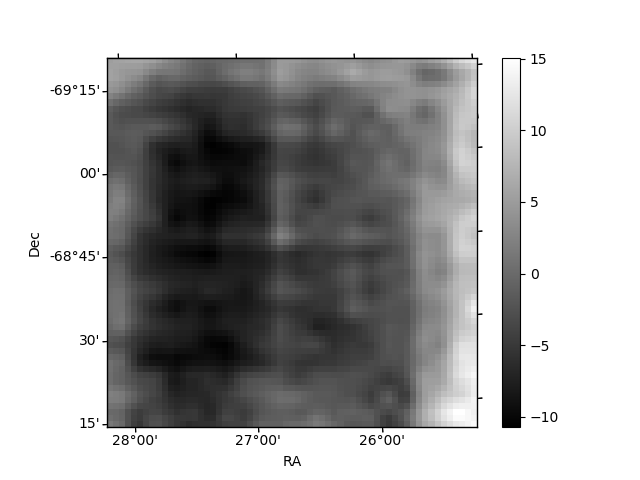
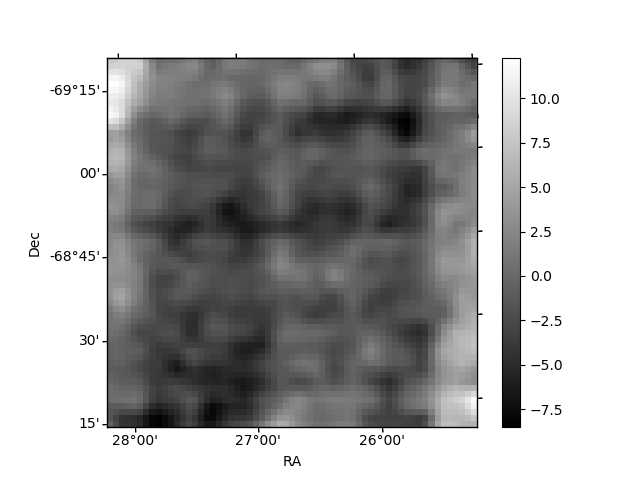
Histogram calculated using DETX and DETY for each event in the final _common_clean file
| Quadrant A | 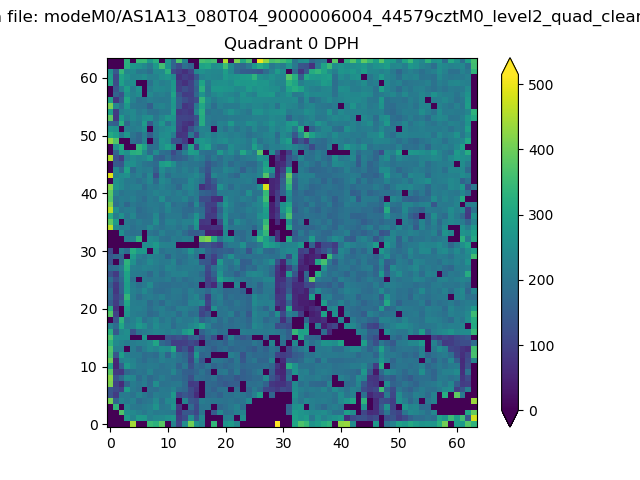 |
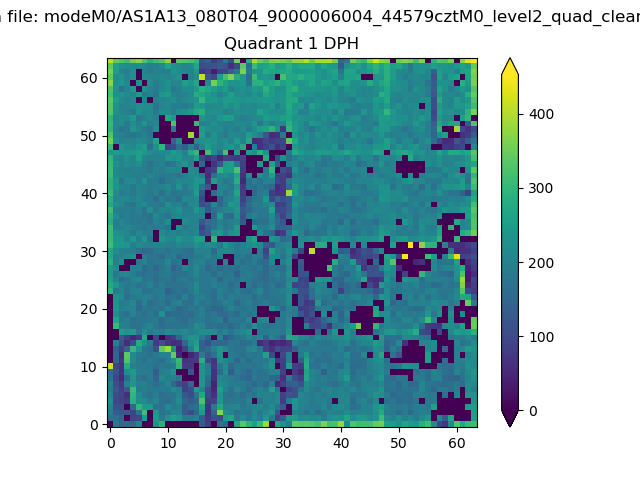 |
Quadrant B |
|---|---|---|---|
| Quadrant D | 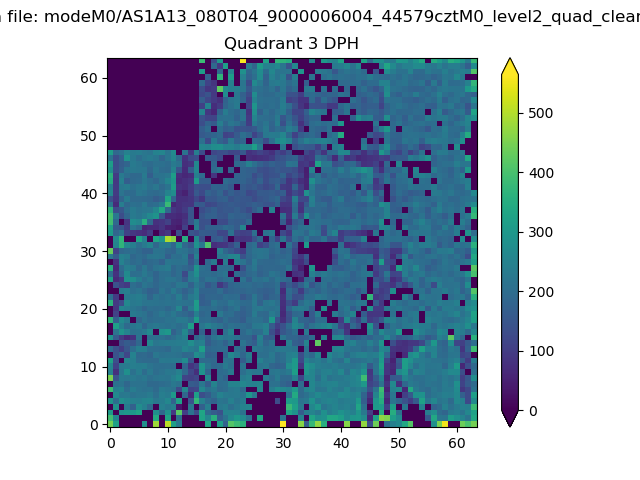 |
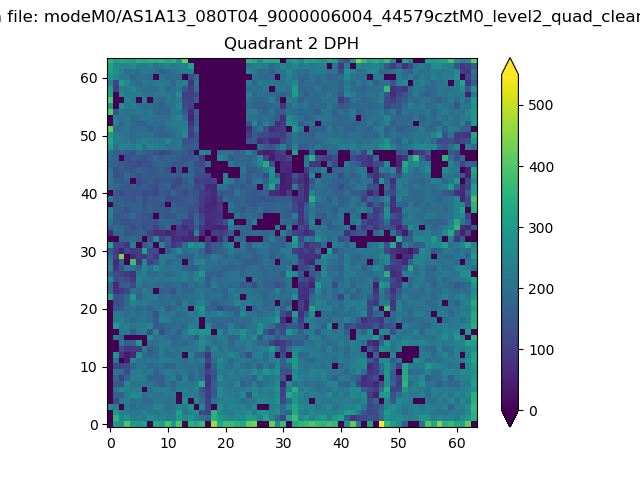 |
Quadrant C |
| Plot type | Count rate plots | Images |
|---|---|---|
| Comparison with Poisson distribution Blue bars denote a histogram of data divided into 1 sec bins. Red curve is a Poisson curve with rate = median count rate of data. |
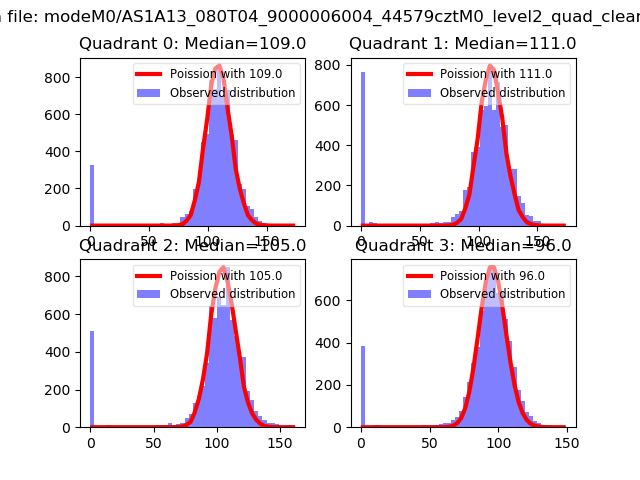 |
 |
| Quadrant-wise count rates Data is divided into 100 sec bins |
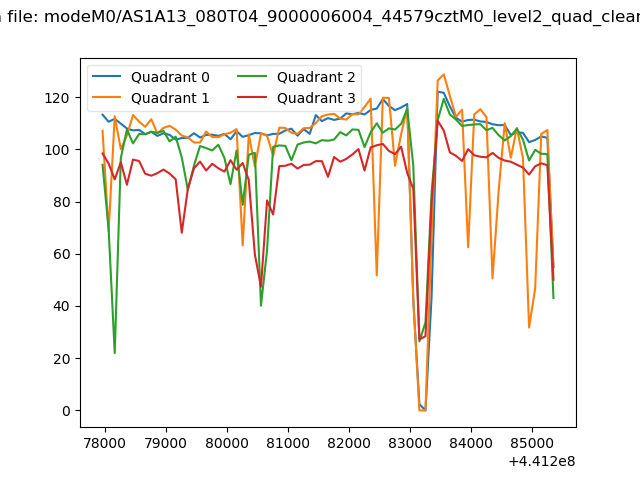 |
|
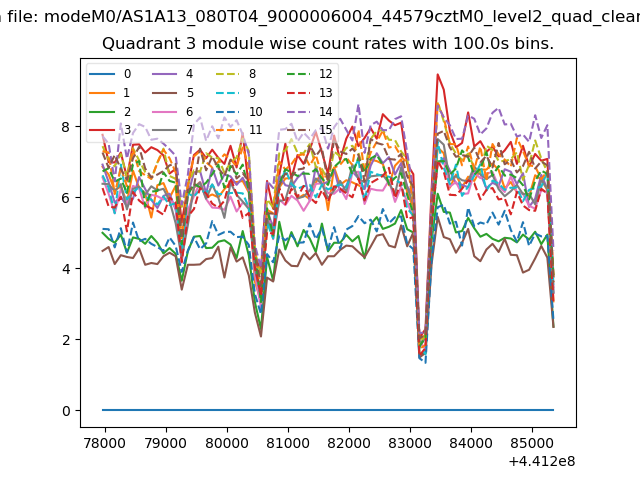
| Module-wise count rates for Quadrant A Data is divided into 100 sec bins |
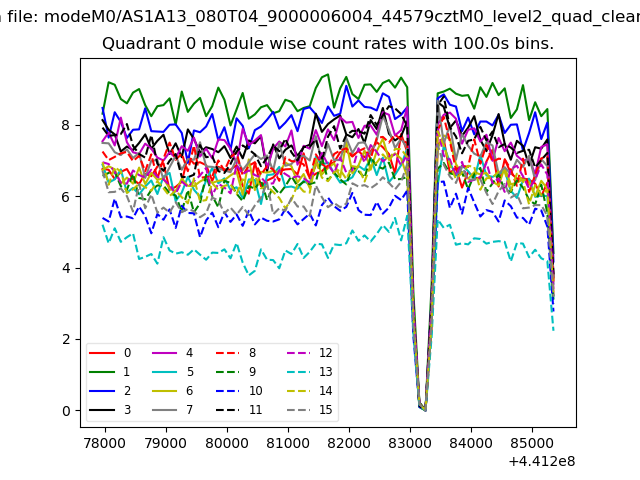 |
 |
| Module-wise count rates for Quadrant B Data is divided into 100 sec bins |
 |
 |
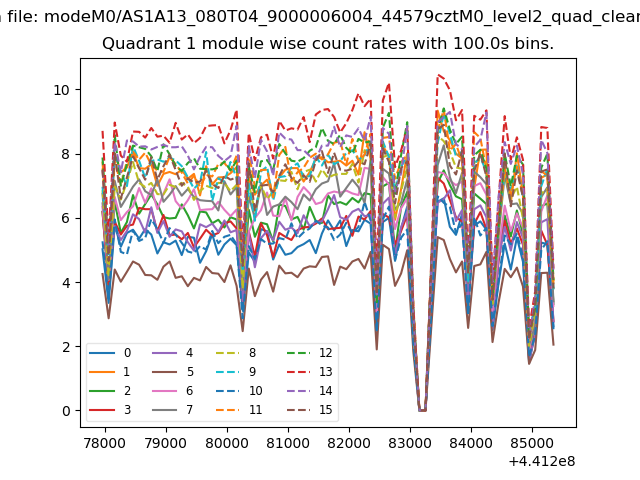
| Module-wise count rates for Quadrant C Data is divided into 100 sec bins |
 |
 |
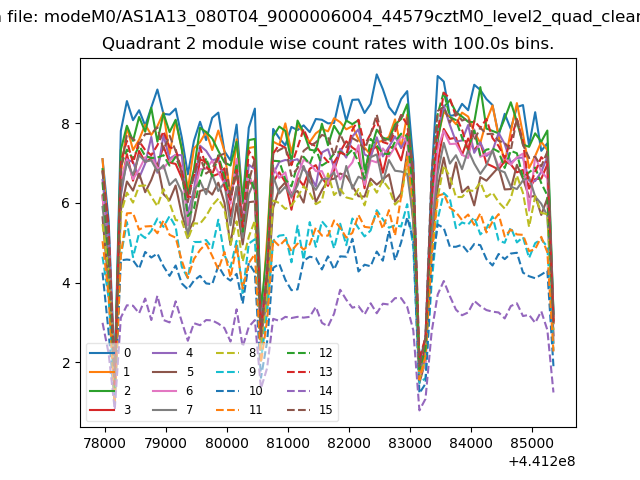
| Module-wise count rates for Quadrant D Data is divided into 100 sec bins |
 |
 |
| Parameter | Plot |
|---|---|
| CZT HV Monitor | 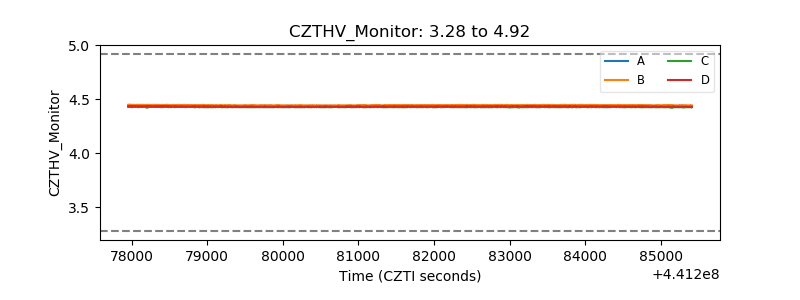 |
| D_VDD | 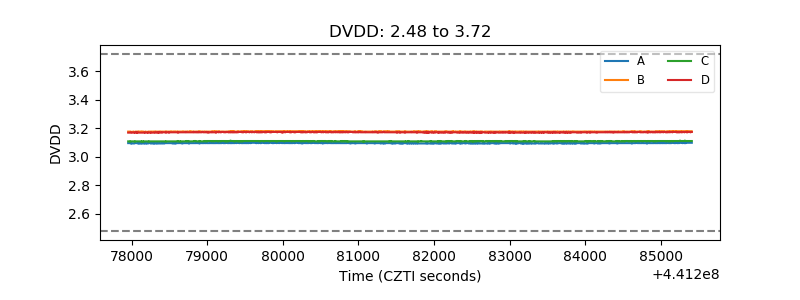 |
| Temperature 1 | 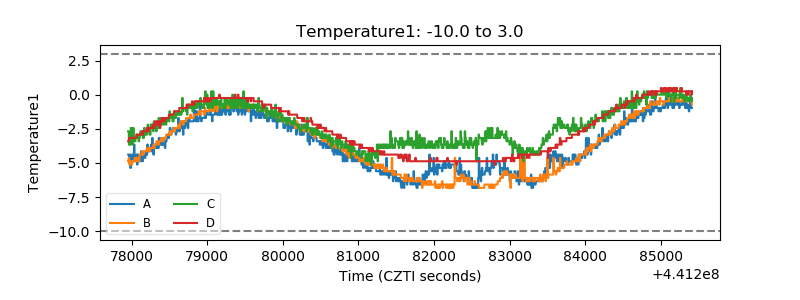 |
| Veto HV Monitor | 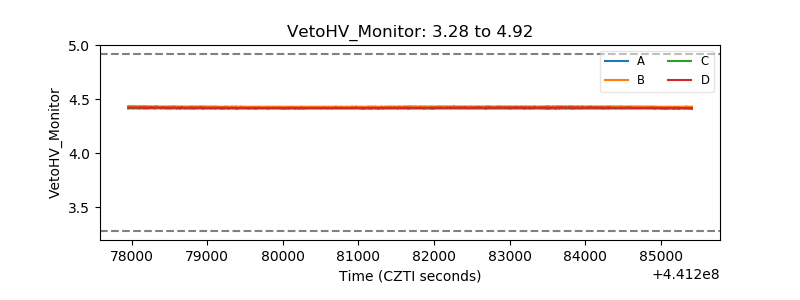 |
| Veto LLD | 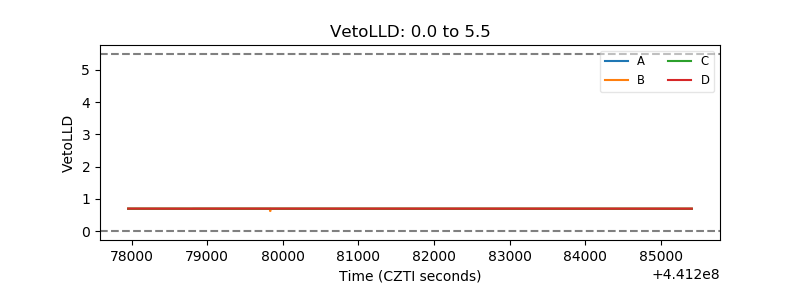 |
| Alpha Counter | 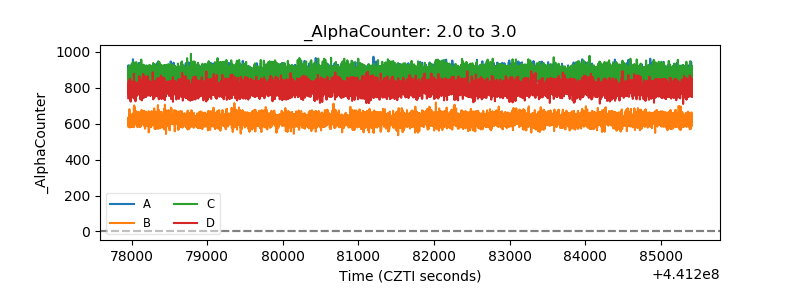 |
| _CPM_Rate | 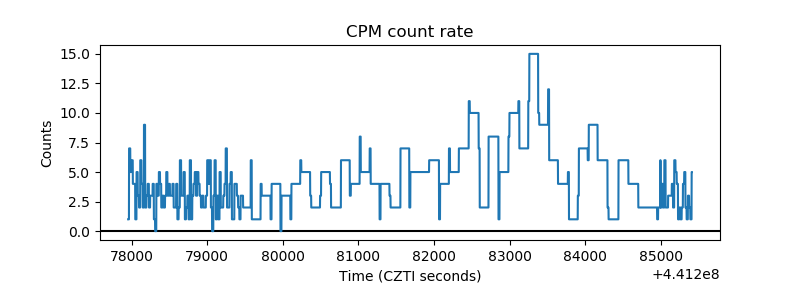 |
| CZT Counter | 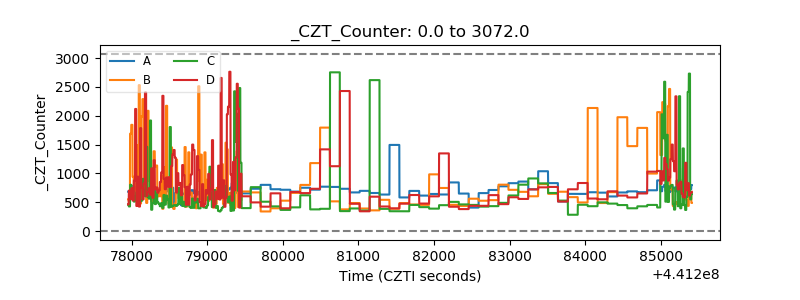 |
| +2.5 Volts monitor | 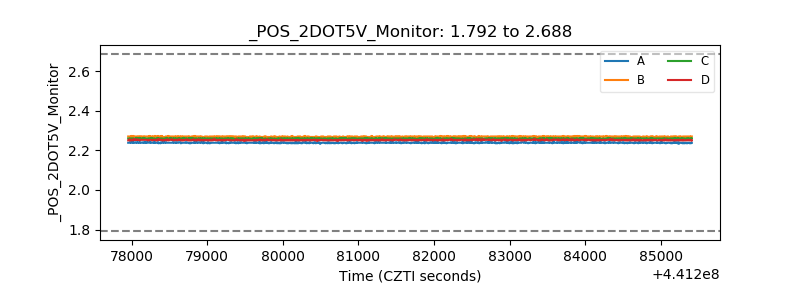 |
| +5 Volts monitor | 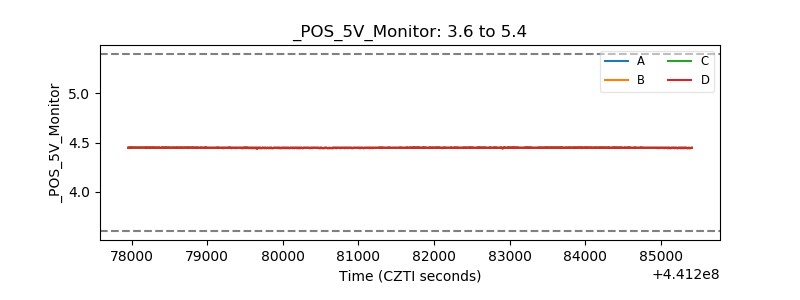 |
| _ROLL_ROT | 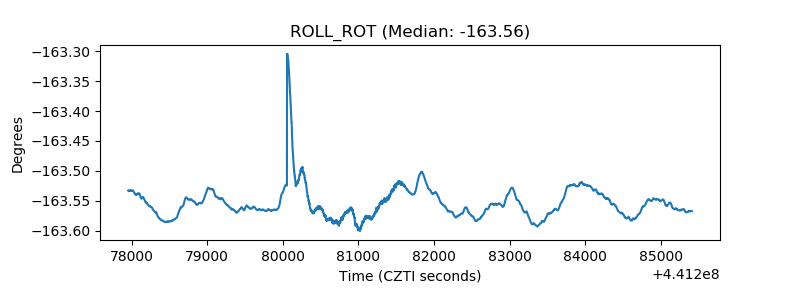 |
| _Roll_DEC | 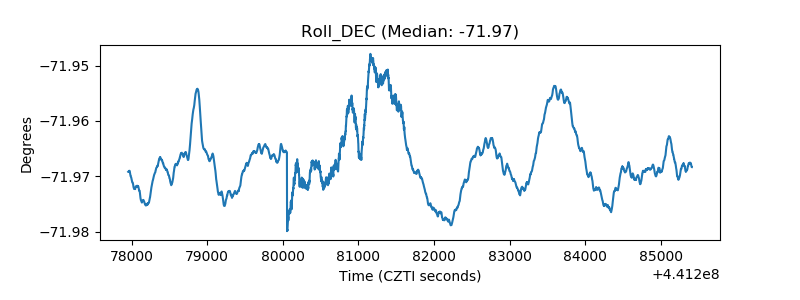 |
| _Roll_RA | 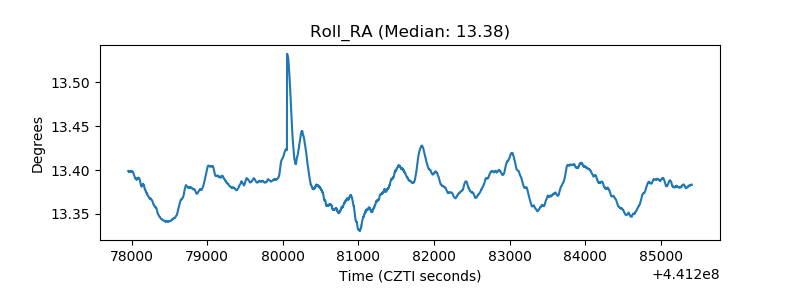 |
| Veto Counter | 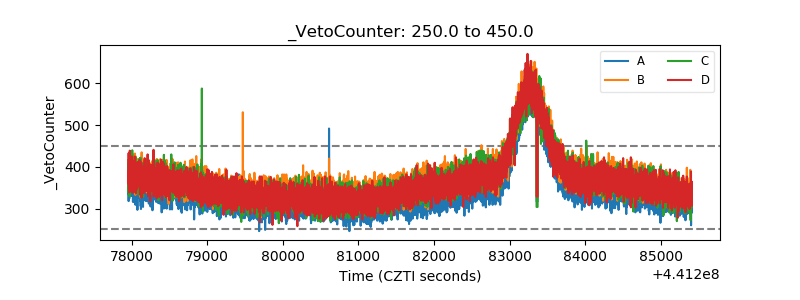 |