| Param | Original file | Final file |
|---|---|---|
| Filename | modeM0/AS1A13_080T04_9000006004_44580cztM0_level2.fits | modeM0/AS1A13_080T04_9000006004_44580cztM0_level2_quad_clean.evt |
| Size (bytes) | 682,038,720 | 115,816,320 |
| Size | 650.4 MB | 110.5 MB |
| Events in quadrant A | 5,523,348 | 823,882 |
| Events in quadrant B | 5,058,166 | 799,851 |
| Events in quadrant C | 6,488,800 | 686,338 |
| Events in quadrant D | 7,590,010 | 669,792 |
| Mode SS | |||
|---|---|---|---|
| Quadrant | BADHDUFLAG | Total packets | Discarded packets |
| A | 0 | 150 | 0 |
| B | 0 | 150 | 0 |
| C | 0 | 150 | 0 |
| D | 0 | 150 | 0 |
| Mode M0 | |||
|---|---|---|---|
| Quadrant | BADHDUFLAG | Total packets | Discarded packets |
| A | 0 | 22858 | 0 |
| B | 0 | 20027 | 3 |
| C | 0 | 24496 | 1 |
| D | 0 | 27848 | 5 |
| Quadrant | Total seconds | Saturated seconds | Saturation percentage |
|---|---|---|---|
| A | 7575 | 46 | 0.607261% |
| B | 7574 | 509 | 6.720359% |
| C | 7575 | 1126 | 14.864686% |
| D | 7575 | 793 | 10.468647% |
Noise dominated data is calculated using 1-second bins in cleaned event files. If a bin has >2000 counts, and if more than 50% of those come from <1% of pixels, then it is considered to be noise-dominated and hence unusable.
| Quadrant | # 1 sec bins | Bins with >0 counts | Bins with >2000 counts | High rate bins dominated by noise | Noise dominated (total time) | Noise dominated (detector-on time) | Marked lightcurve |
|---|---|---|---|---|---|---|---|
| A | 7575 | 7575 | 20 | 20 | 0.26% | 0.26% | 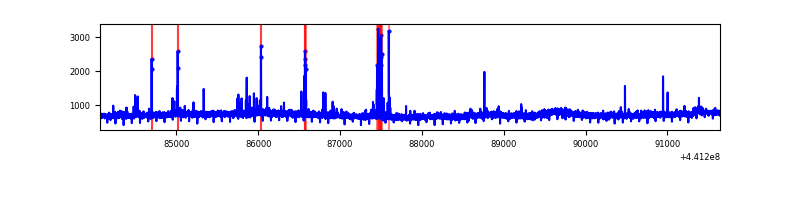 |
| B | 7576 | 7575 | 352 | 352 | 4.65% | 4.65% | 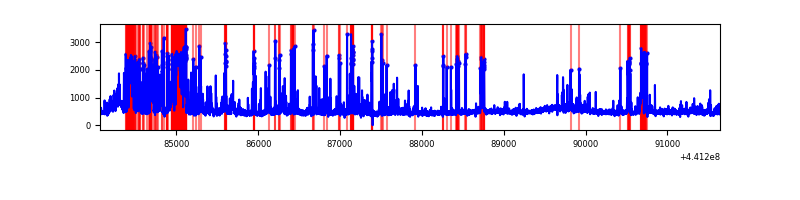 |
| C | 7576 | 7576 | 926 | 926 | 12.22% | 12.22% | 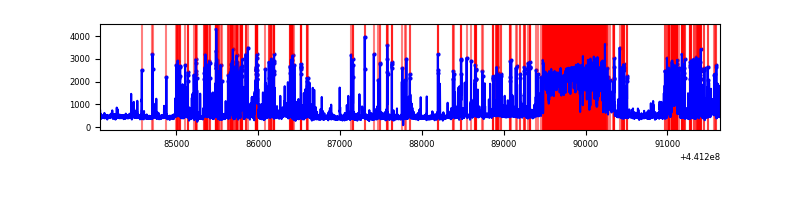 |
| D | 7575 | 7575 | 794 | 794 | 10.48% | 10.48% | 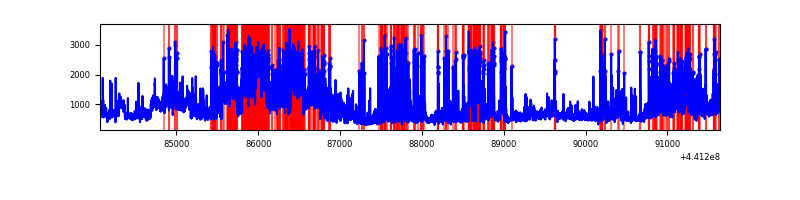 |
Top three noisy pixels from each quadrant. If the there are fewer than three noisy pixels in the level2.evt file, extra rows are filled as -1
| Pixel properties | Quadrant properties | ||||||
|---|---|---|---|---|---|---|---|
| Quadrant | DetID | PixID | Counts | Sigma | Mean | Median | Sigma |
| A | 10 | 83 | 2082899 | 11779.27 | 842 | 823 | 176.8 |
| A | 10 | 248 | 72674 | 406.49 | 842 | 823 | 176.8 |
| A | 13 | 248 | 57824 | 322.48 | 842 | 823 | 176.8 |
| B | 0 | 189 | 818127 | 5183.0 | 813 | 789 | 157.7 |
| B | 5 | 172 | 413813 | 2619.11 | 813 | 789 | 157.7 |
| B | 4 | 171 | 293581 | 1856.69 | 813 | 789 | 157.7 |
| C | 15 | 208 | 2557265 | 14422.84 | 761 | 765 | 177.3 |
| C | 12 | 2 | 386975 | 2178.86 | 761 | 765 | 177.3 |
| C | 14 | 254 | 304316 | 1712.52 | 761 | 765 | 177.3 |
| D | 13 | 174 | 1303937 | 6671.3 | 781 | 756 | 195.3 |
| D | 13 | 249 | 1108143 | 5668.99 | 781 | 756 | 195.3 |
| D | 1 | 52 | 1080903 | 5529.54 | 781 | 756 | 195.3 |
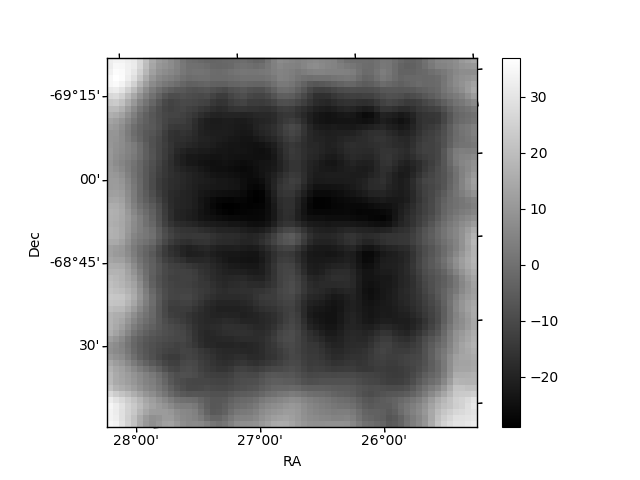
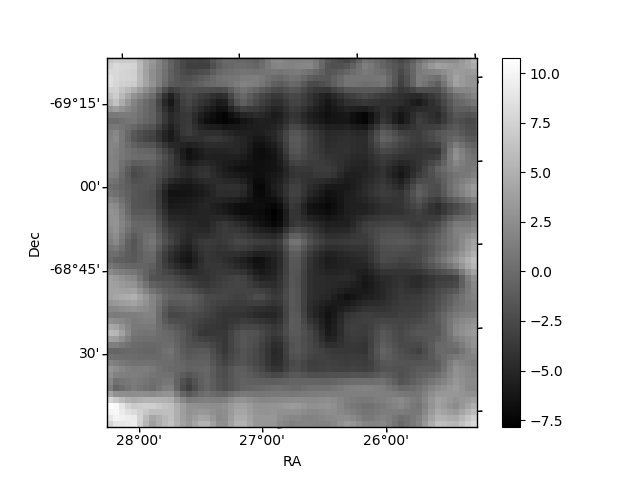
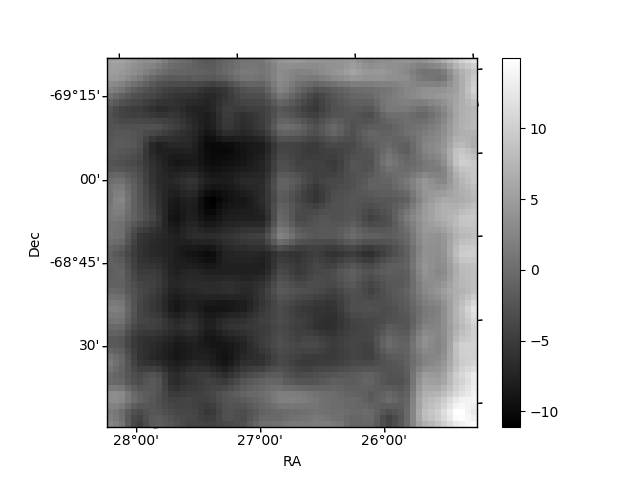
Histogram calculated using DETX and DETY for each event in the final _common_clean file
| Quadrant A | 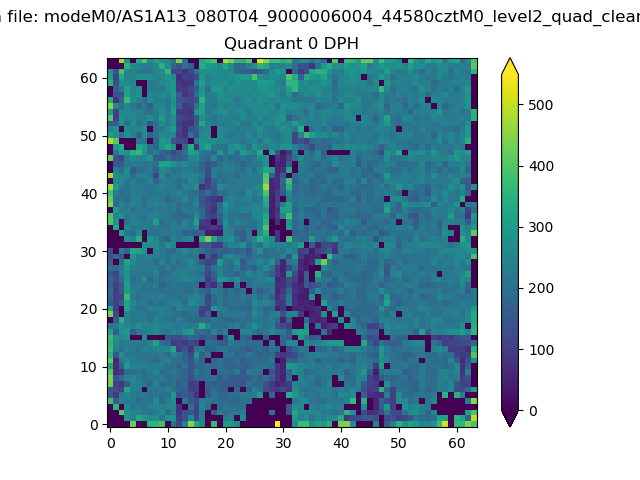 |
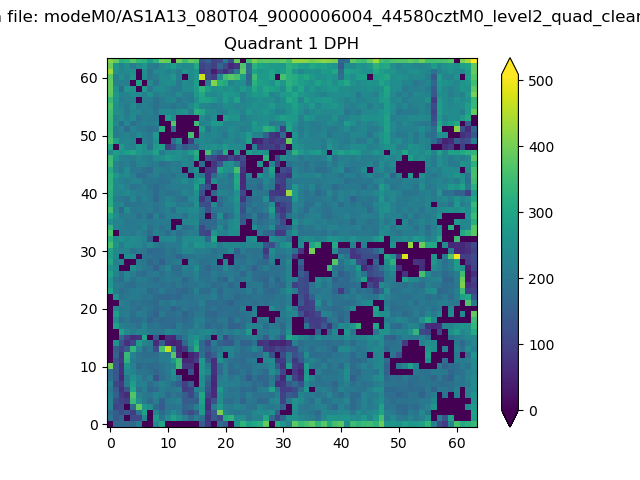 |
Quadrant B |
|---|---|---|---|
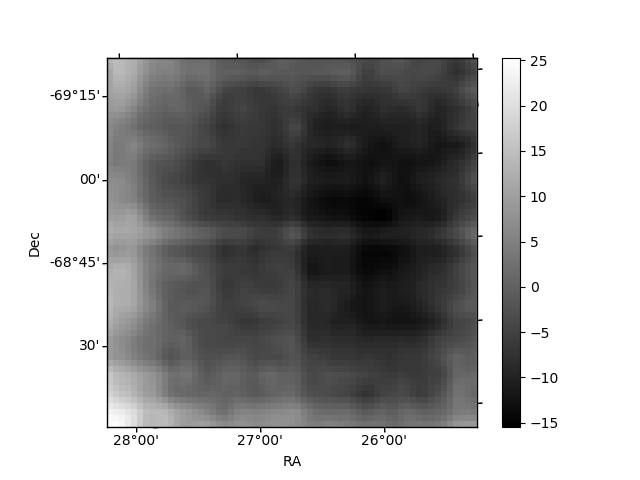
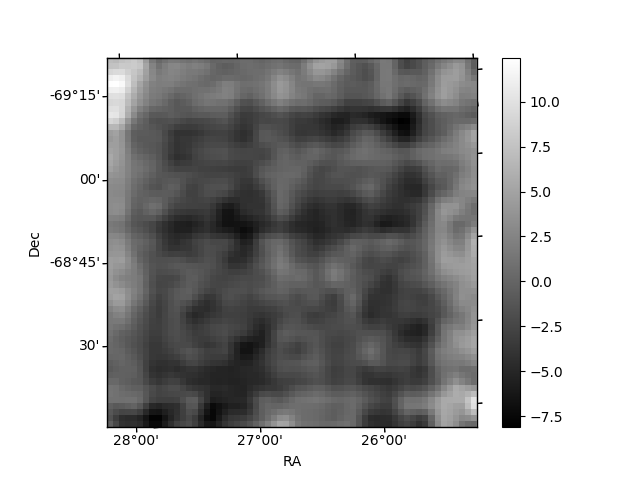
| Quadrant D | 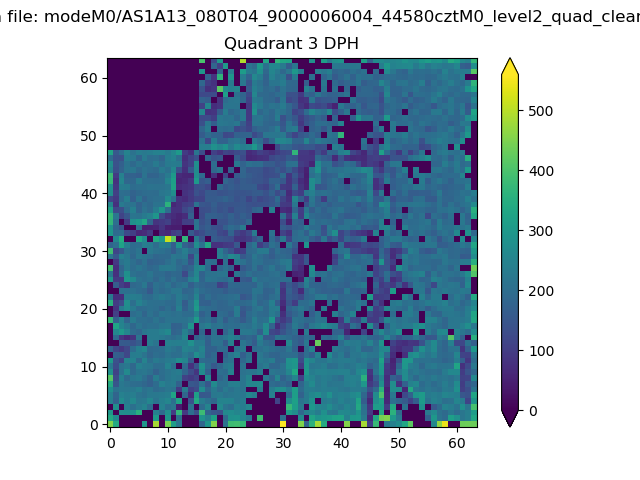 |
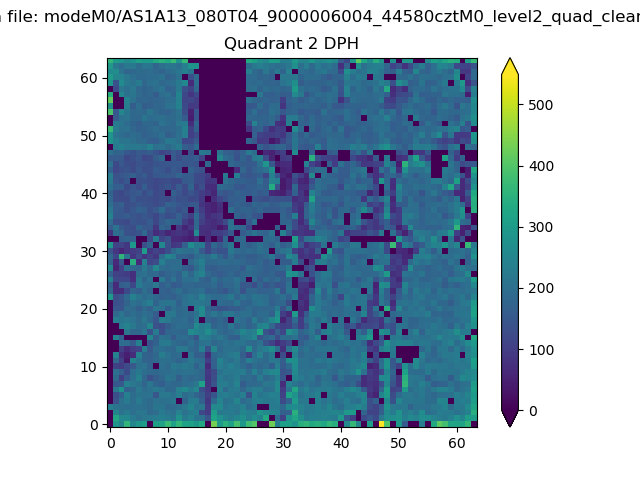 |
Quadrant C |
| Plot type | Count rate plots | Images |
|---|---|---|
| Comparison with Poisson distribution Blue bars denote a histogram of data divided into 1 sec bins. Red curve is a Poisson curve with rate = median count rate of data. |
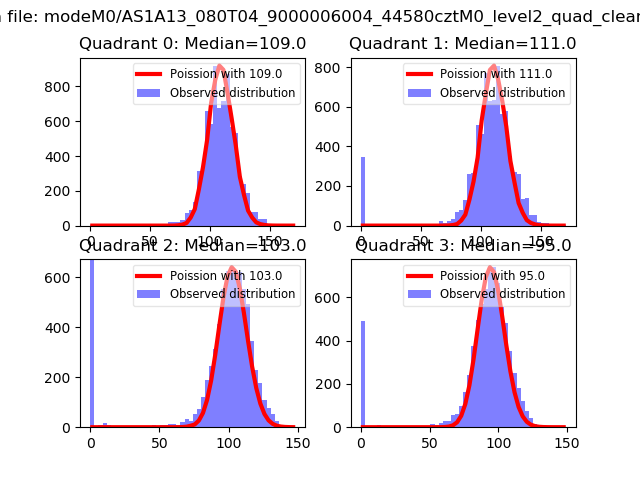 |
 |
| Quadrant-wise count rates Data is divided into 100 sec bins |
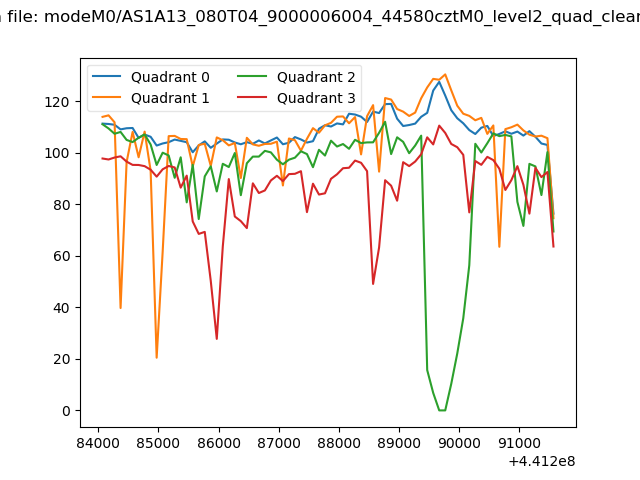 |
|
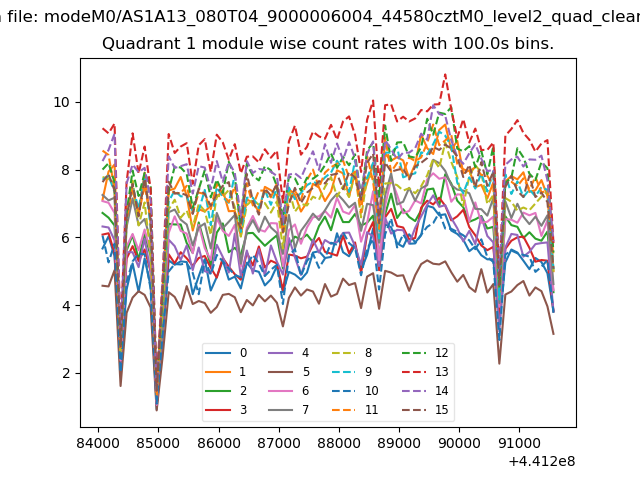
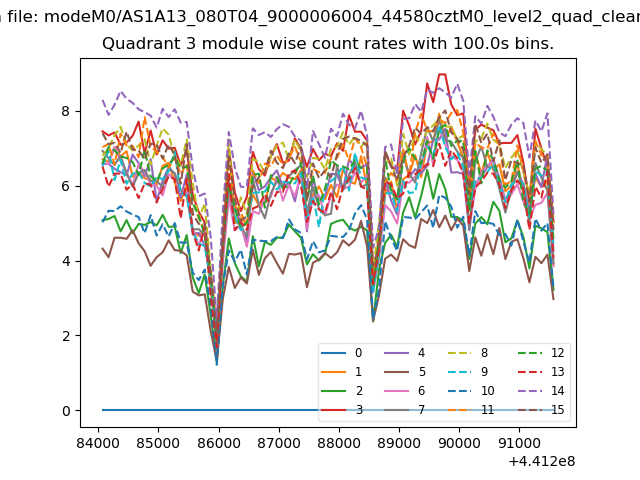
| Module-wise count rates for Quadrant A Data is divided into 100 sec bins |
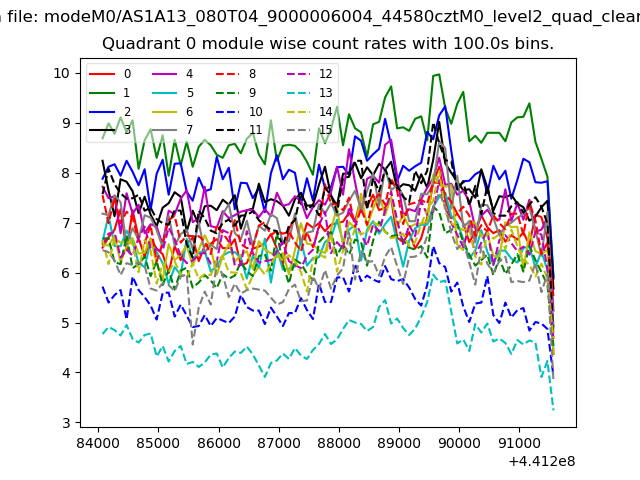 |
 |
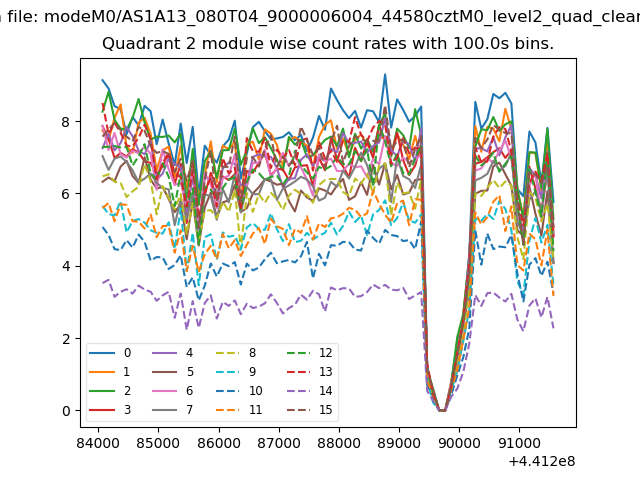
| Module-wise count rates for Quadrant B Data is divided into 100 sec bins |
 |
 |
| Module-wise count rates for Quadrant C Data is divided into 100 sec bins |
 |
 |
| Module-wise count rates for Quadrant D Data is divided into 100 sec bins |
 |
 |
| Parameter | Plot |
|---|---|
| CZT HV Monitor | 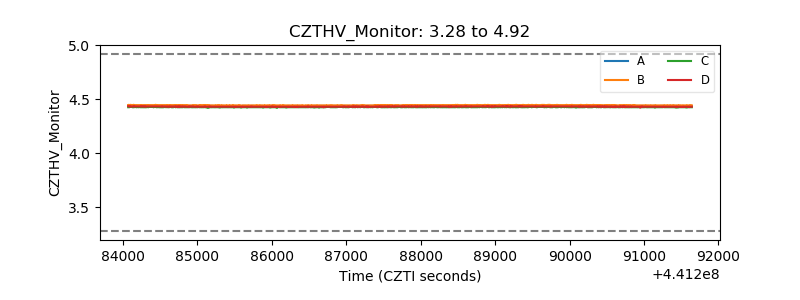 |
| D_VDD | 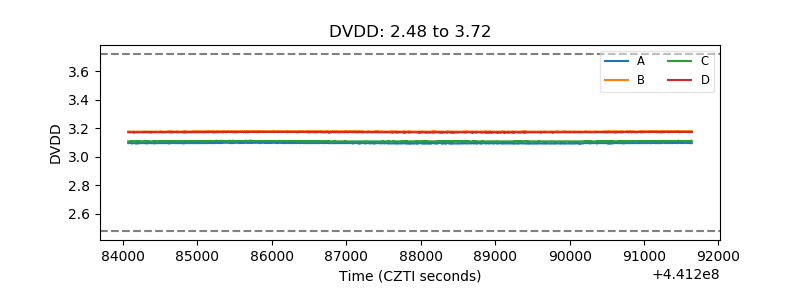 |
| Temperature 1 | 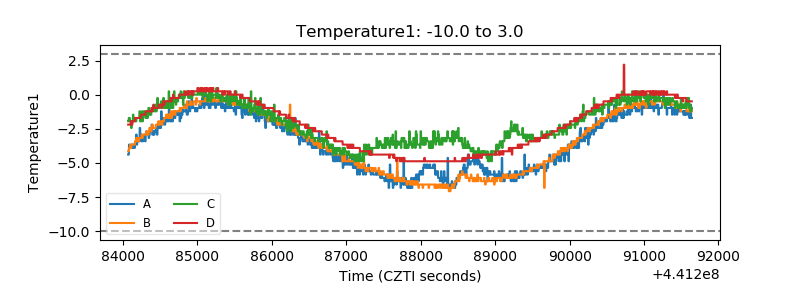 |
| Veto HV Monitor | 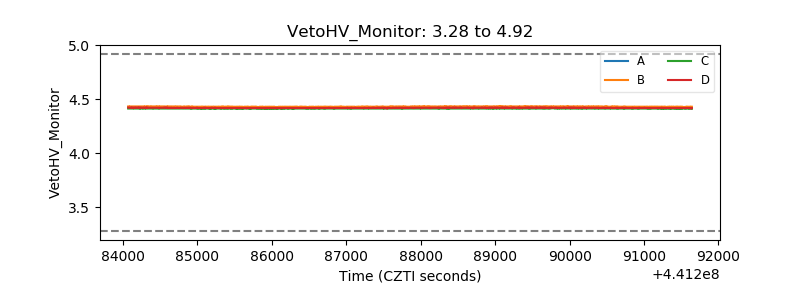 |
| Veto LLD | 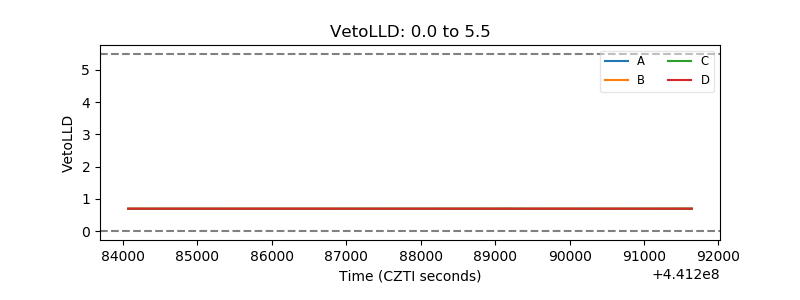 |
| Alpha Counter | 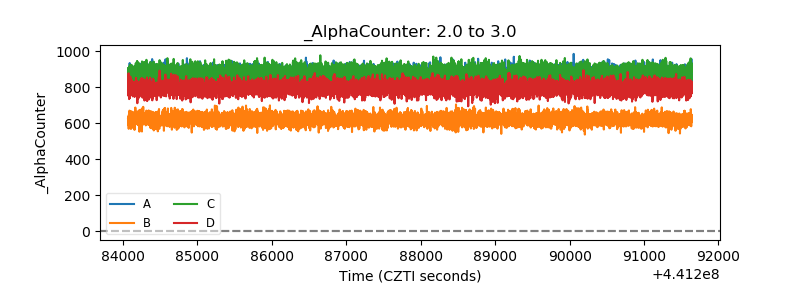 |
| _CPM_Rate | 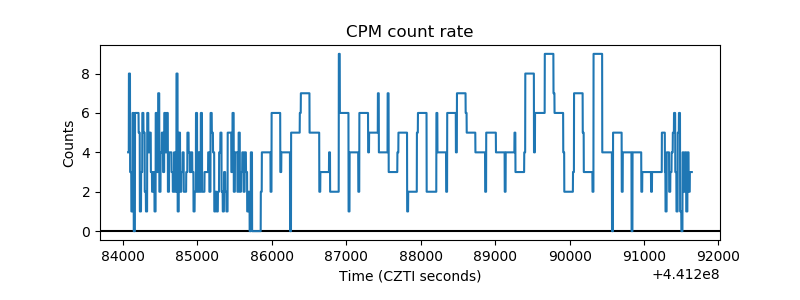 |
| CZT Counter | 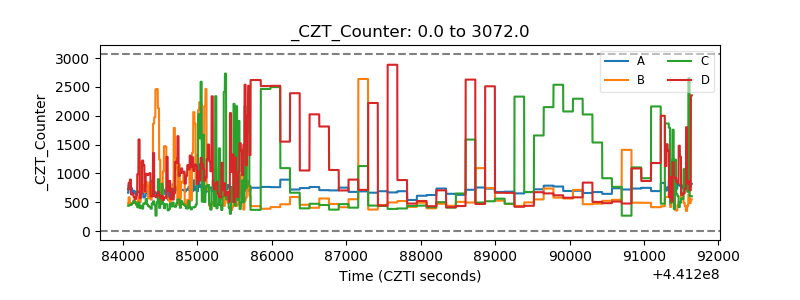 |
| +2.5 Volts monitor | 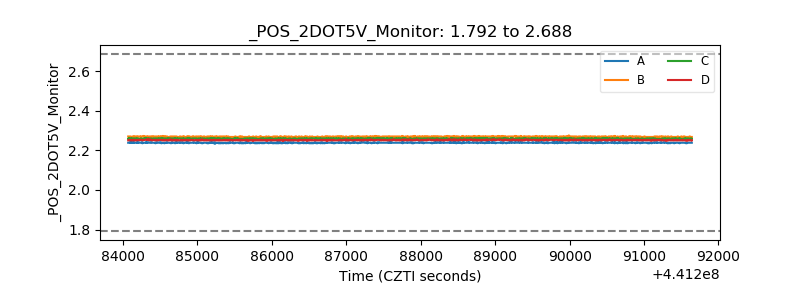 |
| +5 Volts monitor | 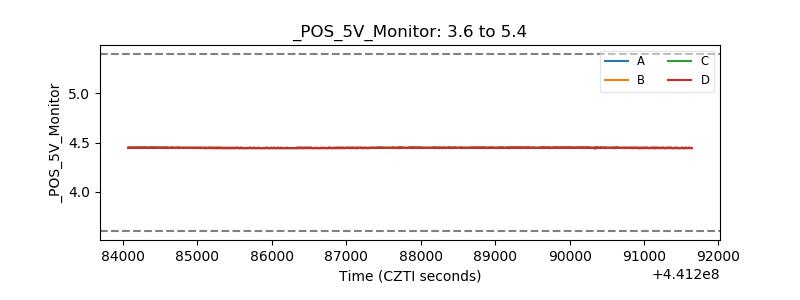 |
| _ROLL_ROT | 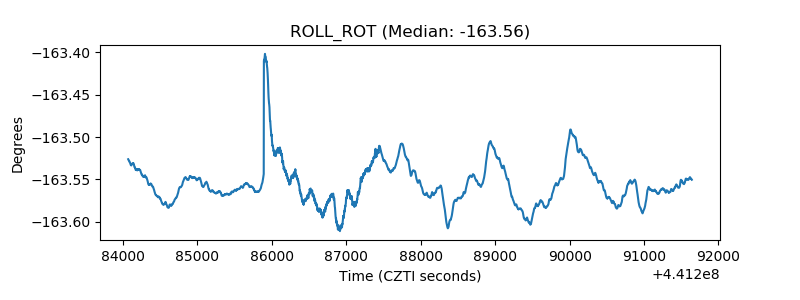 |
| _Roll_DEC | 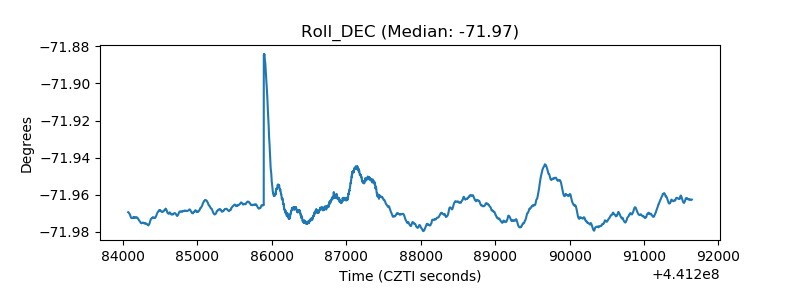 |
| _Roll_RA | 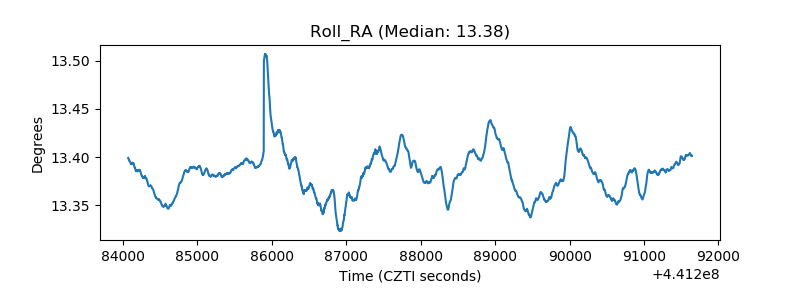 |
| Veto Counter | 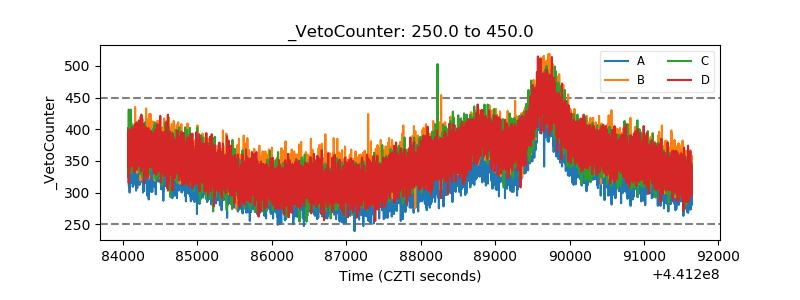 |