| Param | Original file | Final file |
|---|---|---|
| Filename | modeM0/AS1A13_080T04_9000006004_44581cztM0_level2.fits | modeM0/AS1A13_080T04_9000006004_44581cztM0_level2_quad_clean.evt |
| Size (bytes) | 608,852,160 | 109,681,920 |
| Size | 580.6 MB | 104.6 MB |
| Events in quadrant A | 5,211,744 | 759,833 |
| Events in quadrant B | 4,130,904 | 752,971 |
| Events in quadrant C | 5,842,062 | 684,572 |
| Events in quadrant D | 6,811,488 | 636,042 |
| Mode SS | |||
|---|---|---|---|
| Quadrant | BADHDUFLAG | Total packets | Discarded packets |
| A | 0 | 140 | 0 |
| B | 0 | 140 | 0 |
| C | 0 | 140 | 0 |
| D | 0 | 140 | 0 |
| Mode M0 | |||
|---|---|---|---|
| Quadrant | BADHDUFLAG | Total packets | Discarded packets |
| A | 0 | 21101 | 0 |
| B | 0 | 17033 | 0 |
| C | 0 | 22108 | 0 |
| D | 0 | 25159 | 0 |
| Quadrant | Total seconds | Saturated seconds | Saturation percentage |
|---|---|---|---|
| A | 6995 | 72 | 1.029307% |
| B | 6996 | 274 | 3.916524% |
| C | 6996 | 644 | 9.205260% |
| D | 6996 | 538 | 7.690109% |
Noise dominated data is calculated using 1-second bins in cleaned event files. If a bin has >2000 counts, and if more than 50% of those come from <1% of pixels, then it is considered to be noise-dominated and hence unusable.
| Quadrant | # 1 sec bins | Bins with >0 counts | Bins with >2000 counts | High rate bins dominated by noise | Noise dominated (total time) | Noise dominated (detector-on time) | Marked lightcurve |
|---|---|---|---|---|---|---|---|
| A | 6995 | 6995 | 22 | 22 | 0.31% | 0.31% | 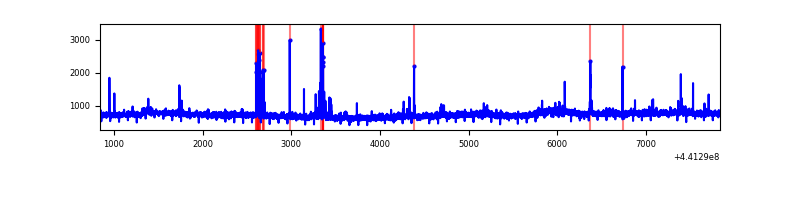 |
| B | 6996 | 6996 | 215 | 215 | 3.07% | 3.07% | 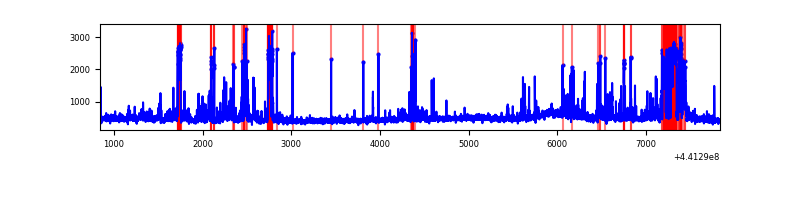 |
| C | 6996 | 6996 | 639 | 639 | 9.13% | 9.13% | 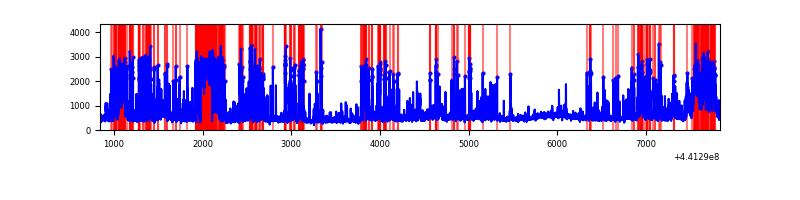 |
| D | 6996 | 6996 | 503 | 503 | 7.19% | 7.19% | 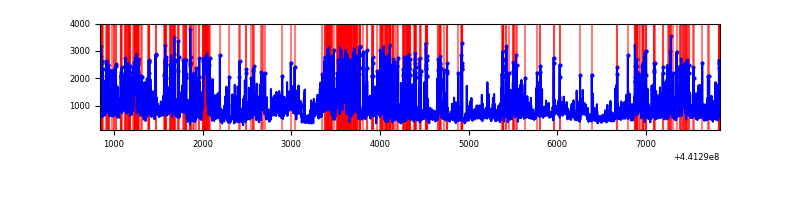 |
Top three noisy pixels from each quadrant. If the there are fewer than three noisy pixels in the level2.evt file, extra rows are filled as -1
| Pixel properties | Quadrant properties | ||||||
|---|---|---|---|---|---|---|---|
| Quadrant | DetID | PixID | Counts | Sigma | Mean | Median | Sigma |
| A | 10 | 83 | 2003198 | 12420.04 | 775 | 758 | 161.2 |
| A | 10 | 248 | 63200 | 387.29 | 775 | 758 | 161.2 |
| A | 13 | 248 | 62182 | 380.98 | 775 | 758 | 161.2 |
| B | 5 | 172 | 388235 | 2600.9 | 764 | 740 | 149.0 |
| B | 15 | 36 | 265325 | 1775.92 | 764 | 740 | 149.0 |
| B | 4 | 171 | 146750 | 980.03 | 764 | 740 | 149.0 |
| C | 15 | 208 | 1296815 | 7617.92 | 727 | 731 | 170.1 |
| C | 12 | 2 | 625901 | 3674.53 | 727 | 731 | 170.1 |
| C | 15 | 158 | 507510 | 2978.67 | 727 | 731 | 170.1 |
| D | 1 | 52 | 1302068 | 7049.52 | 734 | 708 | 184.6 |
| D | 13 | 249 | 1019810 | 5520.52 | 734 | 708 | 184.6 |
| D | 13 | 174 | 638101 | 3452.78 | 734 | 708 | 184.6 |
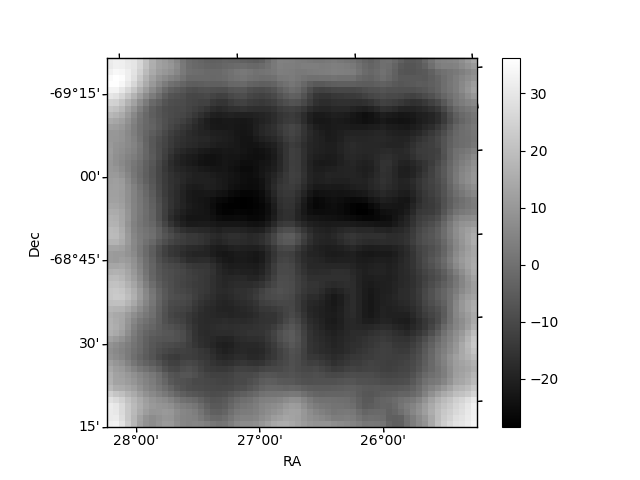
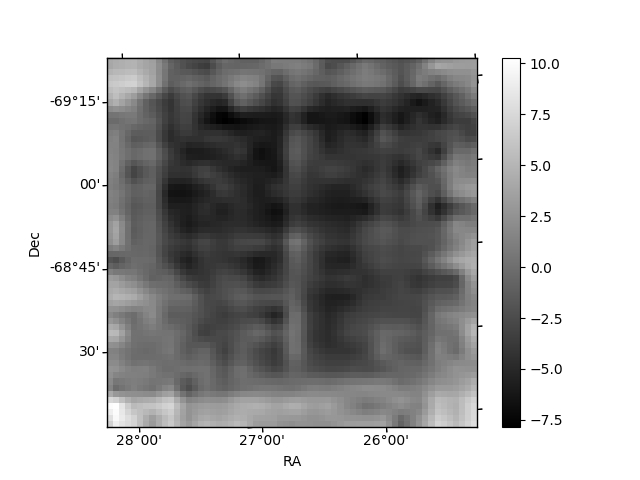
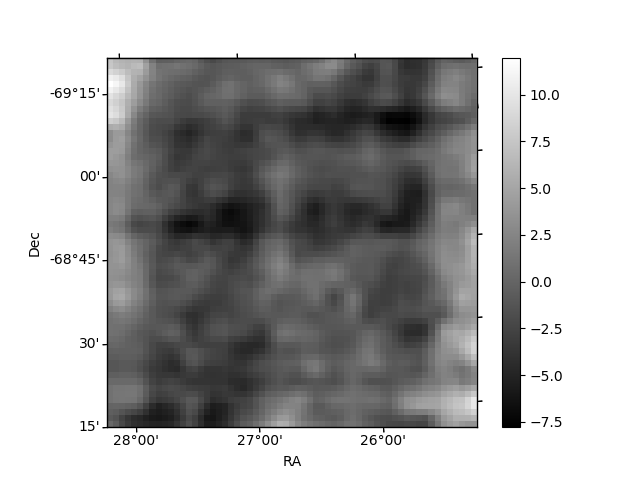
Histogram calculated using DETX and DETY for each event in the final _common_clean file
| Quadrant A | 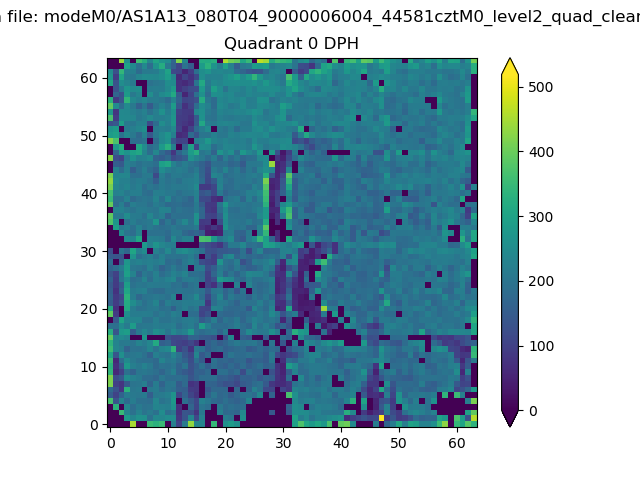 |
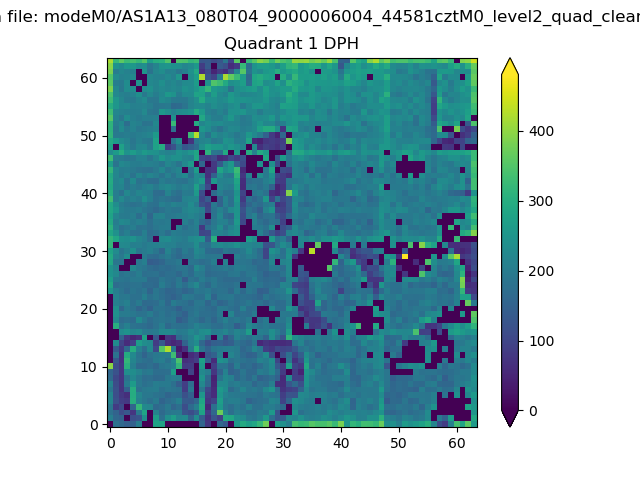 |
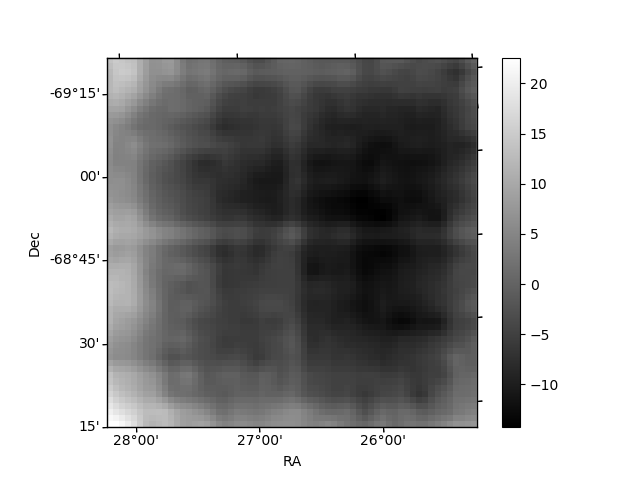
Quadrant B |
|---|---|---|---|
| Quadrant D | 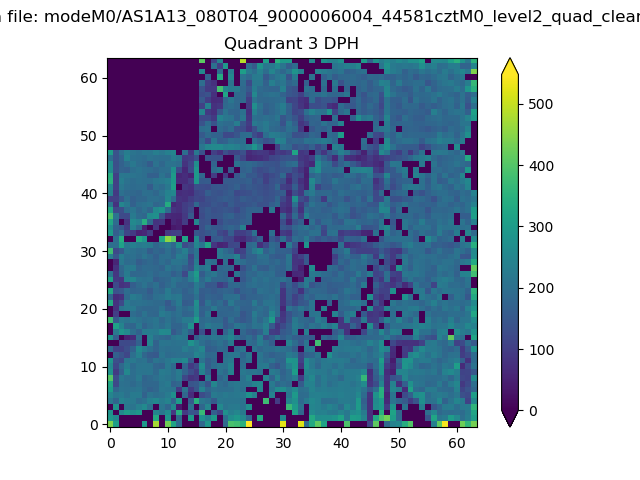 |
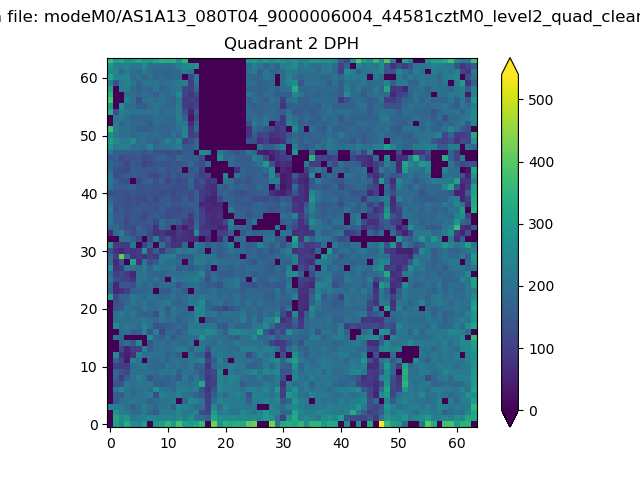 |
Quadrant C |
| Plot type | Count rate plots | Images |
|---|---|---|
| Comparison with Poisson distribution Blue bars denote a histogram of data divided into 1 sec bins. Red curve is a Poisson curve with rate = median count rate of data. |
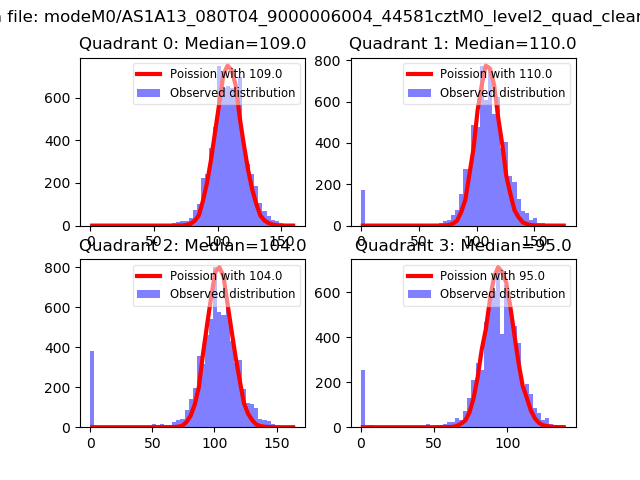 |
 |
| Quadrant-wise count rates Data is divided into 100 sec bins |
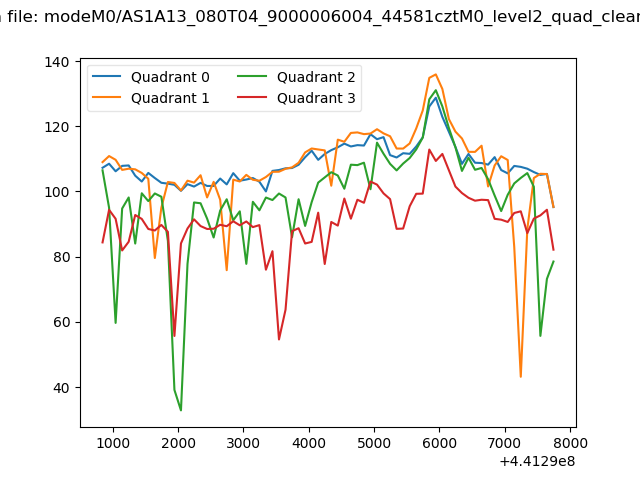 |
|
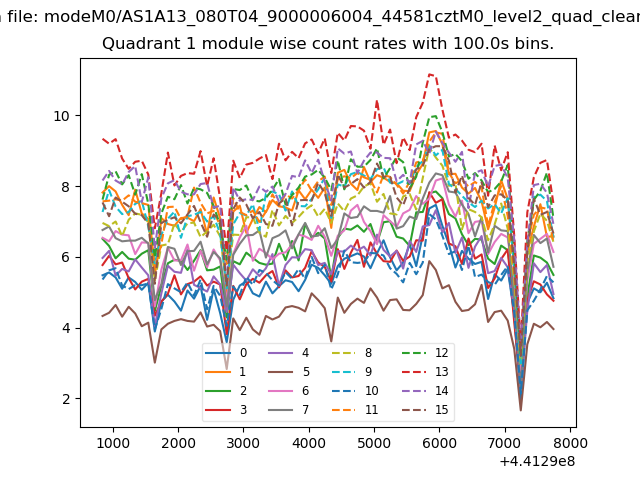
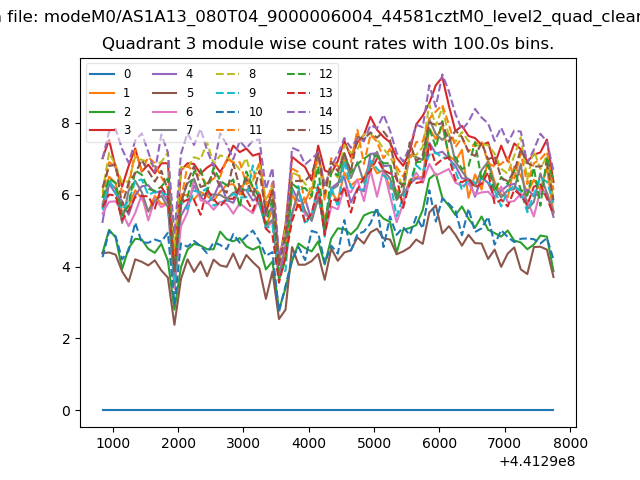
| Module-wise count rates for Quadrant A Data is divided into 100 sec bins |
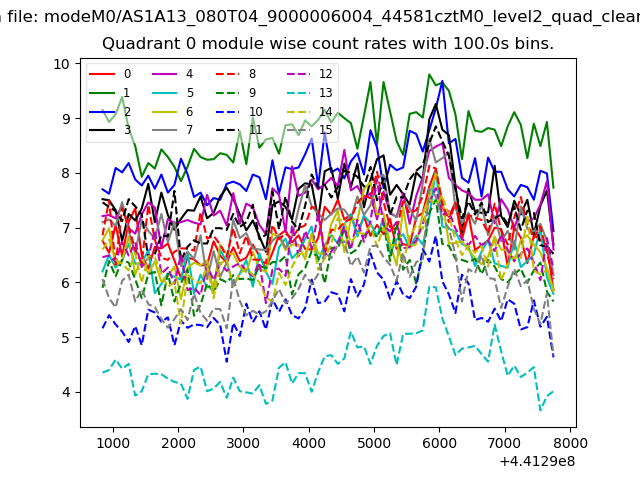 |
 |
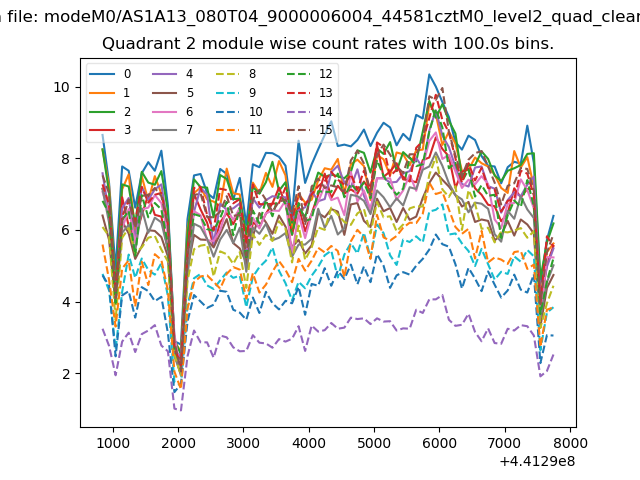
| Module-wise count rates for Quadrant B Data is divided into 100 sec bins |
 |
 |
| Module-wise count rates for Quadrant C Data is divided into 100 sec bins |
 |
 |
| Module-wise count rates for Quadrant D Data is divided into 100 sec bins |
 |
 |
| Parameter | Plot |
|---|---|
| CZT HV Monitor | 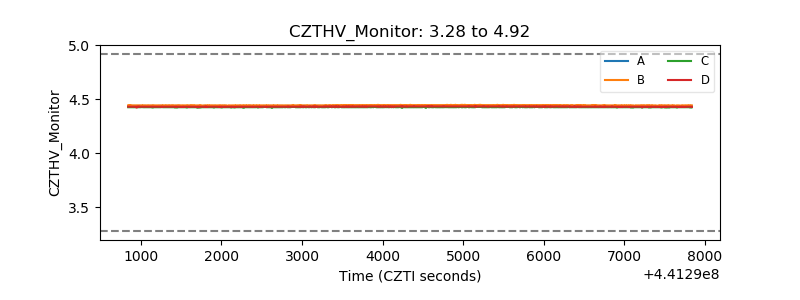 |
| D_VDD | 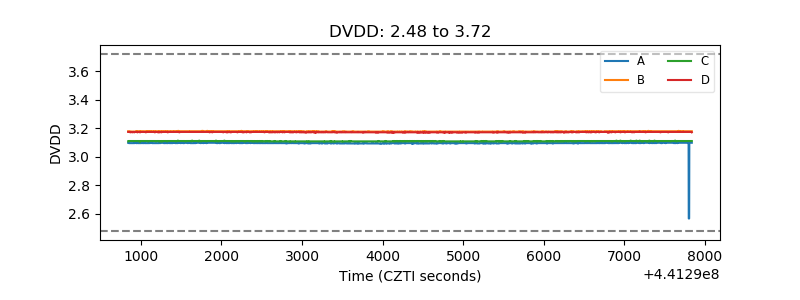 |
| Temperature 1 | 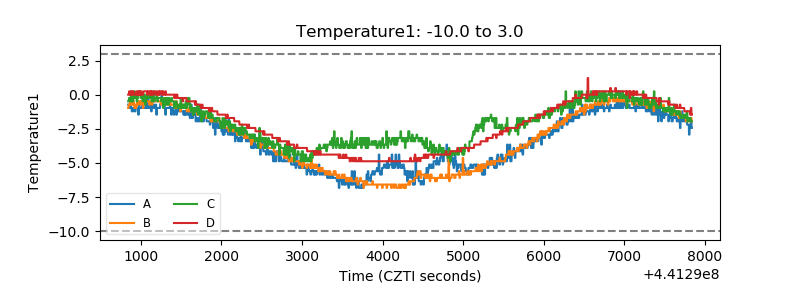 |
| Veto HV Monitor | 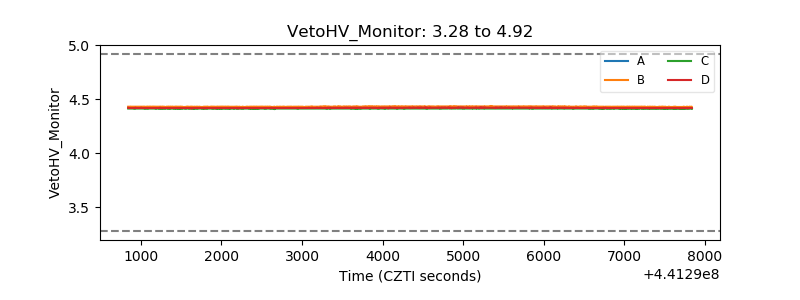 |
| Veto LLD | 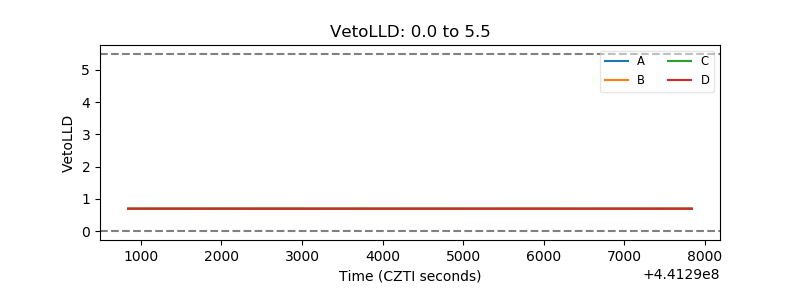 |
| Alpha Counter | 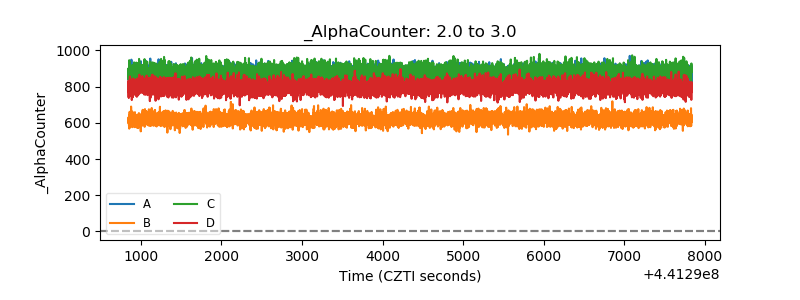 |
| _CPM_Rate | 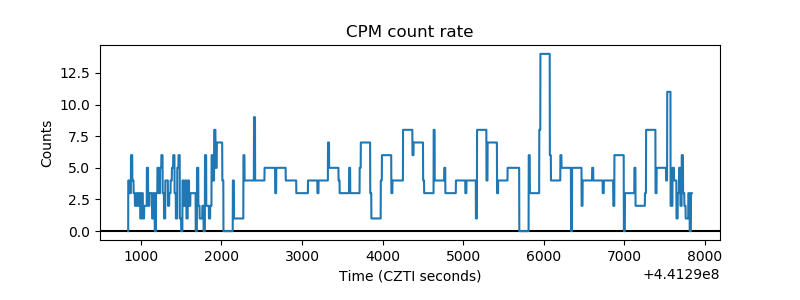 |
| CZT Counter | 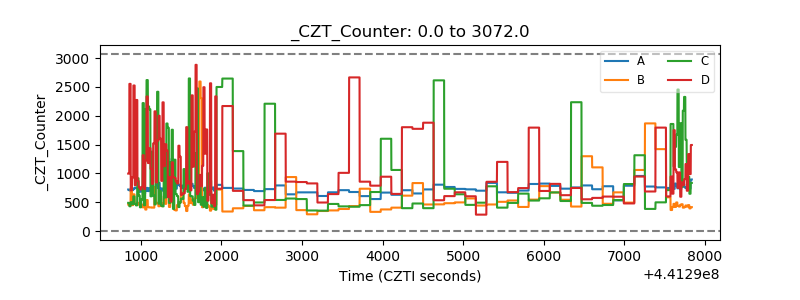 |
| +2.5 Volts monitor | 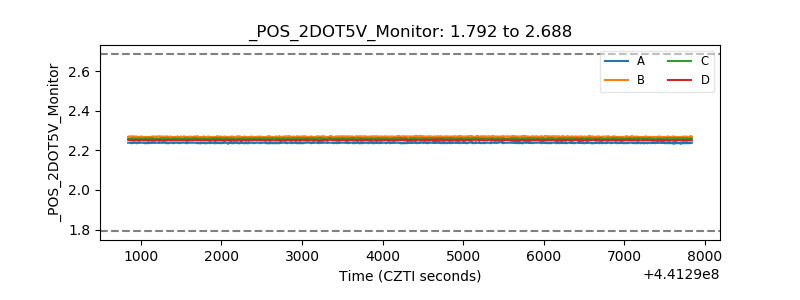 |
| +5 Volts monitor | 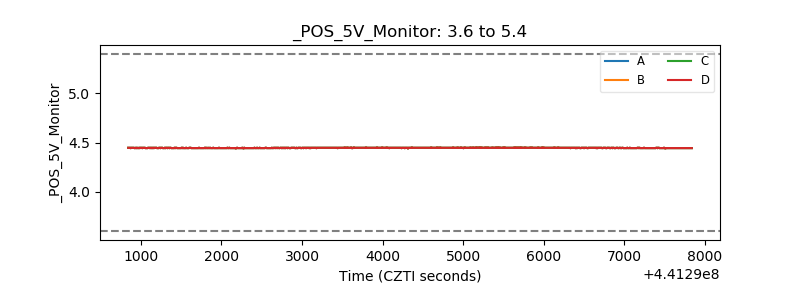 |
| _ROLL_ROT | 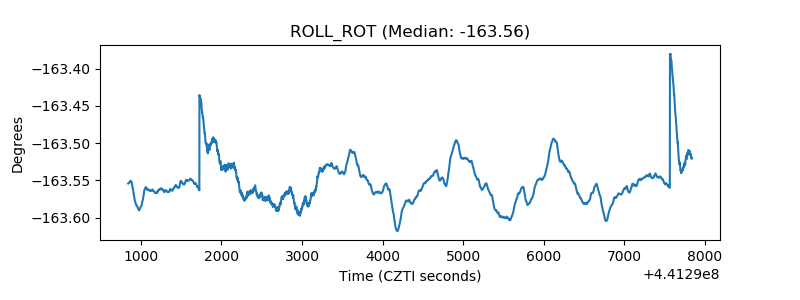 |
| _Roll_DEC | 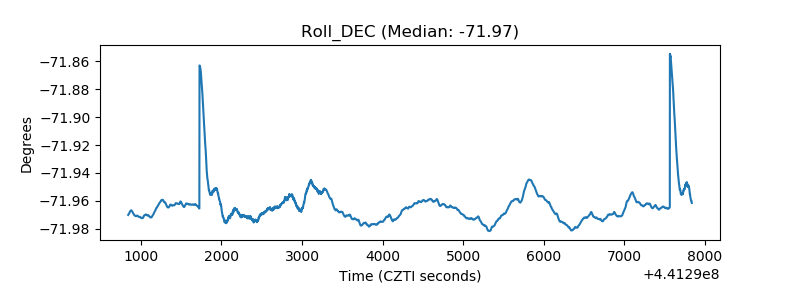 |
| _Roll_RA | 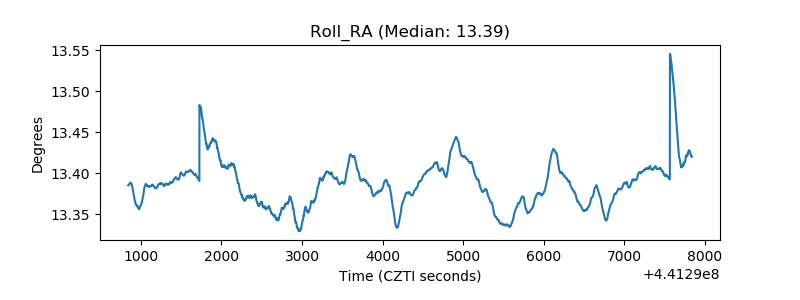 |
| Veto Counter | 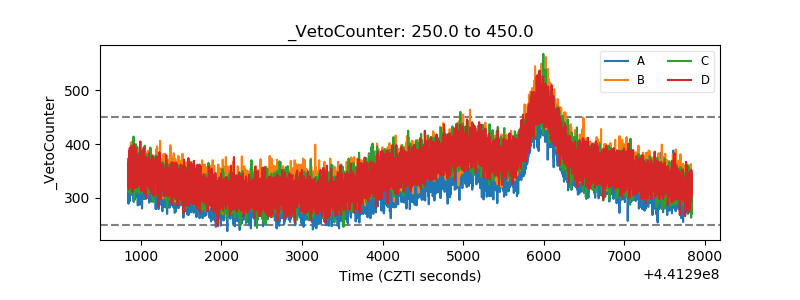 |