| Param | Original file | Final file |
|---|---|---|
| Filename | modeM0/AS1A13_072T01_9000006008_44625cztM0_level2.fits | modeM0/AS1A13_072T01_9000006008_44625cztM0_level2_quad_clean.evt |
| Size (bytes) | 366,428,160 | 86,973,120 |
| Size | 349.5 MB | 82.9 MB |
| Events in quadrant A | 3,836,141 | 583,380 |
| Events in quadrant B | 2,519,728 | 602,539 |
| Events in quadrant C | 2,597,122 | 567,190 |
| Events in quadrant D | 4,179,703 | 492,732 |
| Mode M0 | |||
|---|---|---|---|
| Quadrant | BADHDUFLAG | Total packets | Discarded packets |
| A | 0 | 16367 | 0 |
| B | 0 | 11508 | 0 |
| C | 0 | 11828 | 0 |
| D | 0 | 16223 | 0 |
| Mode SS | |||
|---|---|---|---|
| Quadrant | BADHDUFLAG | Total packets | Discarded packets |
| A | 0 | 110 | 0 |
| B | 0 | 110 | 0 |
| C | 0 | 110 | 0 |
| D | 0 | 110 | 0 |
| Quadrant | Total seconds | Saturated seconds | Saturation percentage |
|---|---|---|---|
| A | 5538 | 137 | 2.473817% |
| B | 5538 | 92 | 1.661250% |
| C | 5539 | 74 | 1.335981% |
| D | 5539 | 473 | 8.539448% |
Noise dominated data is calculated using 1-second bins in cleaned event files. If a bin has >2000 counts, and if more than 50% of those come from <1% of pixels, then it is considered to be noise-dominated and hence unusable.
| Quadrant | # 1 sec bins | Bins with >0 counts | Bins with >2000 counts | High rate bins dominated by noise | Noise dominated (total time) | Noise dominated (detector-on time) | Marked lightcurve |
|---|---|---|---|---|---|---|---|
| A | 5538 | 5538 | 7 | 7 | 0.13% | 0.13% | 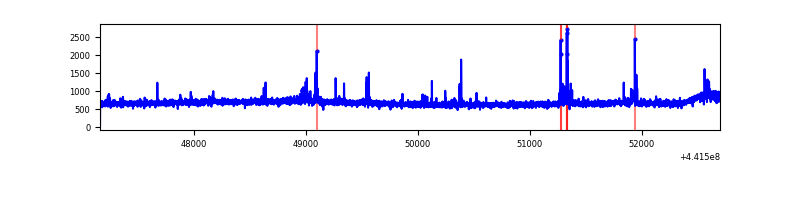 |
| B | 5538 | 5538 | 3 | 3 | 0.05% | 0.05% | 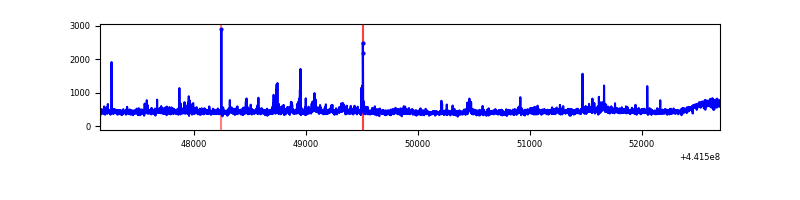 |
| C | 5539 | 5539 | 19 | 19 | 0.34% | 0.34% | 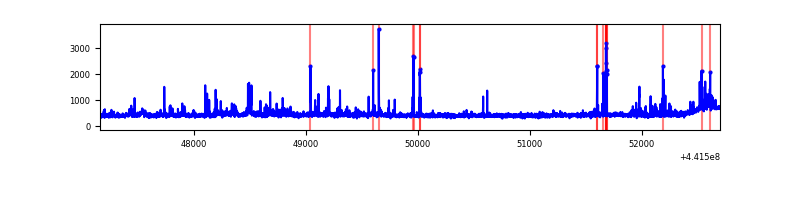 |
| D | 5539 | 5539 | 392 | 392 | 7.08% | 7.08% | 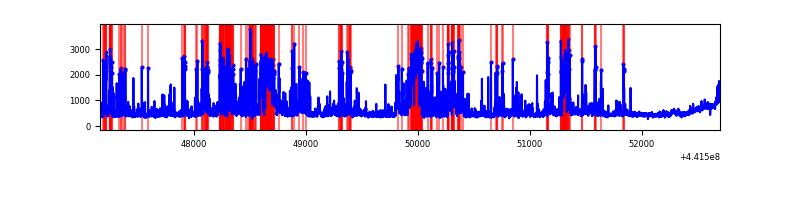 |
Top three noisy pixels from each quadrant. If the there are fewer than three noisy pixels in the level2.evt file, extra rows are filled as -1
| Pixel properties | Quadrant properties | ||||||
|---|---|---|---|---|---|---|---|
| Quadrant | DetID | PixID | Counts | Sigma | Mean | Median | Sigma |
| A | 10 | 83 | 1393429 | 11000.29 | 603 | 591 | 126.6 |
| A | 13 | 248 | 86520 | 678.65 | 603 | 591 | 126.6 |
| A | 8 | 4 | 7606 | 55.4 | 603 | 591 | 126.6 |
| B | 0 | 183 | 54856 | 450.05 | 603 | 583 | 120.6 |
| B | 0 | 189 | 20236 | 162.97 | 603 | 583 | 120.6 |
| B | 0 | 190 | 19876 | 159.98 | 603 | 583 | 120.6 |
| C | 12 | 2 | 105471 | 760.83 | 588 | 591 | 137.8 |
| C | 14 | 254 | 60488 | 434.51 | 588 | 591 | 137.8 |
| C | 15 | 158 | 41017 | 293.26 | 588 | 591 | 137.8 |
| D | 13 | 249 | 526553 | 3621.46 | 571 | 550 | 145.2 |
| D | 1 | 52 | 435738 | 2996.22 | 571 | 550 | 145.2 |
| D | 2 | 249 | 361300 | 2483.72 | 571 | 550 | 145.2 |
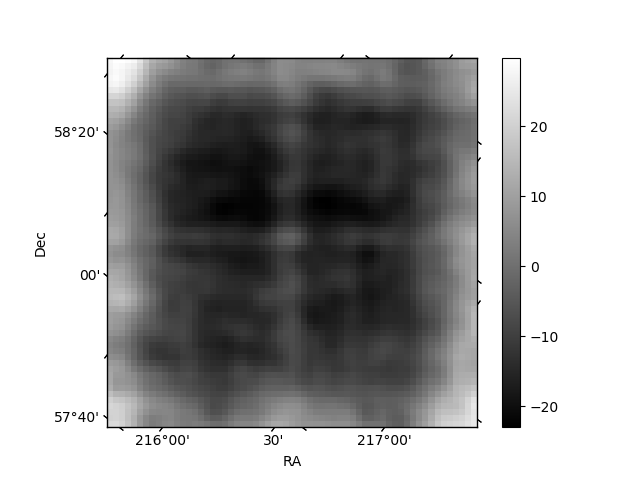
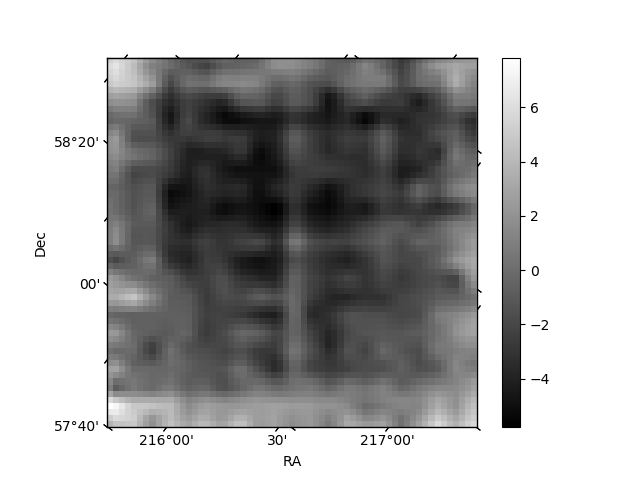
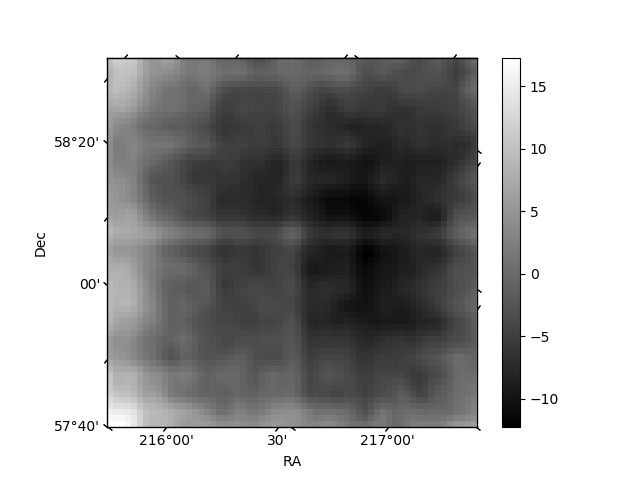
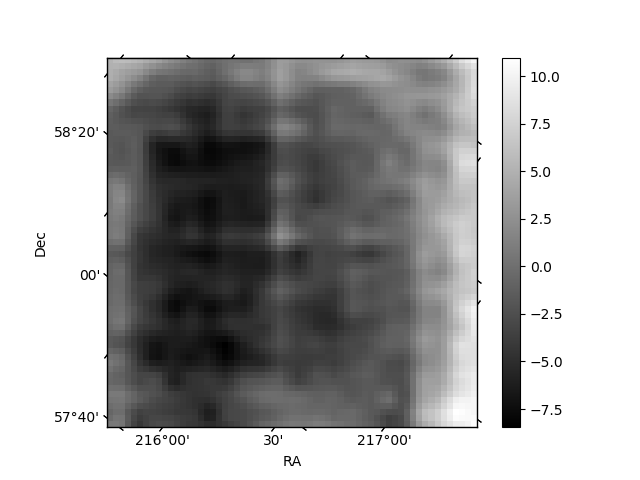
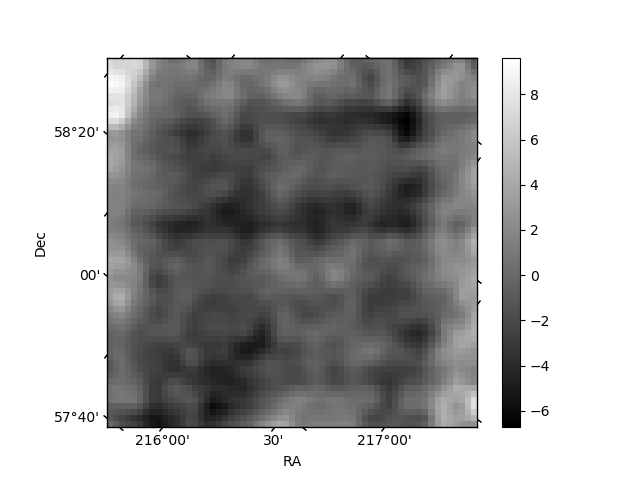
Histogram calculated using DETX and DETY for each event in the final _common_clean file
| Quadrant A | 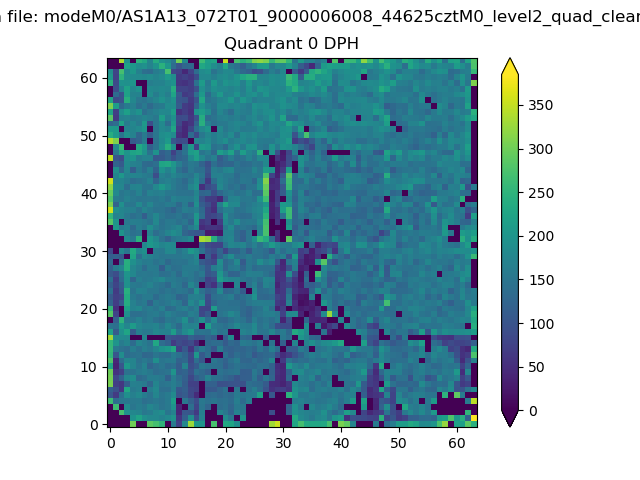 |
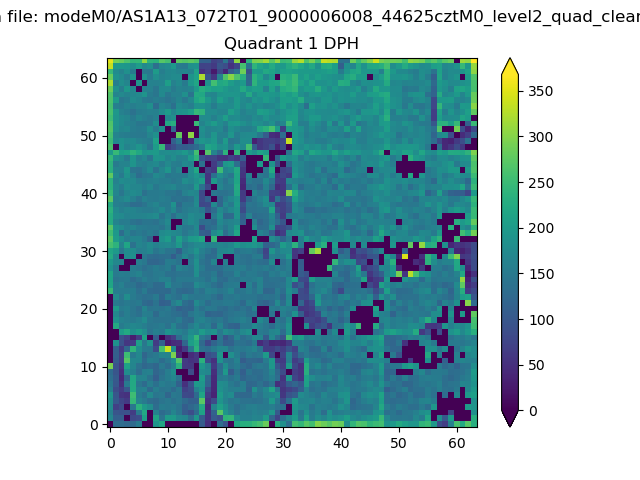 |
Quadrant B |
|---|---|---|---|
| Quadrant D | 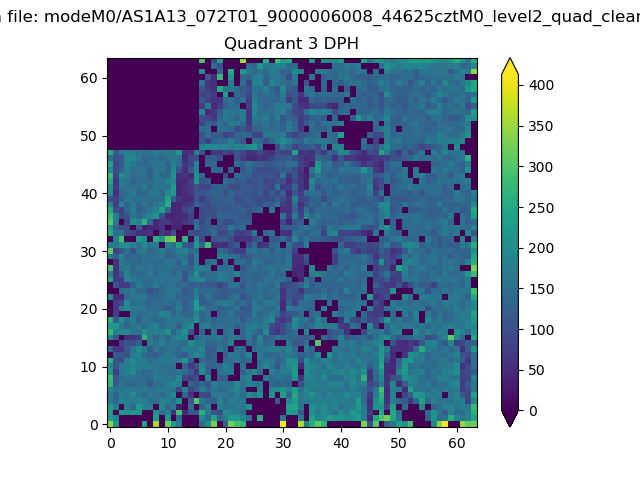 |
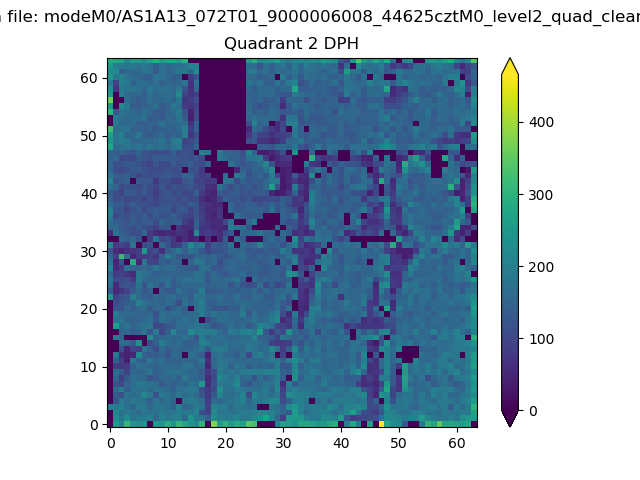 |
Quadrant C |
| Plot type | Count rate plots | Images |
|---|---|---|
| Comparison with Poisson distribution Blue bars denote a histogram of data divided into 1 sec bins. Red curve is a Poisson curve with rate = median count rate of data. |
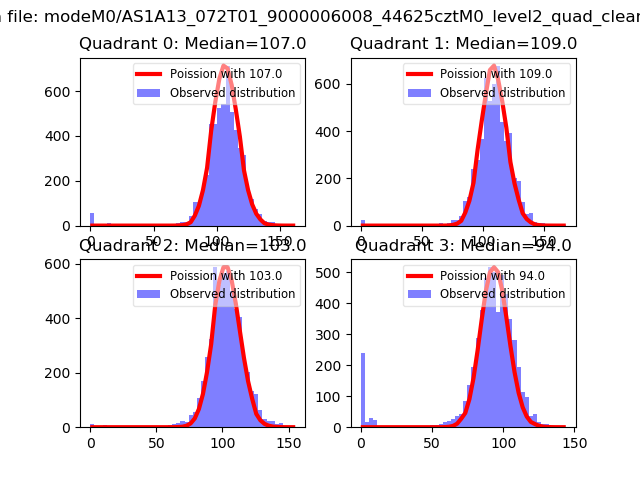 |
 |
| Quadrant-wise count rates Data is divided into 100 sec bins |
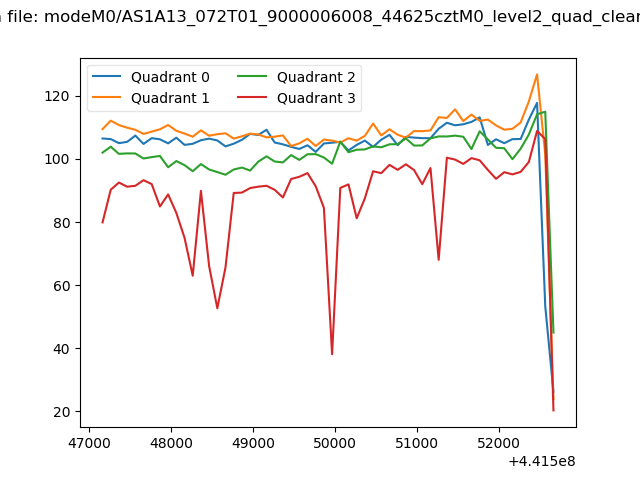 |
|
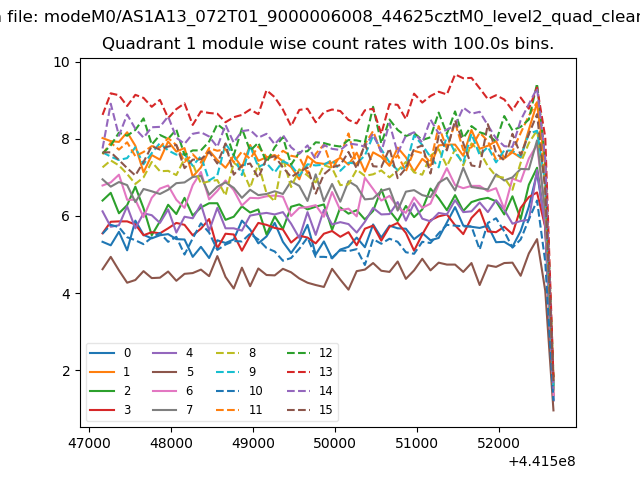
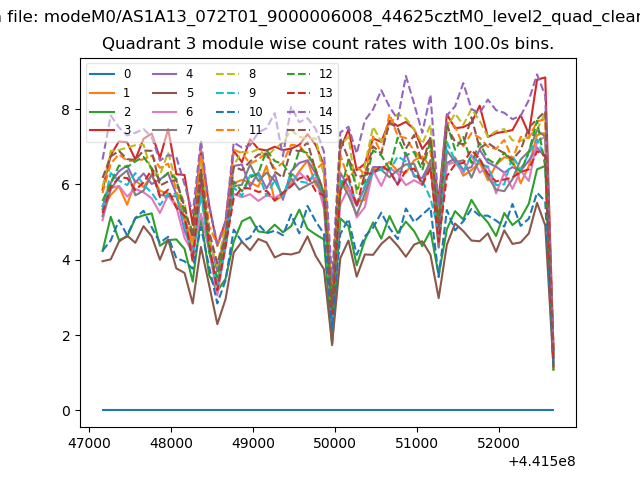
| Module-wise count rates for Quadrant A Data is divided into 100 sec bins |
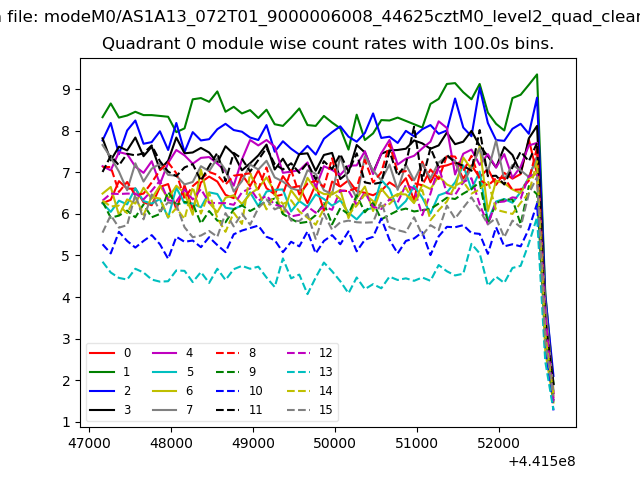 |
 |
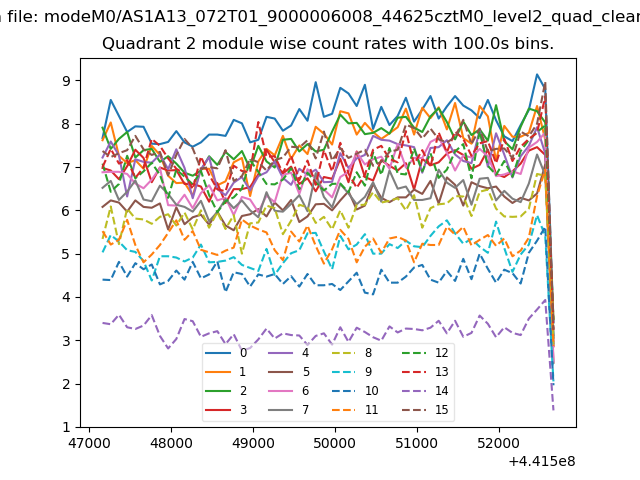
| Module-wise count rates for Quadrant B Data is divided into 100 sec bins |
 |
 |
| Module-wise count rates for Quadrant C Data is divided into 100 sec bins |
 |
 |
| Module-wise count rates for Quadrant D Data is divided into 100 sec bins |
 |
 |
| Parameter | Plot |
|---|---|
| CZT HV Monitor | 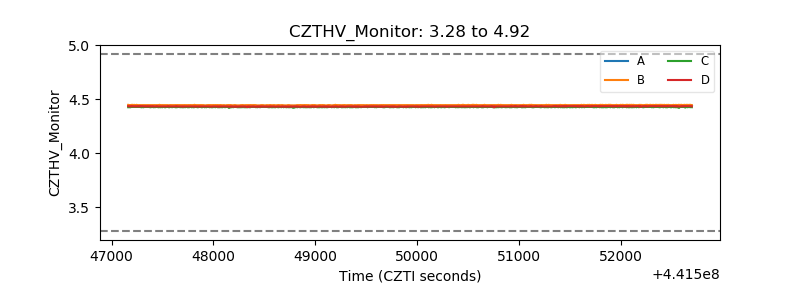 |
| D_VDD | 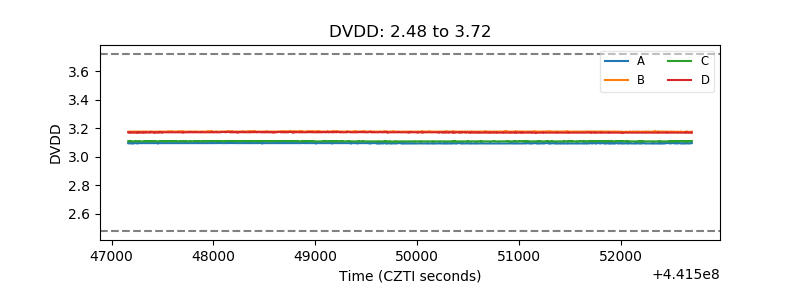 |
| Temperature 1 | 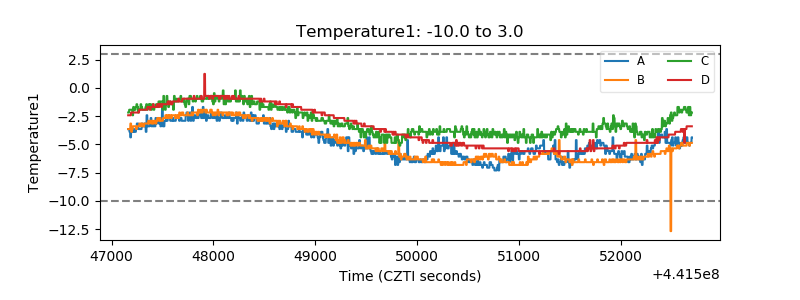 |
| Veto HV Monitor | 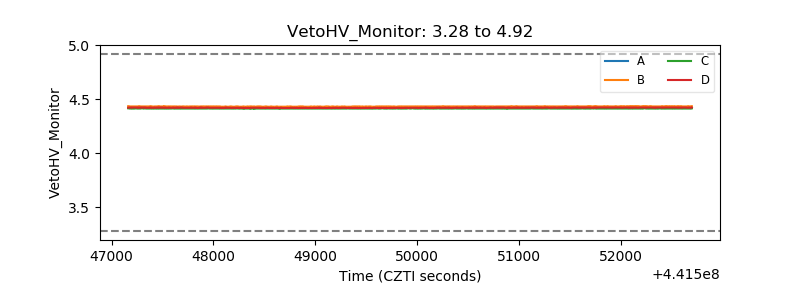 |
| Veto LLD |  |
| Alpha Counter | 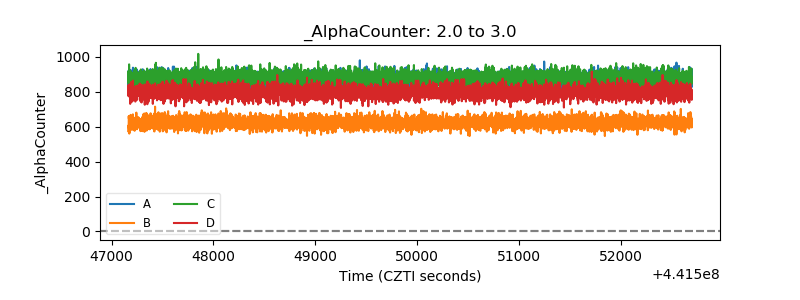 |
| _CPM_Rate | 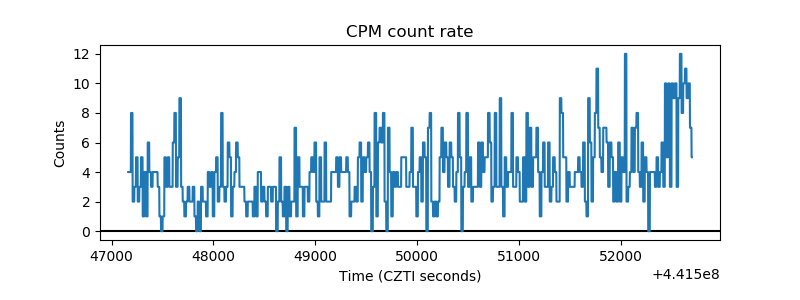 |
| CZT Counter | 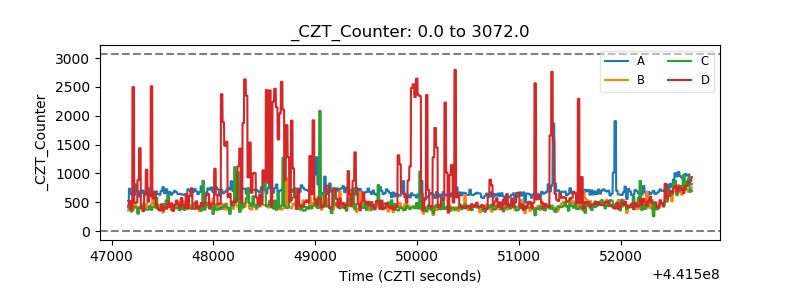 |
| +2.5 Volts monitor | 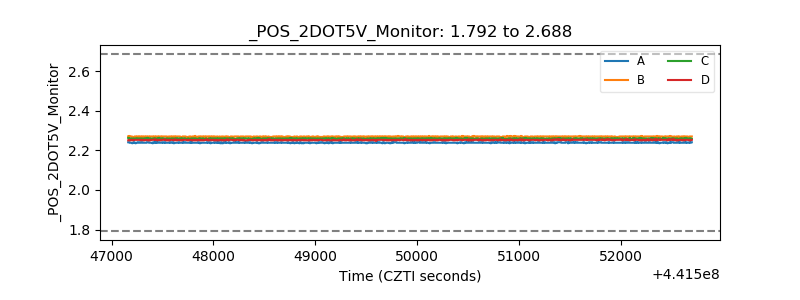 |
| +5 Volts monitor | 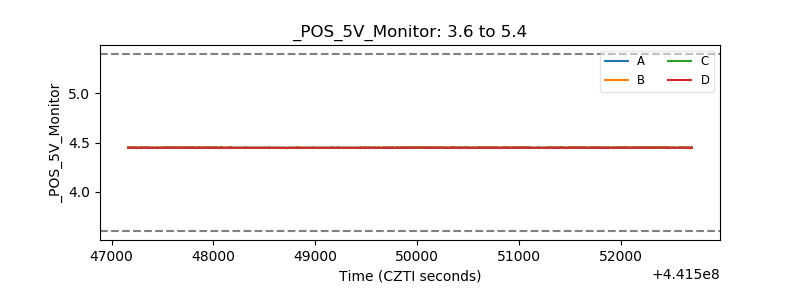 |
| _ROLL_ROT | 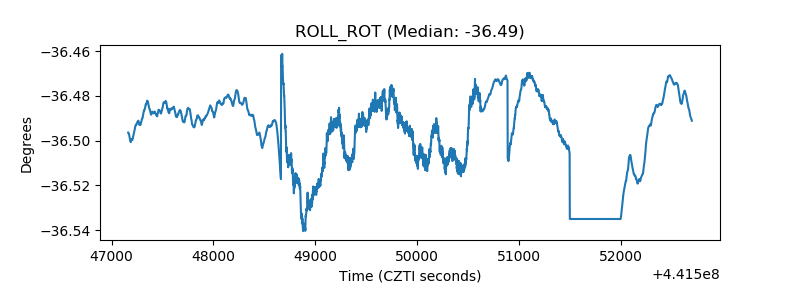 |
| _Roll_DEC | 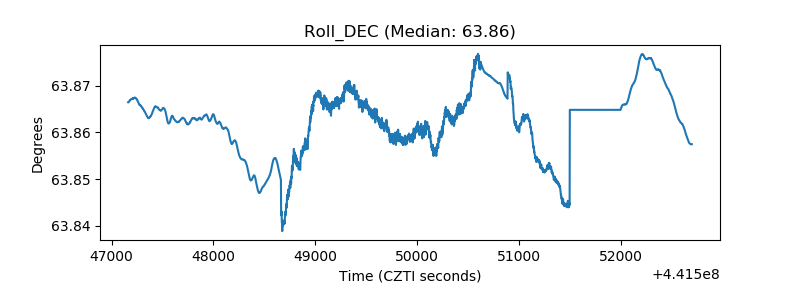 |
| _Roll_RA | 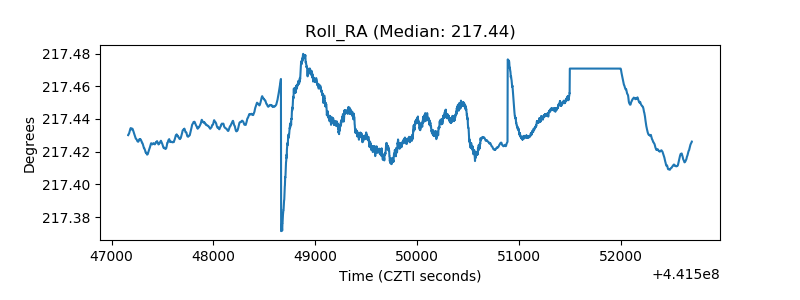 |
| Veto Counter | 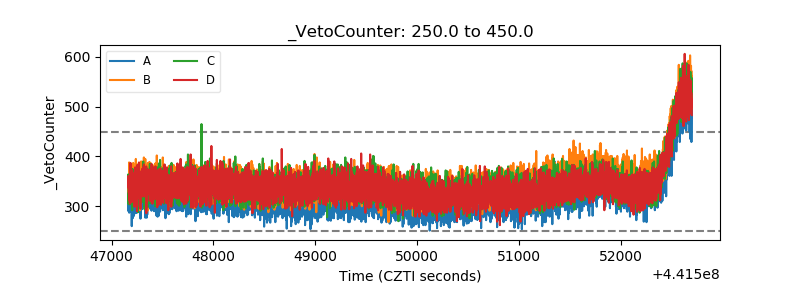 |