| Param | Original file | Final file |
|---|---|---|
| Filename | modeM0/AS1A13_072T01_9000006008_44627cztM0_level2.fits | modeM0/AS1A13_072T01_9000006008_44627cztM0_level2_quad_clean.evt |
| Size (bytes) | 1,051,205,760 | 217,218,240 |
| Size | 1002.5 MB | 207.2 MB |
| Events in quadrant A | 10,156,688 | 1,473,376 |
| Events in quadrant B | 6,590,720 | 1,530,004 |
| Events in quadrant C | 6,771,389 | 1,442,137 |
| Events in quadrant D | 14,307,346 | 1,160,907 |
| Mode M0 | |||
|---|---|---|---|
| Quadrant | BADHDUFLAG | Total packets | Discarded packets |
| A | 0 | 41927 | 2 |
| B | 0 | 29547 | 2 |
| C | 0 | 30287 | 2 |
| D | 0 | 52384 | 2 |
| Mode SS | |||
|---|---|---|---|
| Quadrant | BADHDUFLAG | Total packets | Discarded packets |
| A | 0 | 286 | 0 |
| B | 0 | 286 | 0 |
| C | 0 | 286 | 0 |
| D | 0 | 286 | 0 |
| Mode M9 | |||
|---|---|---|---|
| Quadrant | BADHDUFLAG | Total packets | Discarded packets |
| A | 0 | 10 | 0 |
| B | 0 | 10 | 0 |
| C | 0 | 10 | 0 |
| D | 0 | 10 | 0 |
| Quadrant | Total seconds | Saturated seconds | Saturation percentage |
|---|---|---|---|
| A | 14038 | 392 | 2.792421% |
| B | 14038 | 237 | 1.688275% |
| C | 14039 | 167 | 1.189543% |
| D | 14039 | 2190 | 15.599402% |
Noise dominated data is calculated using 1-second bins in cleaned event files. If a bin has >2000 counts, and if more than 50% of those come from <1% of pixels, then it is considered to be noise-dominated and hence unusable.
| Quadrant | # 1 sec bins | Bins with >0 counts | Bins with >2000 counts | High rate bins dominated by noise | Noise dominated (total time) | Noise dominated (detector-on time) | Marked lightcurve |
|---|---|---|---|---|---|---|---|
| A | 15103 | 14040 | 10 | 10 | 0.07% | 0.07% | 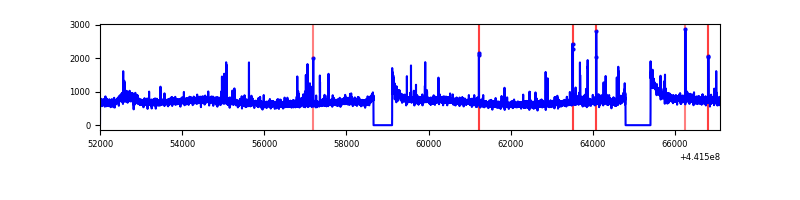 |
| B | 15103 | 14040 | 19 | 19 | 0.13% | 0.14% | 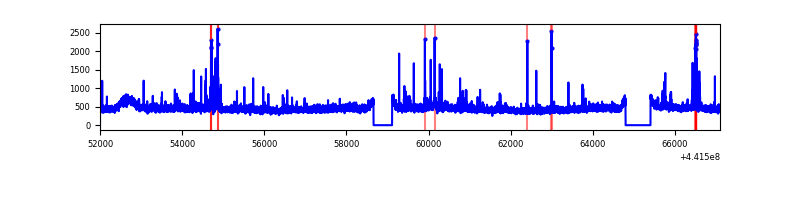 |
| C | 15104 | 14041 | 52 | 52 | 0.34% | 0.37% | 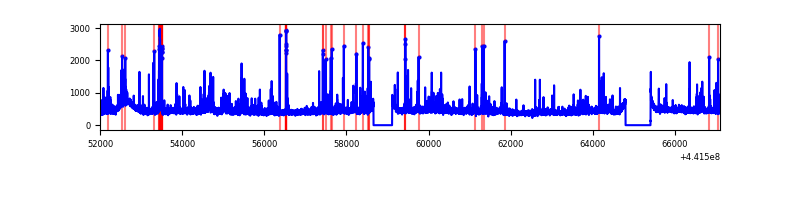 |
| D | 15104 | 14041 | 1767 | 1767 | 11.70% | 12.58% | 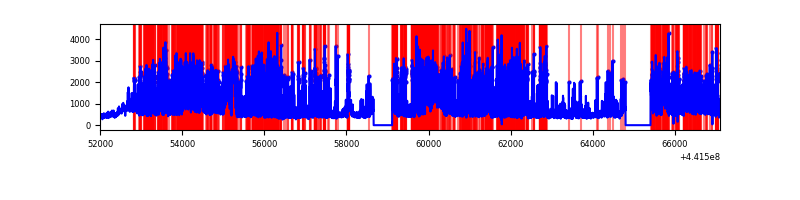 |
Top three noisy pixels from each quadrant. If the there are fewer than three noisy pixels in the level2.evt file, extra rows are filled as -1
| Pixel properties | Quadrant properties | ||||||
|---|---|---|---|---|---|---|---|
| Quadrant | DetID | PixID | Counts | Sigma | Mean | Median | Sigma |
| A | 10 | 83 | 3785174 | 11720.83 | 1564 | 1526 | 322.8 |
| A | 15 | 223 | 188985 | 580.7 | 1564 | 1526 | 322.8 |
| A | 13 | 248 | 93518 | 284.97 | 1564 | 1526 | 322.8 |
| B | 0 | 186 | 184123 | 595.75 | 1557 | 1507 | 306.5 |
| B | 0 | 189 | 57028 | 181.13 | 1557 | 1507 | 306.5 |
| B | 0 | 199 | 44571 | 140.49 | 1557 | 1507 | 306.5 |
| C | 12 | 2 | 233511 | 649.9 | 1526 | 1532 | 356.9 |
| C | 14 | 254 | 139747 | 387.21 | 1526 | 1532 | 356.9 |
| C | 3 | 233 | 100285 | 276.66 | 1526 | 1532 | 356.9 |
| D | 13 | 249 | 3859322 | 10684.96 | 1442 | 1393 | 361.1 |
| D | 1 | 52 | 2141564 | 5927.44 | 1442 | 1393 | 361.1 |
| D | 2 | 249 | 1102038 | 3048.36 | 1442 | 1393 | 361.1 |
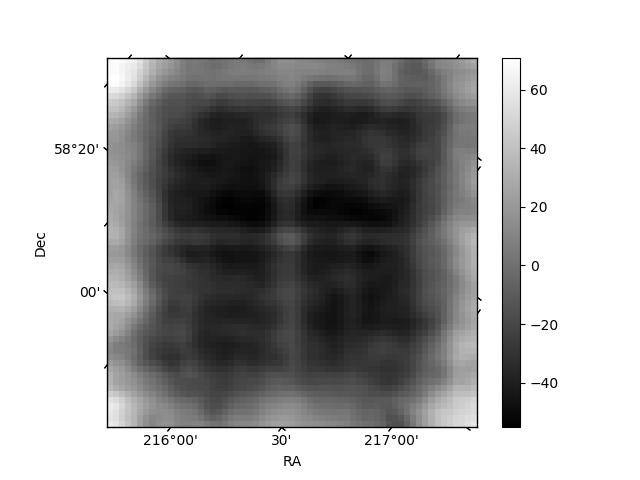
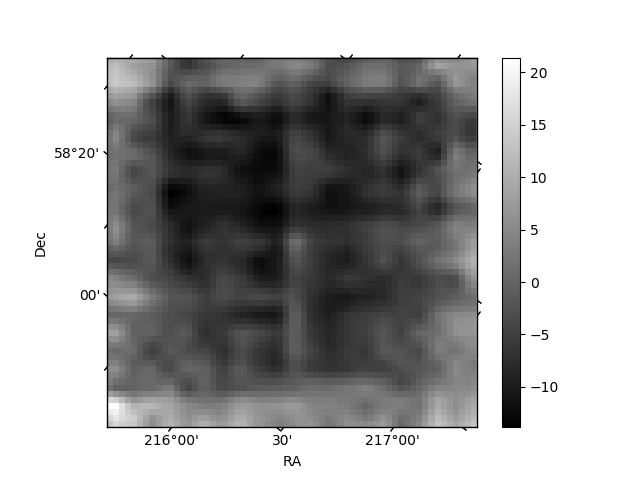
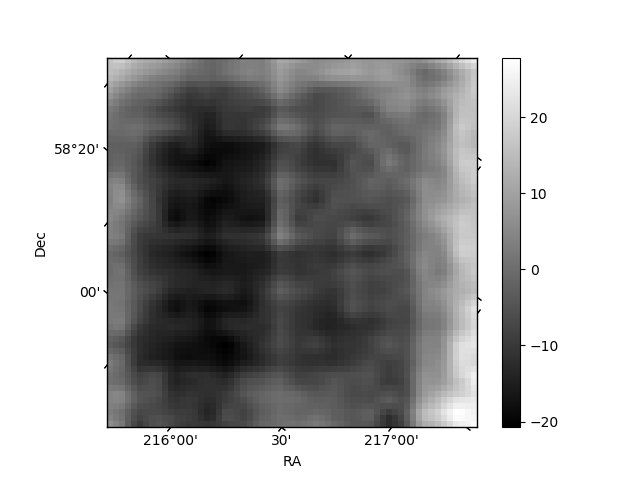
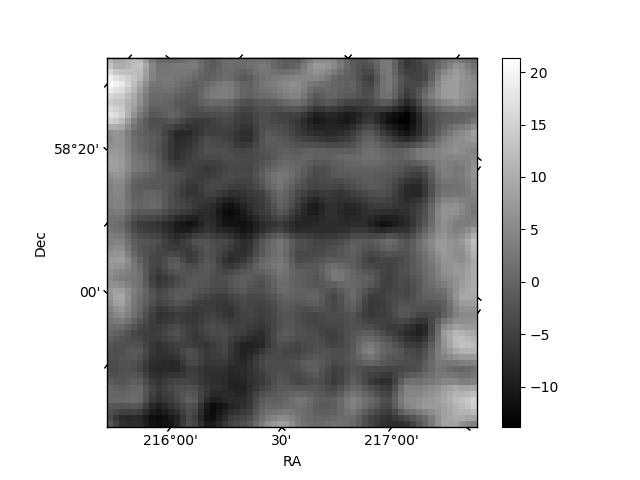
Histogram calculated using DETX and DETY for each event in the final _common_clean file
| Quadrant A | 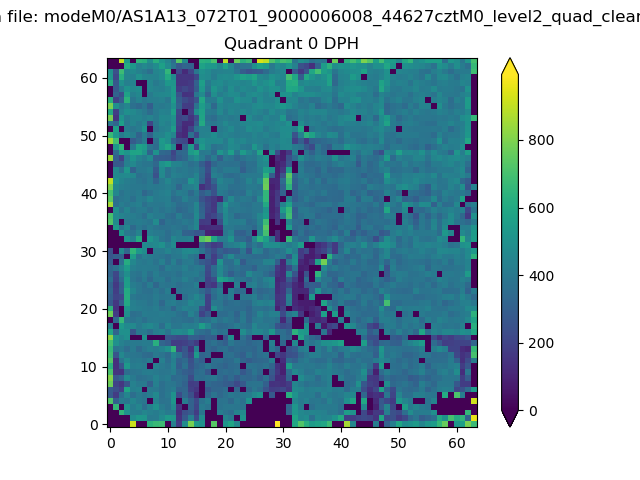 |
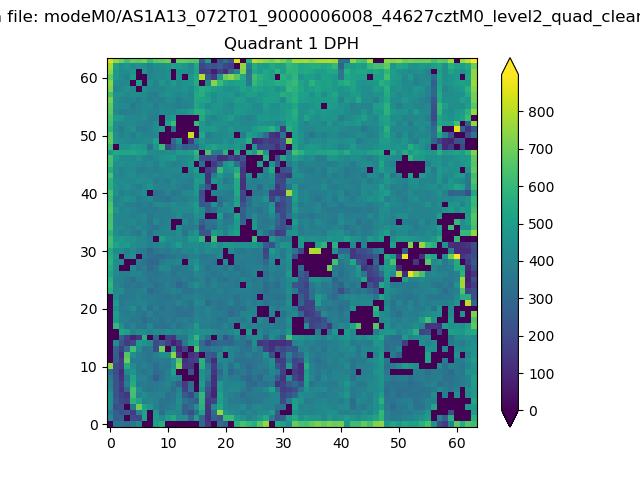 |
Quadrant B |
|---|---|---|---|
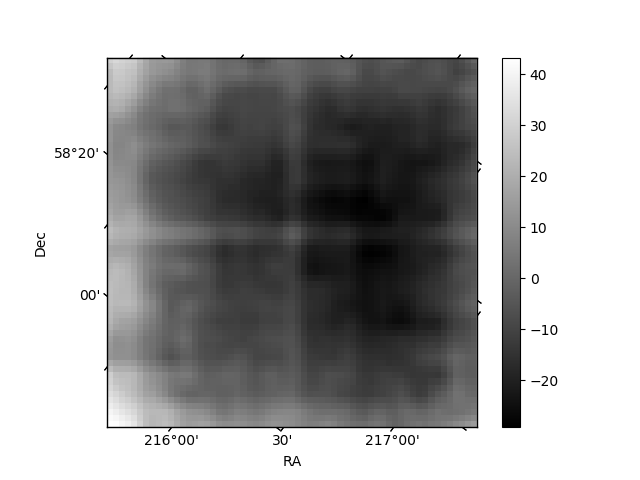
| Quadrant D | 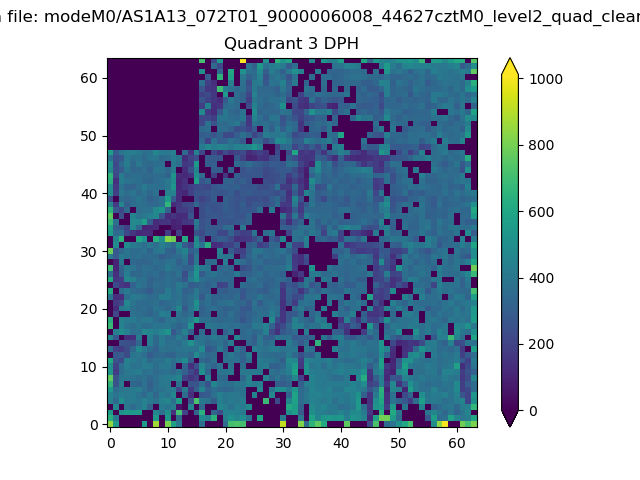 |
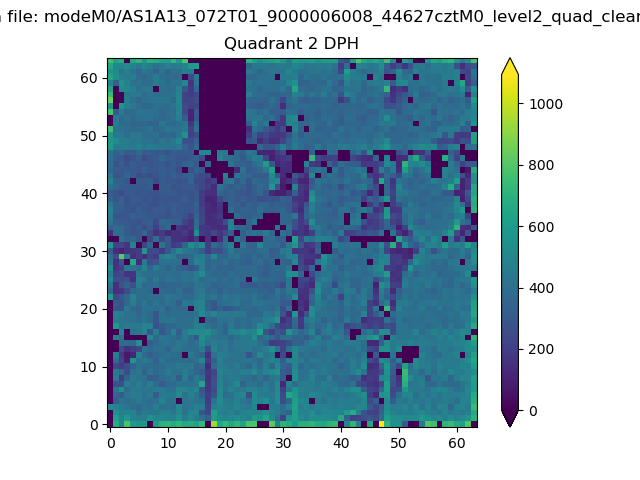 |
Quadrant C |
| Plot type | Count rate plots | Images |
|---|---|---|
| Comparison with Poisson distribution Blue bars denote a histogram of data divided into 1 sec bins. Red curve is a Poisson curve with rate = median count rate of data. |
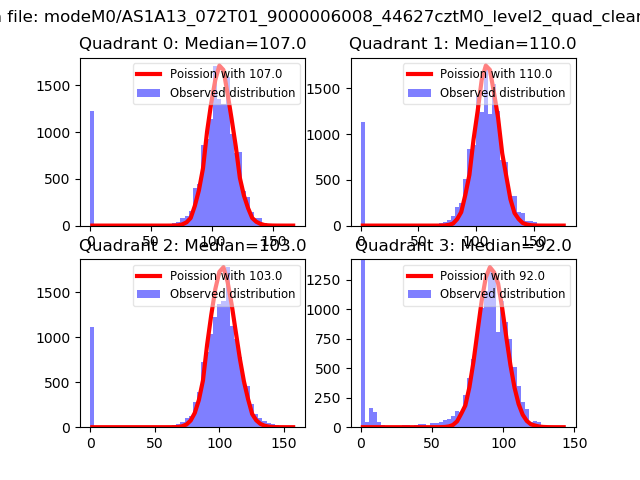 |
 |
| Quadrant-wise count rates Data is divided into 100 sec bins |
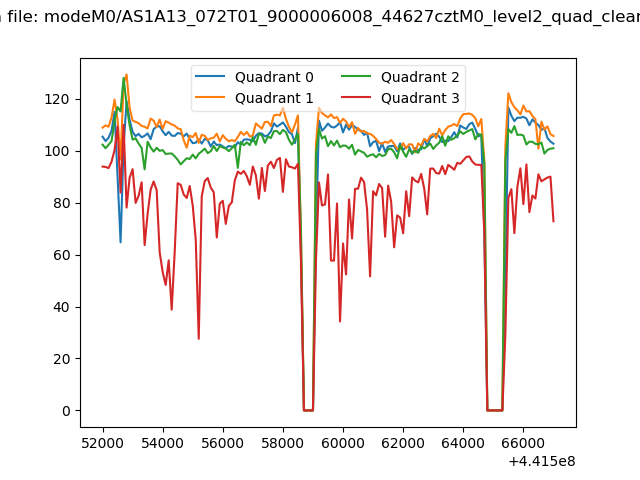 |
|
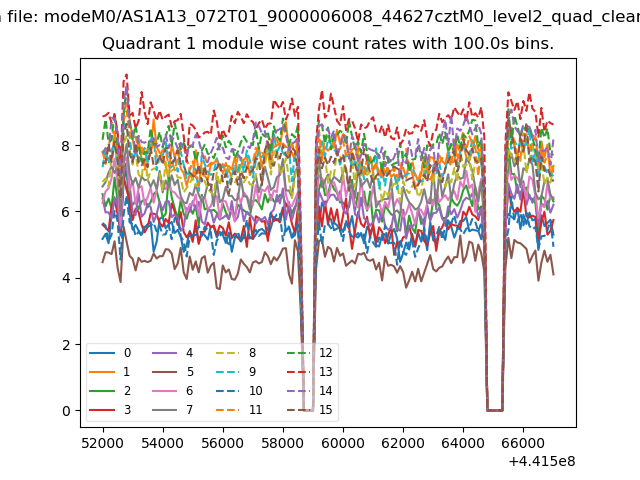
| Module-wise count rates for Quadrant A Data is divided into 100 sec bins |
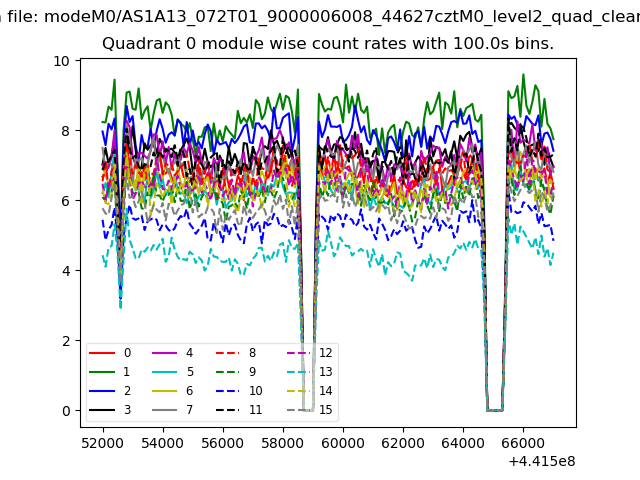 |
 |
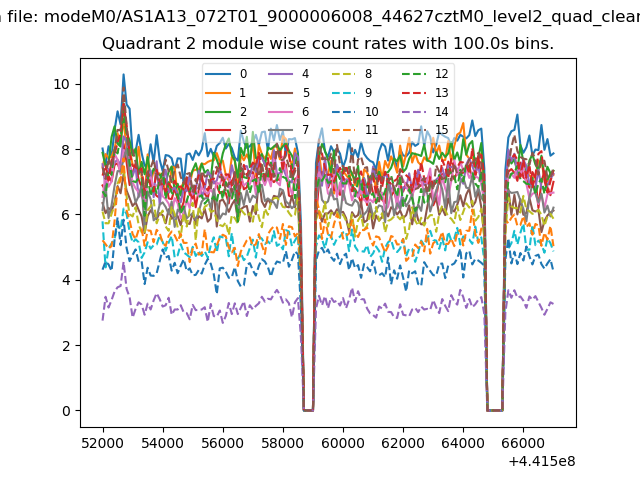
| Module-wise count rates for Quadrant B Data is divided into 100 sec bins |
 |
 |
| Module-wise count rates for Quadrant C Data is divided into 100 sec bins |
 |
 |
| Module-wise count rates for Quadrant D Data is divided into 100 sec bins |
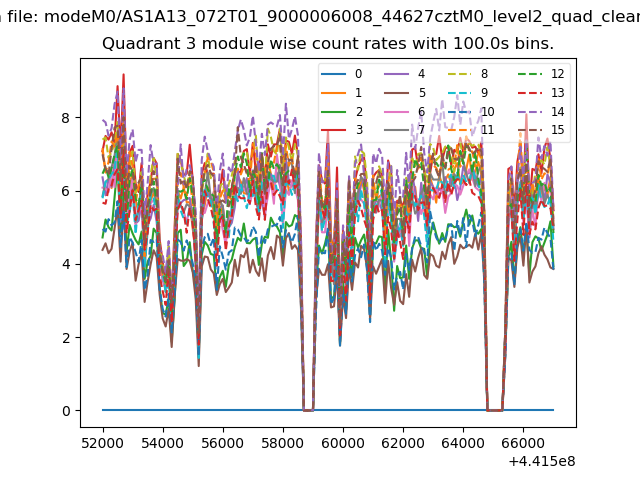 |
 |
| Parameter | Plot |
|---|---|
| CZT HV Monitor | 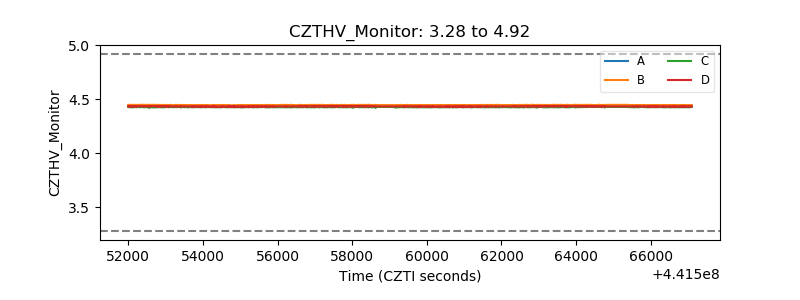 |
| D_VDD | 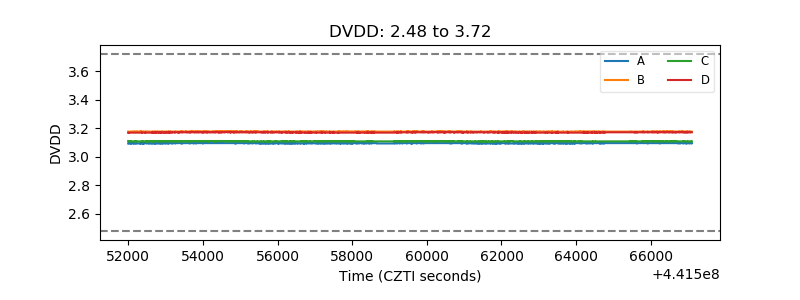 |
| Temperature 1 | 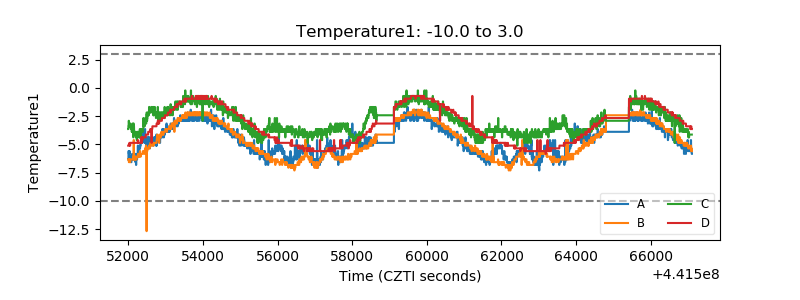 |
| Veto HV Monitor | 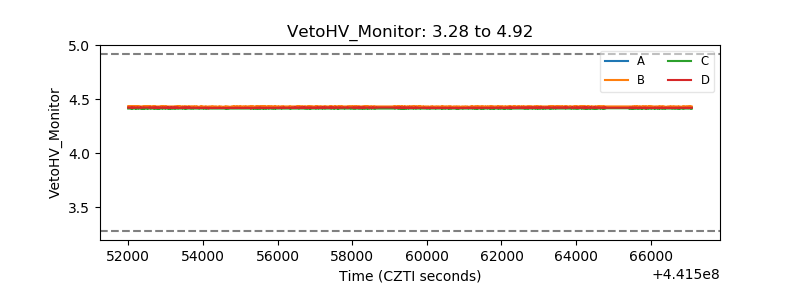 |
| Veto LLD | 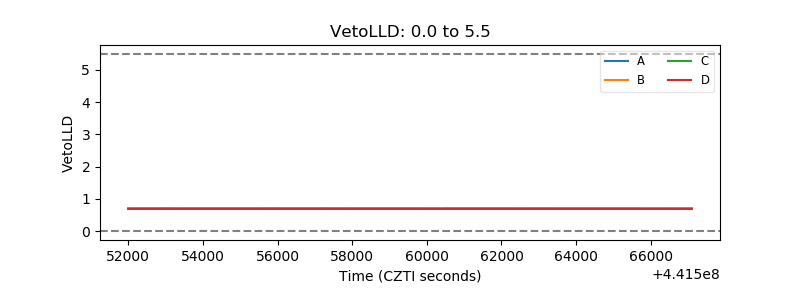 |
| Alpha Counter | 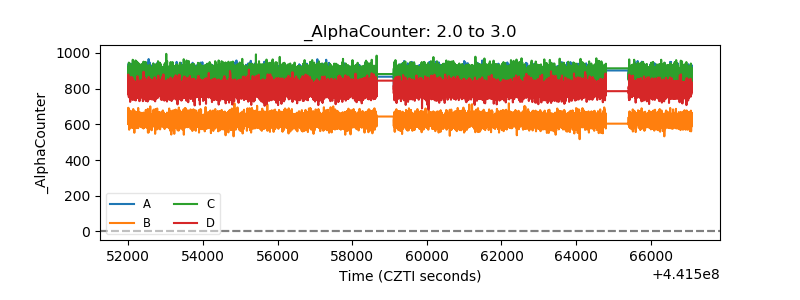 |
| _CPM_Rate | 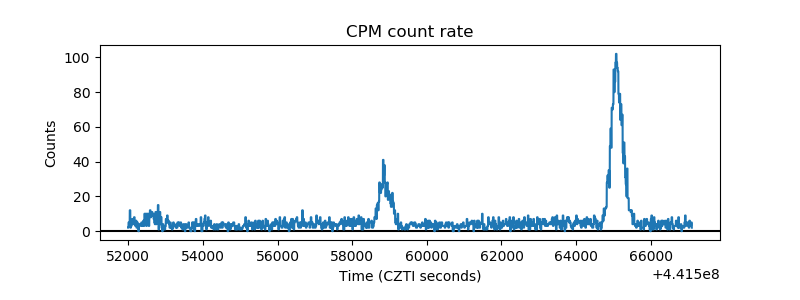 |
| CZT Counter | 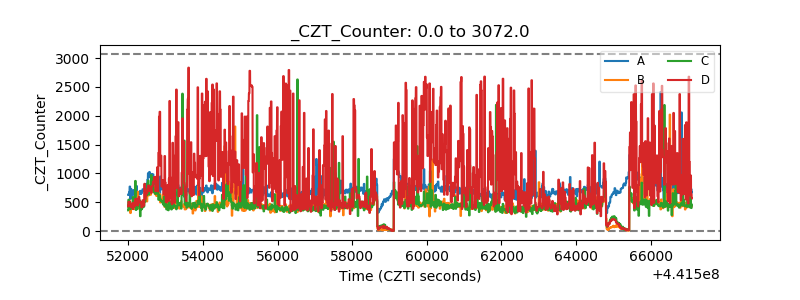 |
| +2.5 Volts monitor | 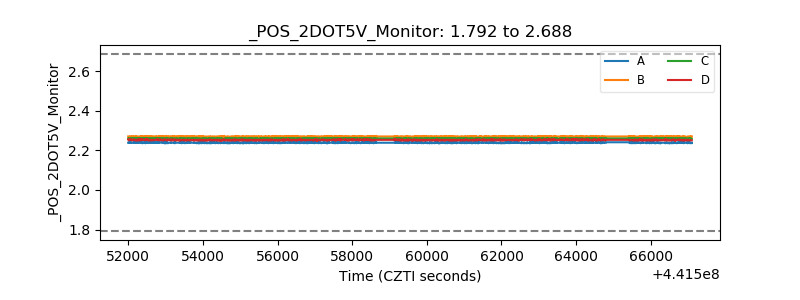 |
| +5 Volts monitor | 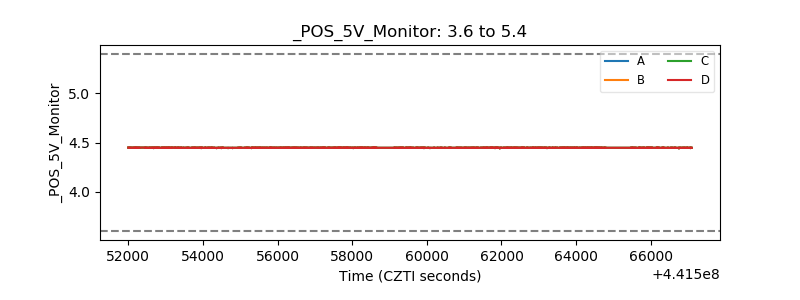 |
| _ROLL_ROT | 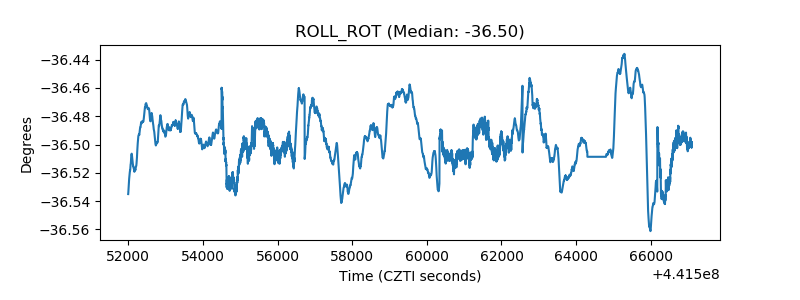 |
| _Roll_DEC | 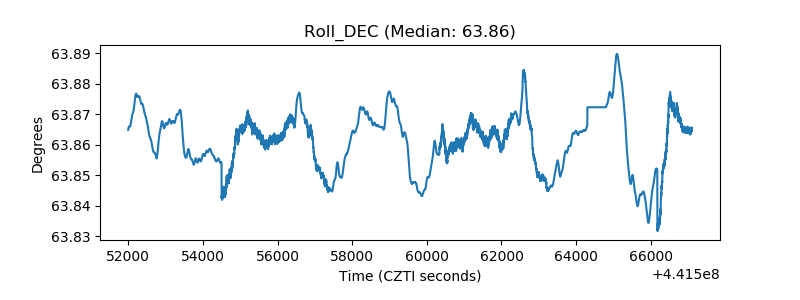 |
| _Roll_RA | 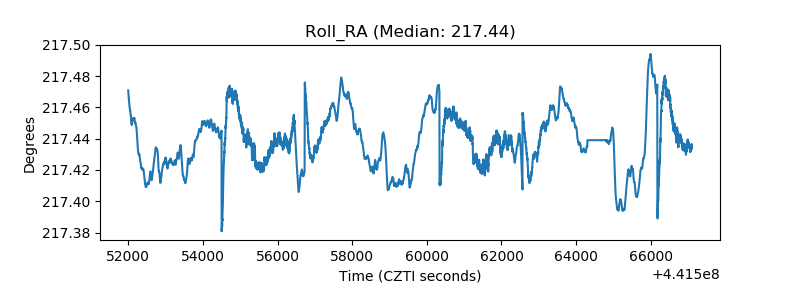 |
| Veto Counter | 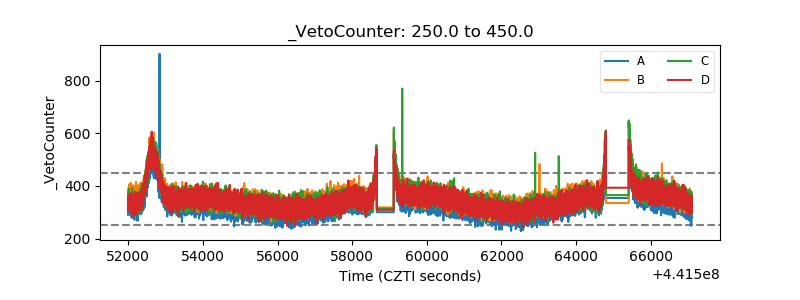 |