| Param | Original file | Final file |
|---|---|---|
| Filename | modeM0/AS1A13_072T01_9000006008_44628cztM0_level2.fits | modeM0/AS1A13_072T01_9000006008_44628cztM0_level2_quad_clean.evt |
| Size (bytes) | 471,813,120 | 98,124,480 |
| Size | 450.0 MB | 93.6 MB |
| Events in quadrant A | 4,661,388 | 669,025 |
| Events in quadrant B | 2,870,878 | 689,128 |
| Events in quadrant C | 2,944,136 | 651,437 |
| Events in quadrant D | 6,498,044 | 521,198 |
| Mode M0 | |||
|---|---|---|---|
| Quadrant | BADHDUFLAG | Total packets | Discarded packets |
| A | 0 | 19089 | 1 |
| B | 0 | 13099 | 1 |
| C | 0 | 13352 | 1 |
| D | 0 | 23787 | 1 |
| Mode SS | |||
|---|---|---|---|
| Quadrant | BADHDUFLAG | Total packets | Discarded packets |
| A | 0 | 126 | 0 |
| B | 0 | 126 | 0 |
| C | 0 | 126 | 0 |
| D | 0 | 126 | 0 |
| Mode M9 | |||
|---|---|---|---|
| Quadrant | BADHDUFLAG | Total packets | Discarded packets |
| A | 0 | 9 | 0 |
| B | 0 | 9 | 0 |
| C | 0 | 9 | 0 |
| D | 0 | 9 | 0 |
| Quadrant | Total seconds | Saturated seconds | Saturation percentage |
|---|---|---|---|
| A | 6313 | 109 | 1.726596% |
| B | 6313 | 55 | 0.871218% |
| C | 6313 | 56 | 0.887058% |
| D | 6313 | 1033 | 16.363060% |
Noise dominated data is calculated using 1-second bins in cleaned event files. If a bin has >2000 counts, and if more than 50% of those come from <1% of pixels, then it is considered to be noise-dominated and hence unusable.
| Quadrant | # 1 sec bins | Bins with >0 counts | Bins with >2000 counts | High rate bins dominated by noise | Noise dominated (total time) | Noise dominated (detector-on time) | Marked lightcurve |
|---|---|---|---|---|---|---|---|
| A | 7163 | 6314 | 17 | 17 | 0.24% | 0.27% | 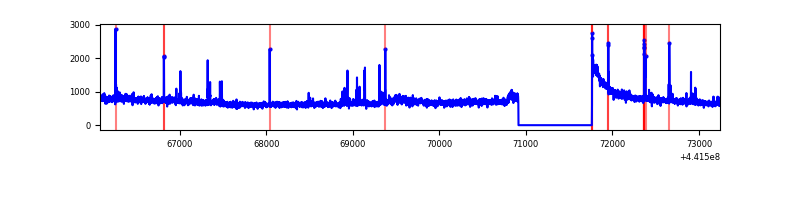 |
| B | 7163 | 6314 | 10 | 10 | 0.14% | 0.16% | 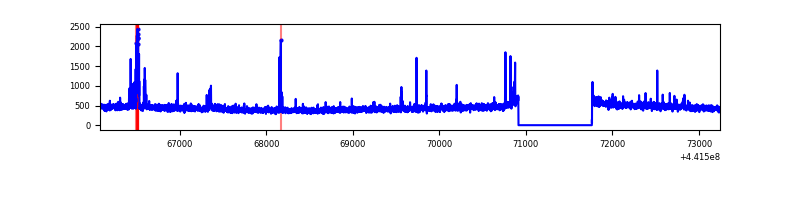 |
| C | 7163 | 6314 | 20 | 20 | 0.28% | 0.32% | 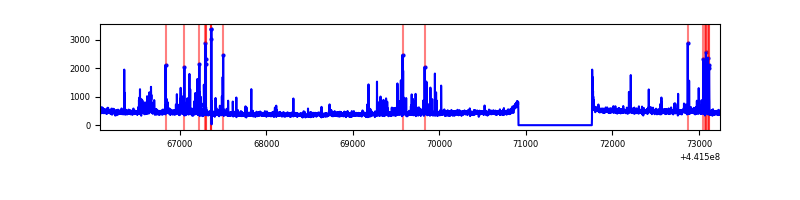 |
| D | 7163 | 6314 | 902 | 902 | 12.59% | 14.29% | 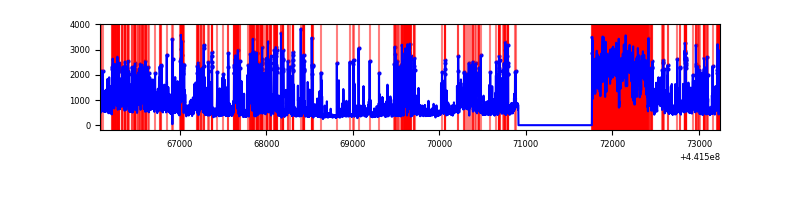 |
Top three noisy pixels from each quadrant. If the there are fewer than three noisy pixels in the level2.evt file, extra rows are filled as -1
| Pixel properties | Quadrant properties | ||||||
|---|---|---|---|---|---|---|---|
| Quadrant | DetID | PixID | Counts | Sigma | Mean | Median | Sigma |
| A | 10 | 83 | 1733721 | 12162.77 | 686 | 670 | 142.5 |
| A | 15 | 223 | 179233 | 1253.18 | 686 | 670 | 142.5 |
| A | 10 | 248 | 38060 | 262.41 | 686 | 670 | 142.5 |
| B | 0 | 186 | 70252 | 507.64 | 687 | 666 | 137.1 |
| B | 5 | 172 | 29675 | 211.63 | 687 | 666 | 137.1 |
| B | 12 | 111 | 17272 | 121.14 | 687 | 666 | 137.1 |
| C | 12 | 2 | 138211 | 861.78 | 678 | 680 | 159.6 |
| C | 12 | 250 | 73354 | 455.38 | 678 | 680 | 159.6 |
| C | 3 | 233 | 41827 | 257.83 | 678 | 680 | 159.6 |
| D | 13 | 153 | 1594472 | 9863.84 | 629 | 607 | 161.6 |
| D | 13 | 249 | 1106215 | 6842.2 | 629 | 607 | 161.6 |
| D | 1 | 52 | 827546 | 5117.62 | 629 | 607 | 161.6 |
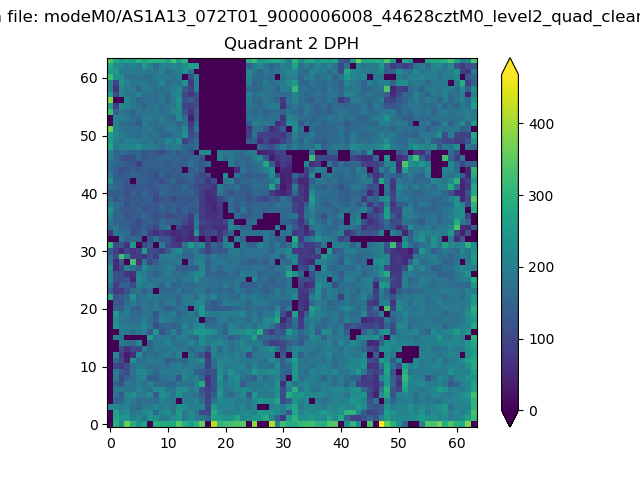
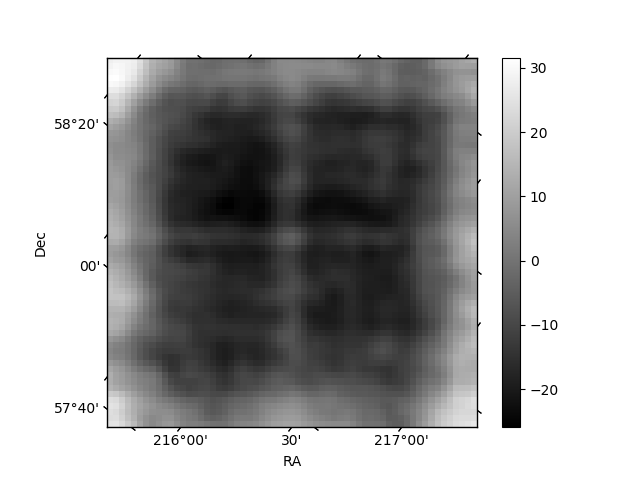
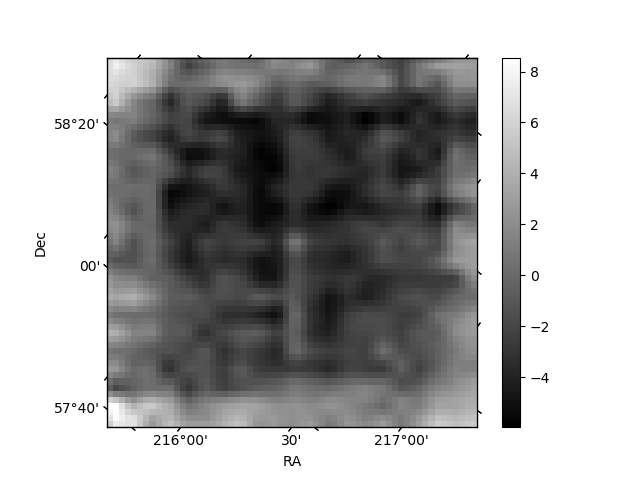
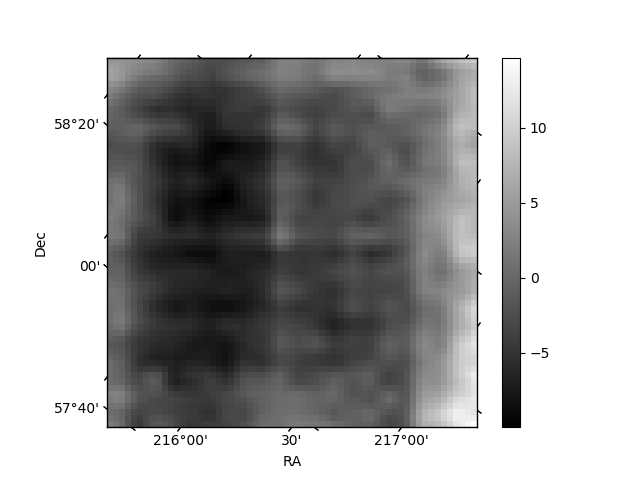
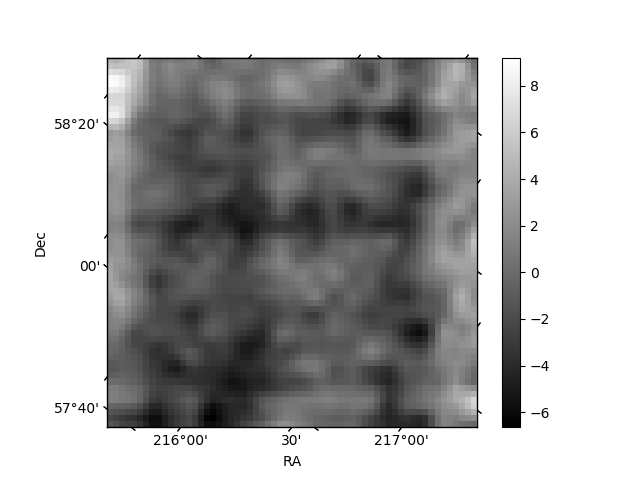
Histogram calculated using DETX and DETY for each event in the final _common_clean file
| Quadrant A | 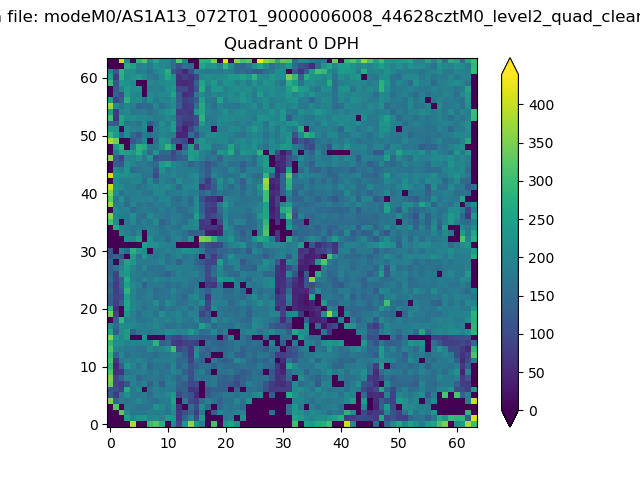 |
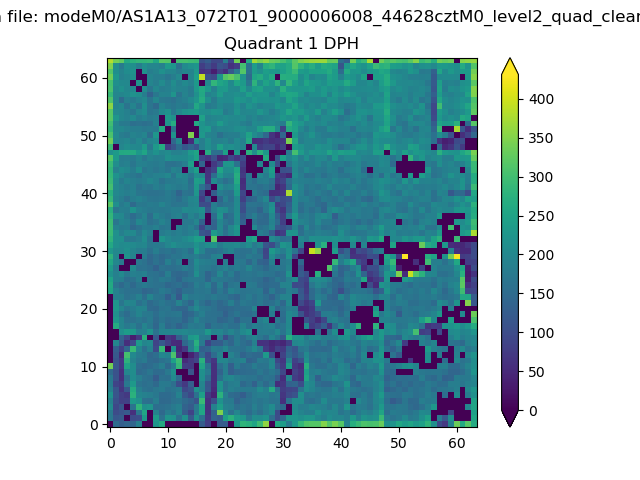 |
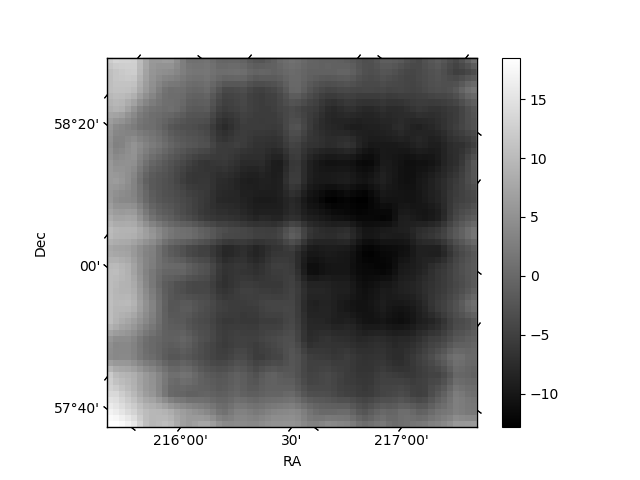
Quadrant B |
|---|---|---|---|
| Quadrant D | 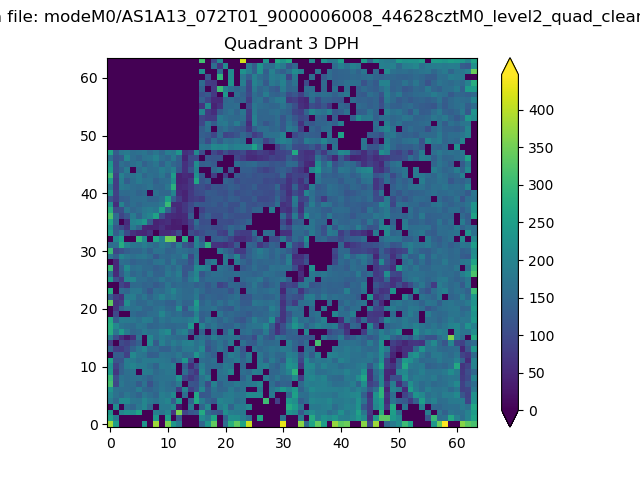 |
 |
Quadrant C |
| Plot type | Count rate plots | Images |
|---|---|---|
| Comparison with Poisson distribution Blue bars denote a histogram of data divided into 1 sec bins. Red curve is a Poisson curve with rate = median count rate of data. |
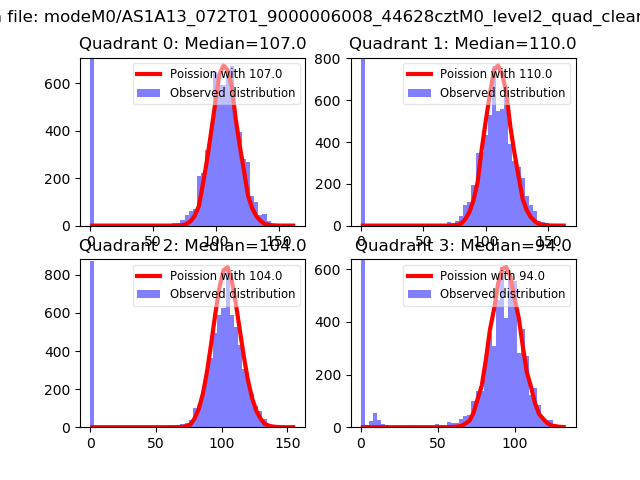 |
 |
| Quadrant-wise count rates Data is divided into 100 sec bins |
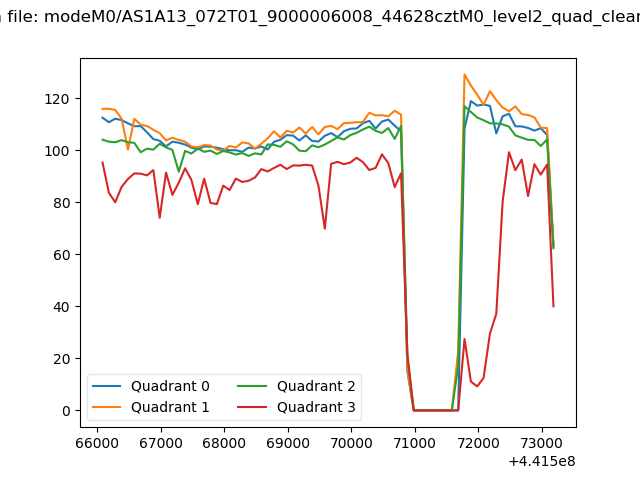 |
|
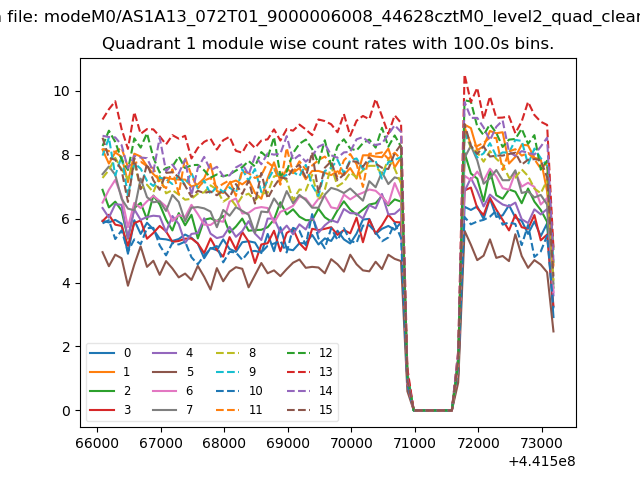
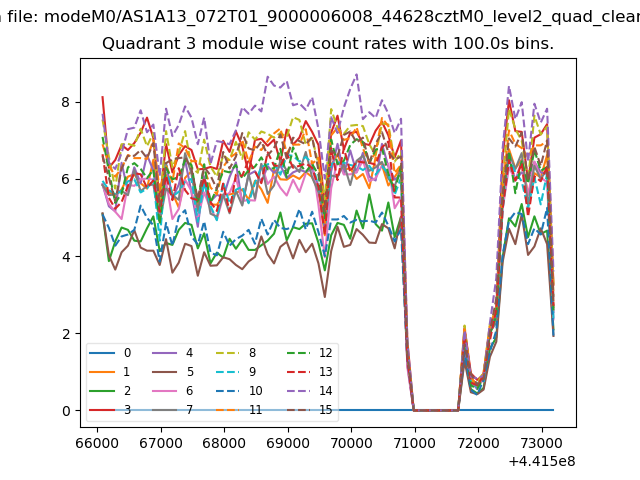
| Module-wise count rates for Quadrant A Data is divided into 100 sec bins |
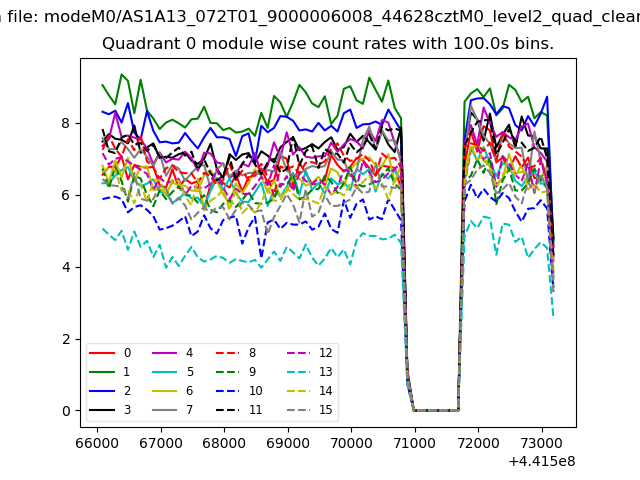 |
 |
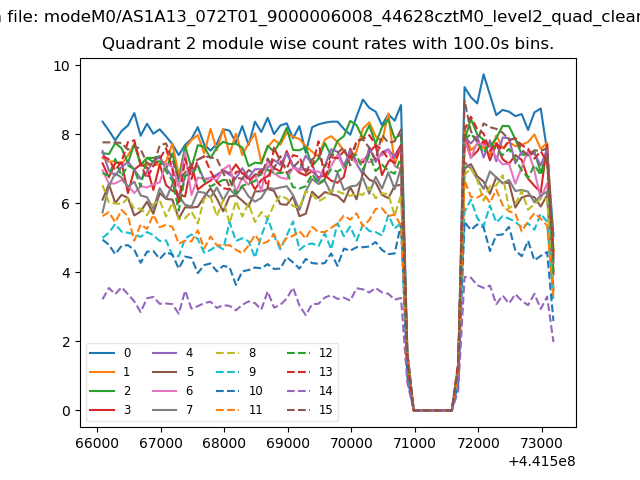
| Module-wise count rates for Quadrant B Data is divided into 100 sec bins |
 |
 |
| Module-wise count rates for Quadrant C Data is divided into 100 sec bins |
 |
 |
| Module-wise count rates for Quadrant D Data is divided into 100 sec bins |
 |
 |
| Parameter | Plot |
|---|---|
| CZT HV Monitor | 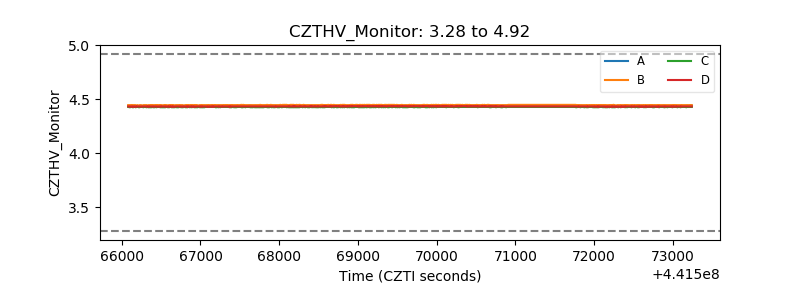 |
| D_VDD | 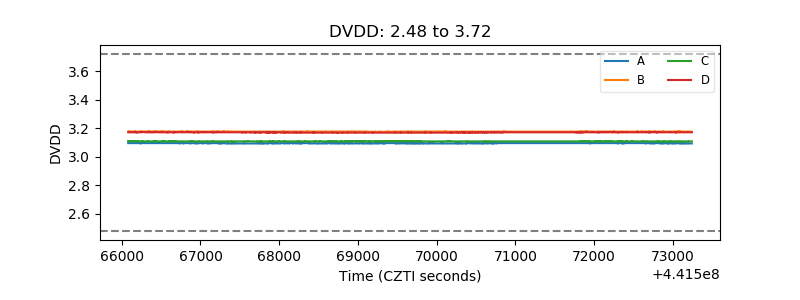 |
| Temperature 1 | 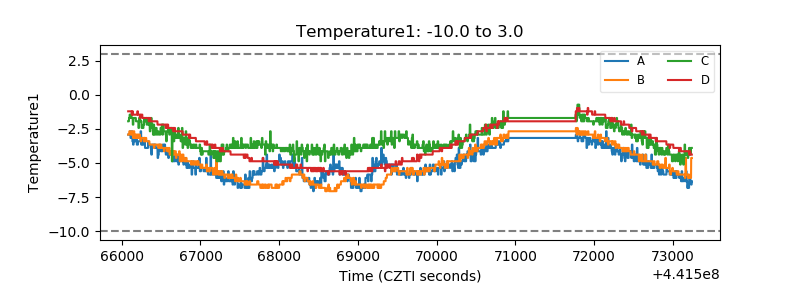 |
| Veto HV Monitor | 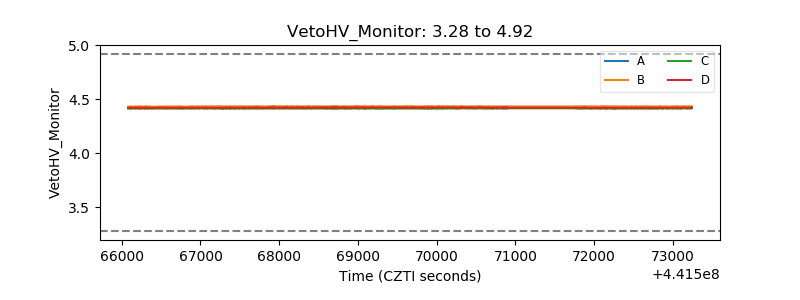 |
| Veto LLD | 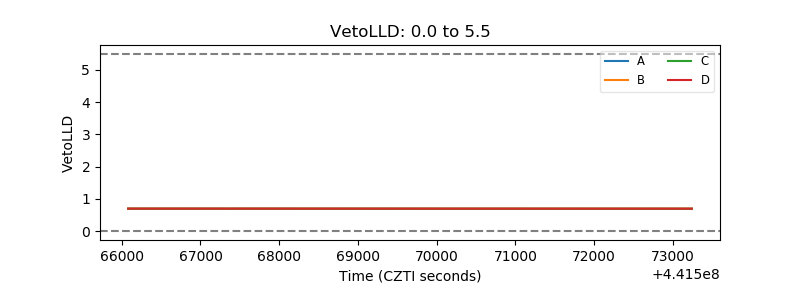 |
| Alpha Counter | 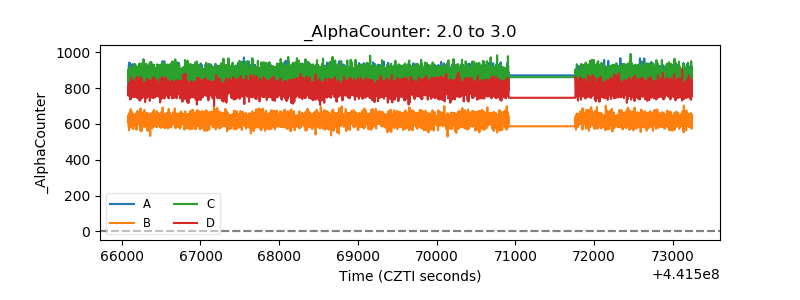 |
| _CPM_Rate | 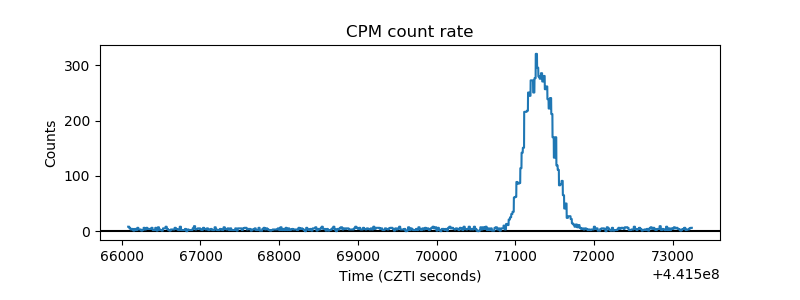 |
| CZT Counter | 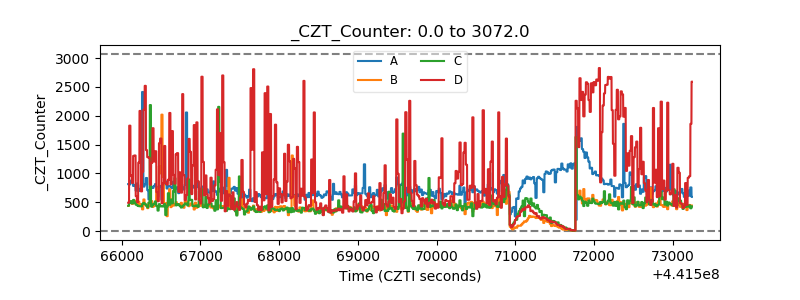 |
| +2.5 Volts monitor | 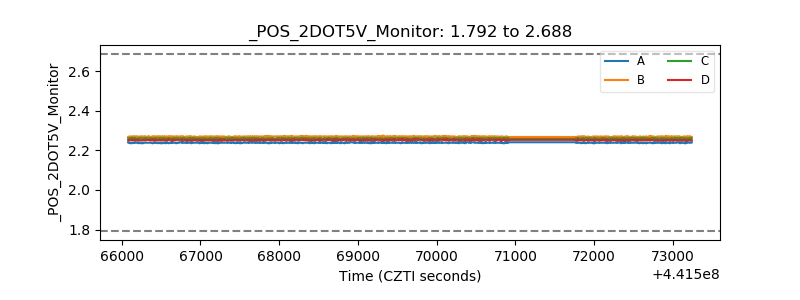 |
| +5 Volts monitor | 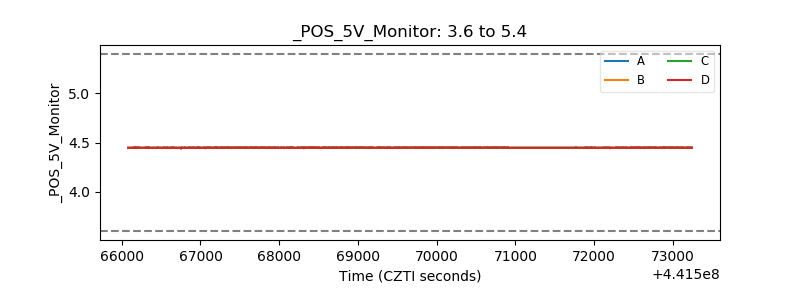 |
| _ROLL_ROT | 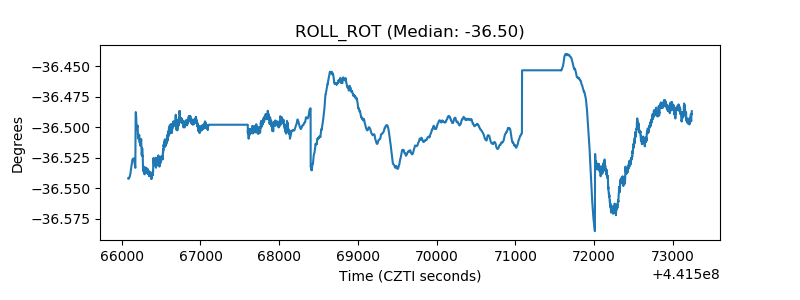 |
| _Roll_DEC | 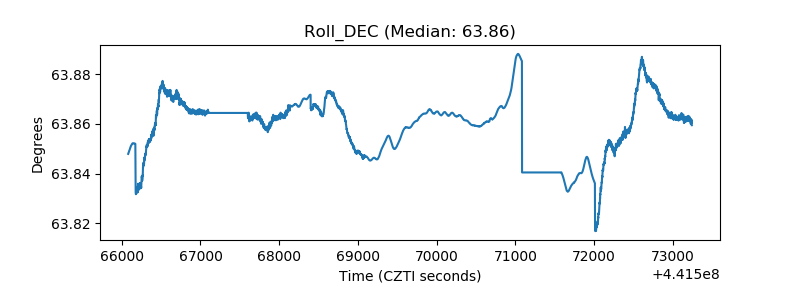 |
| _Roll_RA | 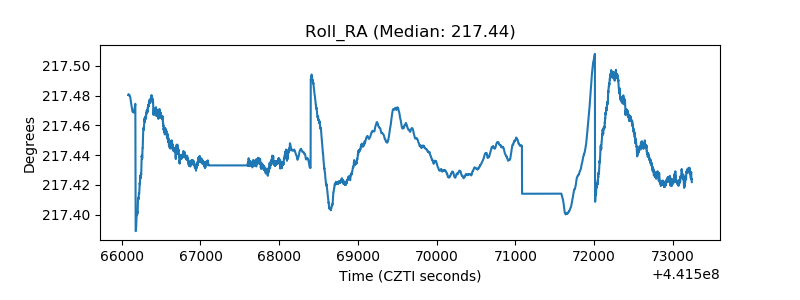 |
| Veto Counter | 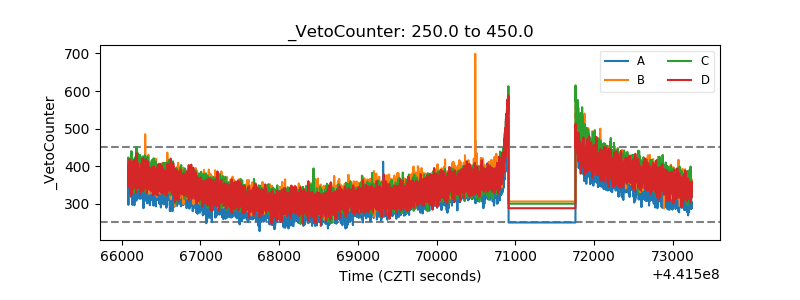 |