| Param | Original file | Final file |
|---|---|---|
| Filename | modeM0/AS1A13_072T01_9000006008_44634cztM0_level2.fits | modeM0/AS1A13_072T01_9000006008_44634cztM0_level2_quad_clean.evt |
| Size (bytes) | 505,964,160 | 108,959,040 |
| Size | 482.5 MB | 103.9 MB |
| Events in quadrant A | 4,902,346 | 740,066 |
| Events in quadrant B | 3,192,304 | 779,748 |
| Events in quadrant C | 3,334,473 | 731,640 |
| Events in quadrant D | 6,804,263 | 601,867 |
| Mode M0 | |||
|---|---|---|---|
| Quadrant | BADHDUFLAG | Total packets | Discarded packets |
| A | 0 | 19901 | 2 |
| B | 0 | 13925 | 2 |
| C | 0 | 14468 | 2 |
| D | 0 | 24796 | 2 |
| Mode SS | |||
|---|---|---|---|
| Quadrant | BADHDUFLAG | Total packets | Discarded packets |
| A | 0 | 130 | 0 |
| B | 0 | 130 | 0 |
| C | 0 | 130 | 0 |
| D | 0 | 130 | 0 |
| Mode M9 | |||
|---|---|---|---|
| Quadrant | BADHDUFLAG | Total packets | Discarded packets |
| A | 0 | 14 | 0 |
| B | 0 | 14 | 0 |
| C | 0 | 15 | 0 |
| D | 0 | 15 | 0 |
| Quadrant | Total seconds | Saturated seconds | Saturation percentage |
|---|---|---|---|
| A | 6394 | 174 | 2.721301% |
| B | 6394 | 94 | 1.470128% |
| C | 6394 | 41 | 0.641226% |
| D | 6394 | 757 | 11.839224% |
Noise dominated data is calculated using 1-second bins in cleaned event files. If a bin has >2000 counts, and if more than 50% of those come from <1% of pixels, then it is considered to be noise-dominated and hence unusable.
| Quadrant | # 1 sec bins | Bins with >0 counts | Bins with >2000 counts | High rate bins dominated by noise | Noise dominated (total time) | Noise dominated (detector-on time) | Marked lightcurve |
|---|---|---|---|---|---|---|---|
| A | 7599 | 6395 | 25 | 25 | 0.33% | 0.39% | 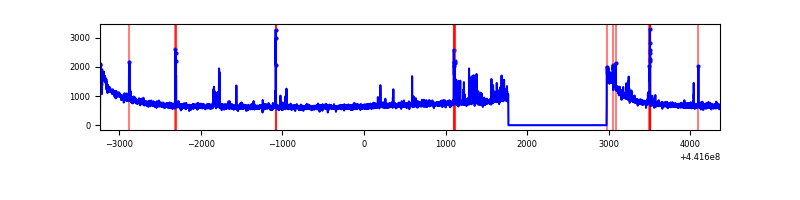 |
| B | 7599 | 6395 | 23 | 23 | 0.30% | 0.36% | 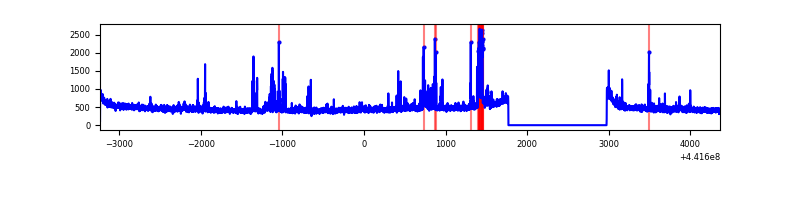 |
| C | 7599 | 6395 | 34 | 34 | 0.45% | 0.53% |  |
| D | 7599 | 6395 | 680 | 680 | 8.95% | 10.63% | 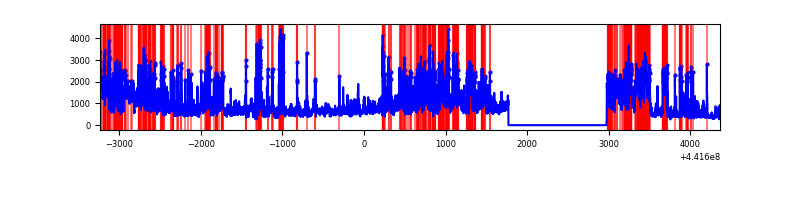 |
Top three noisy pixels from each quadrant. If the there are fewer than three noisy pixels in the level2.evt file, extra rows are filled as -1
| Pixel properties | Quadrant properties | ||||||
|---|---|---|---|---|---|---|---|
| Quadrant | DetID | PixID | Counts | Sigma | Mean | Median | Sigma |
| A | 10 | 83 | 1918515 | 12844.82 | 720 | 705 | 149.3 |
| A | 13 | 248 | 103088 | 685.73 | 720 | 705 | 149.3 |
| A | 10 | 248 | 77257 | 512.72 | 720 | 705 | 149.3 |
| B | 0 | 183 | 198785 | 1402.3 | 729 | 708 | 141.3 |
| B | 5 | 172 | 44145 | 307.52 | 729 | 708 | 141.3 |
| B | 0 | 189 | 34130 | 236.61 | 729 | 708 | 141.3 |
| C | 12 | 2 | 427791 | 2605.38 | 705 | 710 | 163.9 |
| C | 3 | 233 | 111447 | 675.54 | 705 | 710 | 163.9 |
| C | 14 | 254 | 19605 | 115.27 | 705 | 710 | 163.9 |
| D | 13 | 174 | 1332928 | 8023.4 | 662 | 638 | 166.1 |
| D | 13 | 249 | 1186857 | 7143.72 | 662 | 638 | 166.1 |
| D | 13 | 153 | 626133 | 3766.9 | 662 | 638 | 166.1 |
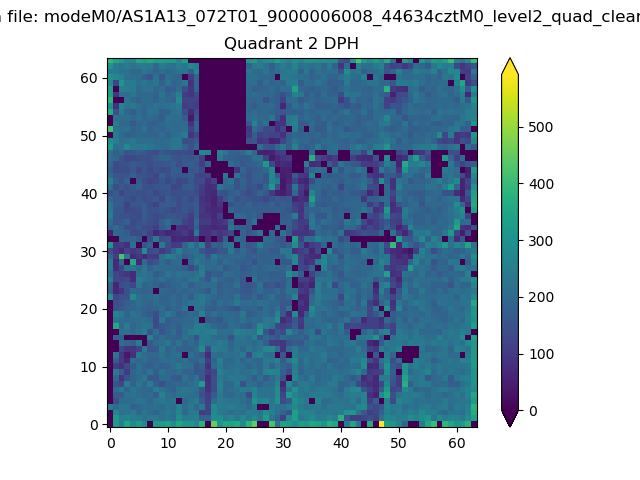
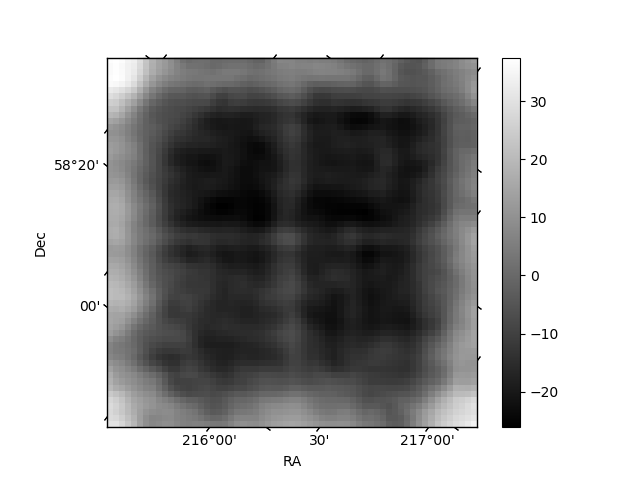
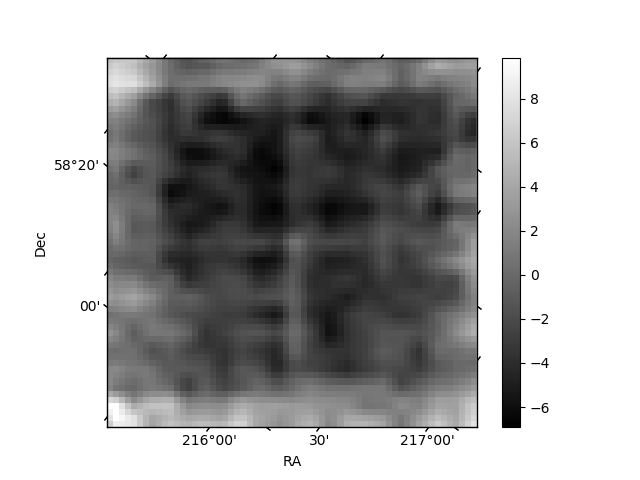
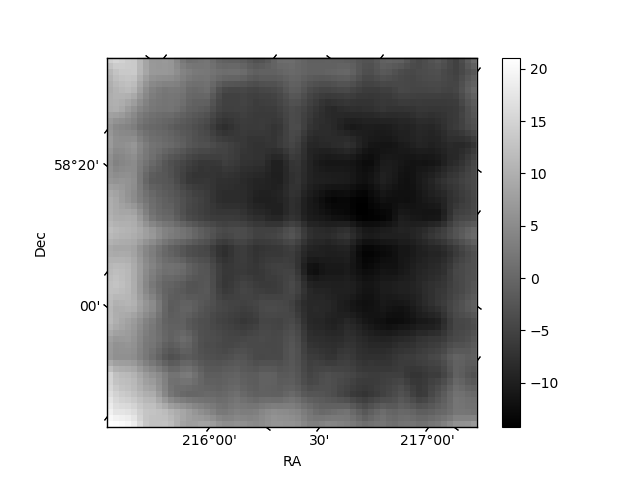
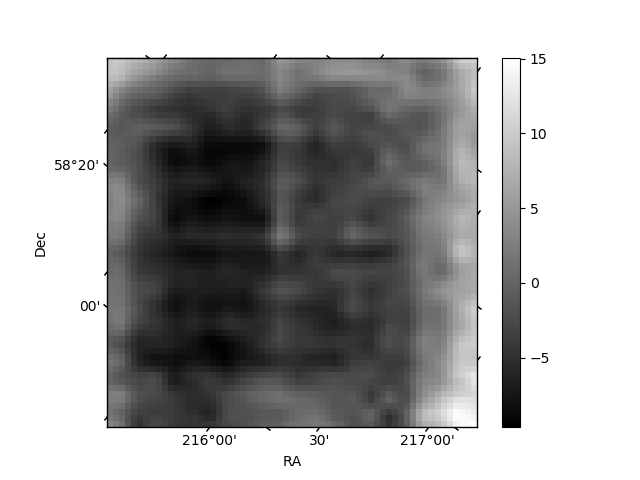
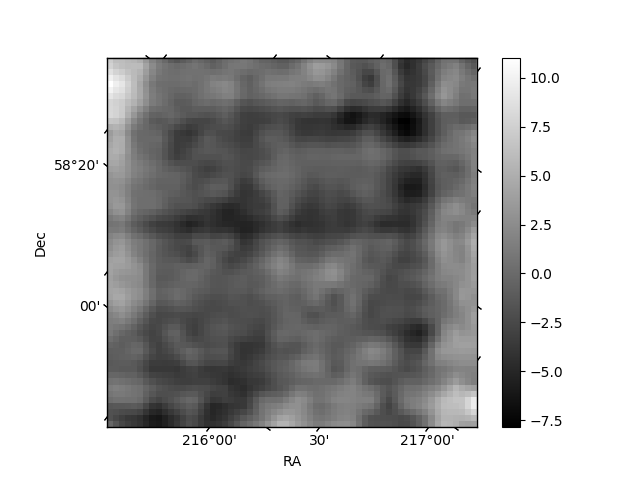
Histogram calculated using DETX and DETY for each event in the final _common_clean file
| Quadrant A | 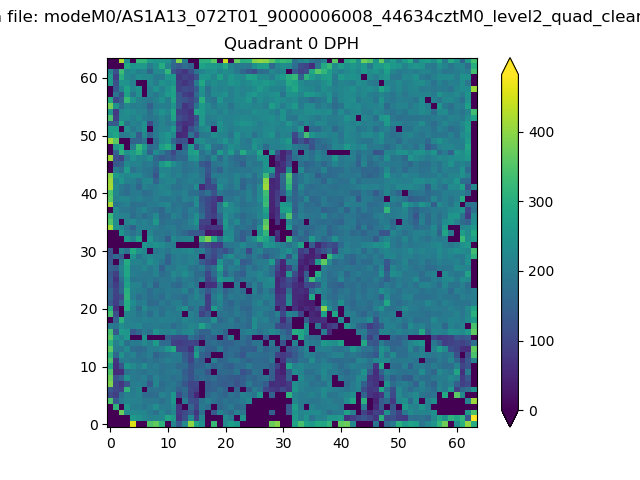 |
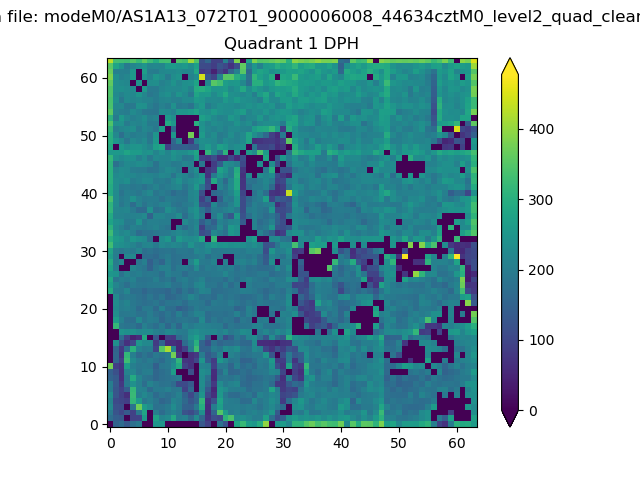 |
Quadrant B |
|---|---|---|---|
| Quadrant D | 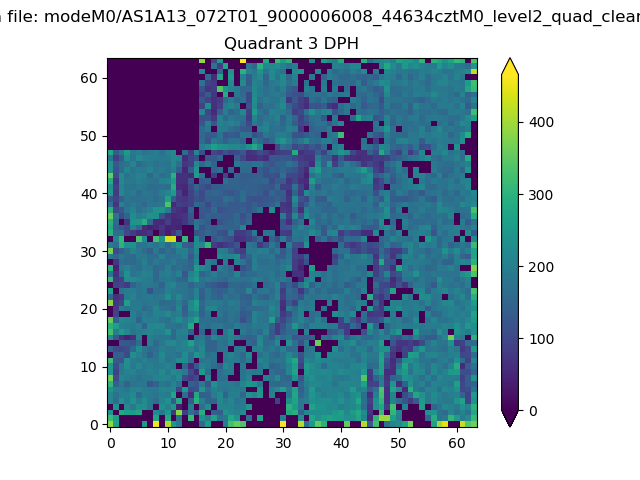 |
 |
Quadrant C |
| Plot type | Count rate plots | Images |
|---|---|---|
| Comparison with Poisson distribution Blue bars denote a histogram of data divided into 1 sec bins. Red curve is a Poisson curve with rate = median count rate of data. |
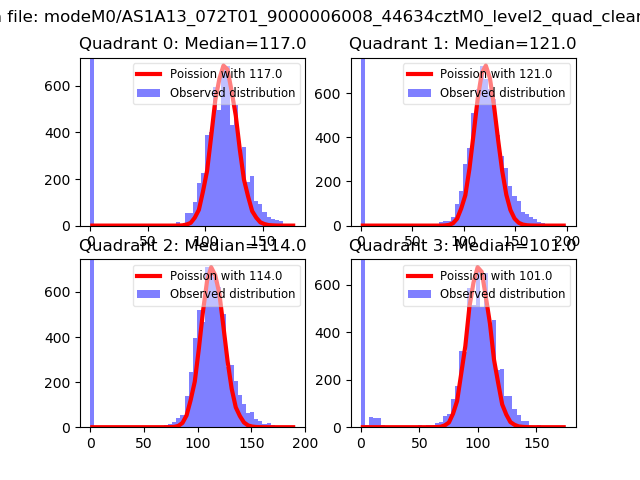 |
 |
| Quadrant-wise count rates Data is divided into 100 sec bins |
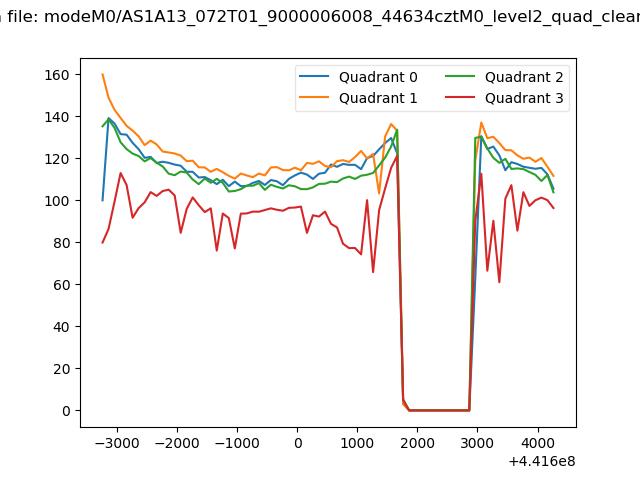 |
|
| Module-wise count rates for Quadrant A Data is divided into 100 sec bins |
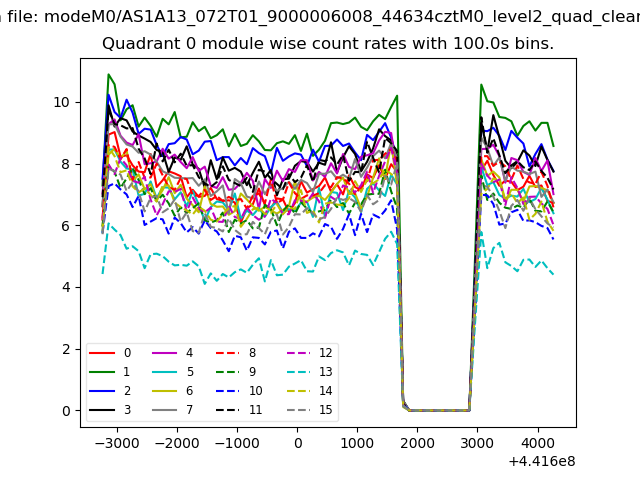 |
 |
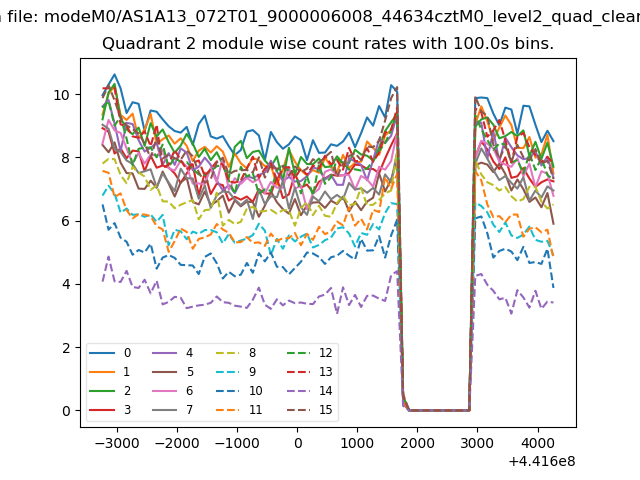
| Module-wise count rates for Quadrant B Data is divided into 100 sec bins |
 |
 |
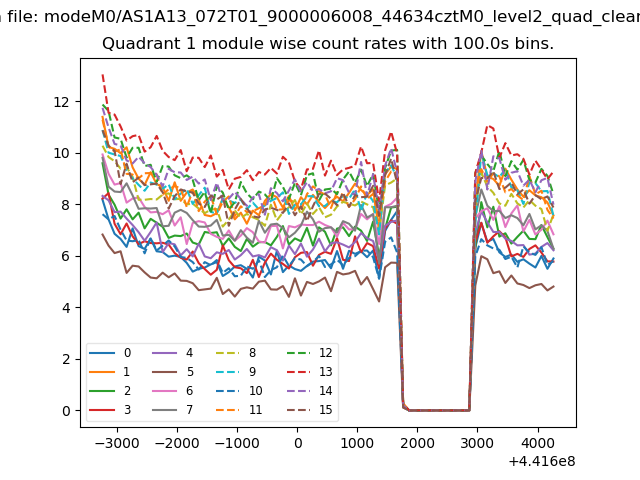
| Module-wise count rates for Quadrant C Data is divided into 100 sec bins |
 |
 |
| Module-wise count rates for Quadrant D Data is divided into 100 sec bins |
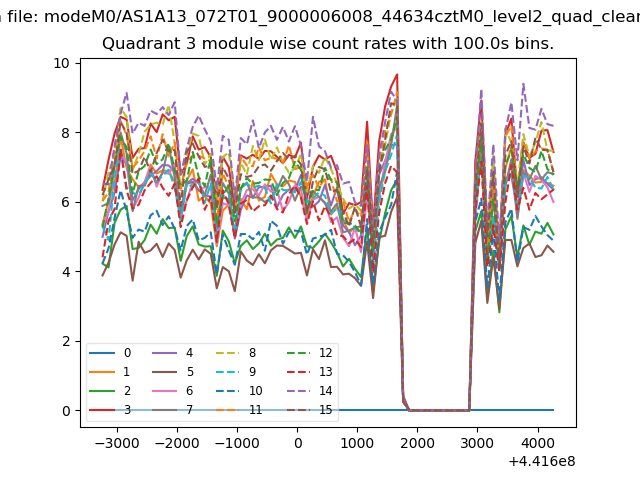 |
 |
| Parameter | Plot |
|---|---|
| CZT HV Monitor | 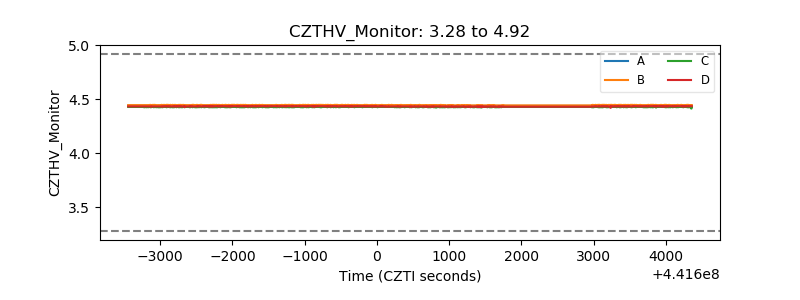 |
| D_VDD | 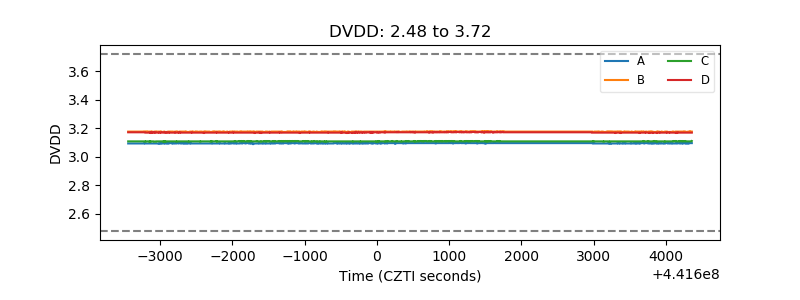 |
| Temperature 1 | 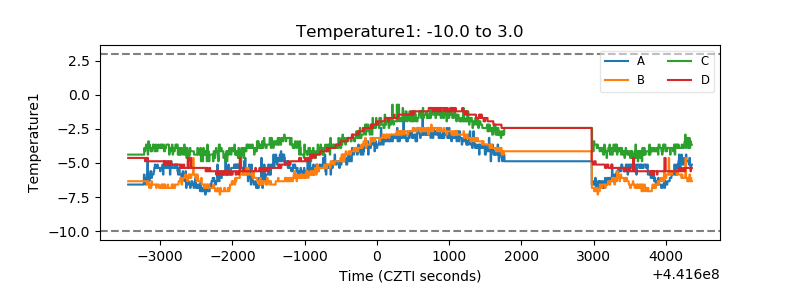 |
| Veto HV Monitor | 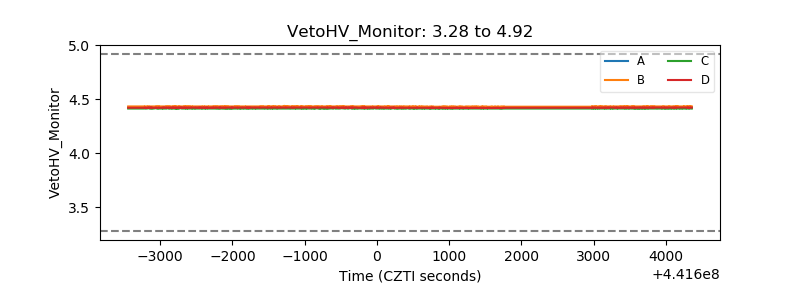 |
| Veto LLD | 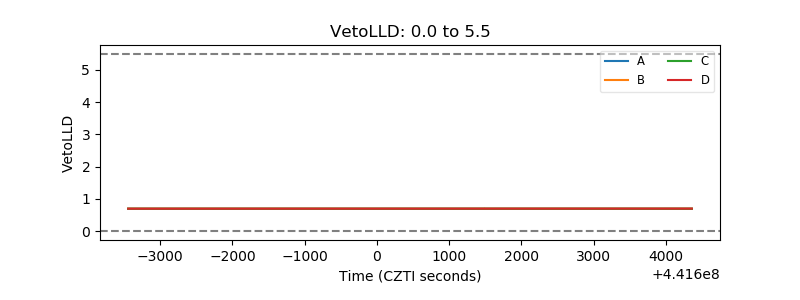 |
| Alpha Counter | 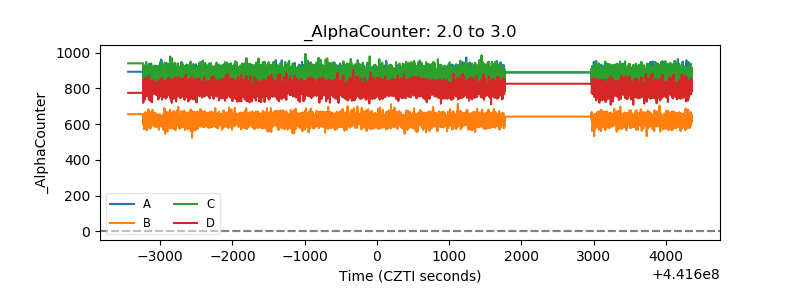 |
| _CPM_Rate | 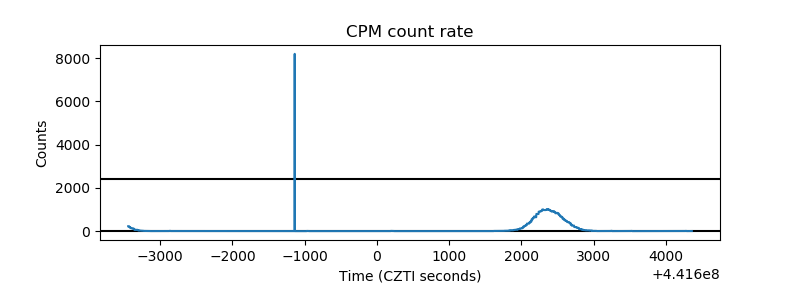 |
| CZT Counter | 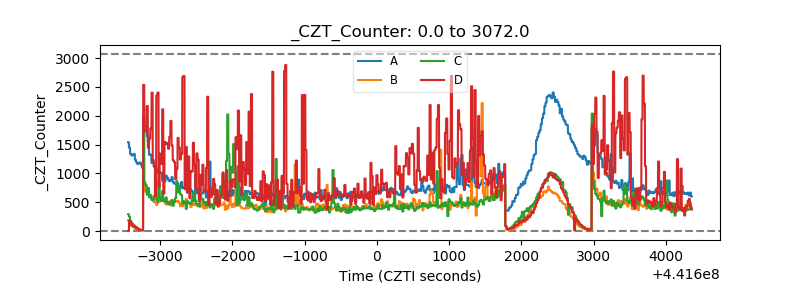 |
| +2.5 Volts monitor | 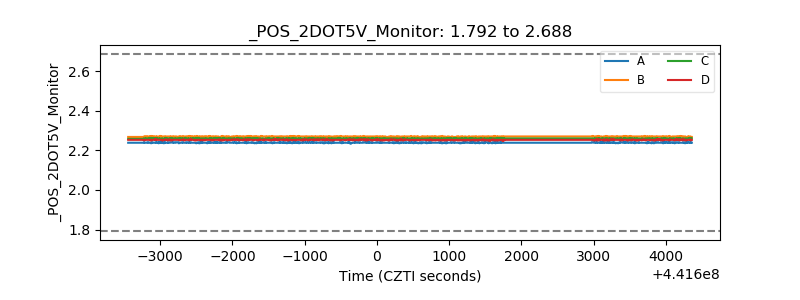 |
| +5 Volts monitor | 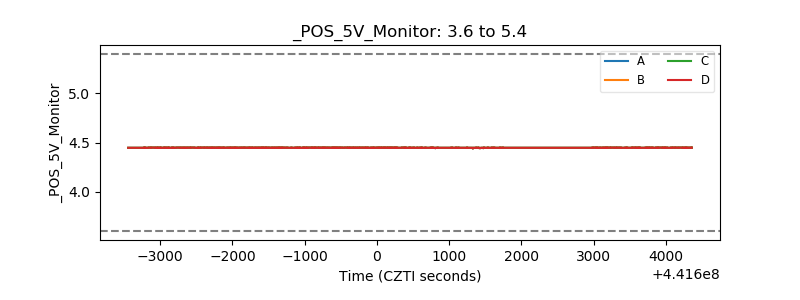 |
| _ROLL_ROT |  |
| _Roll_DEC | 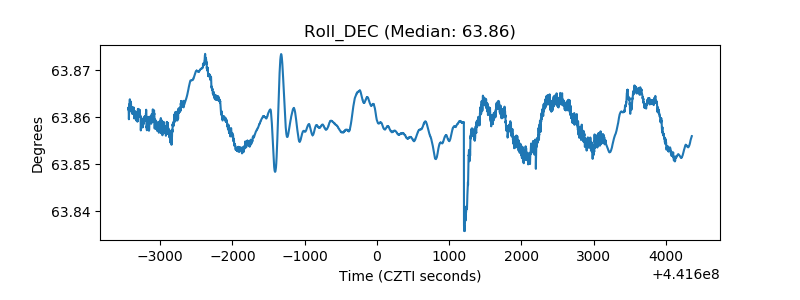 |
| _Roll_RA | 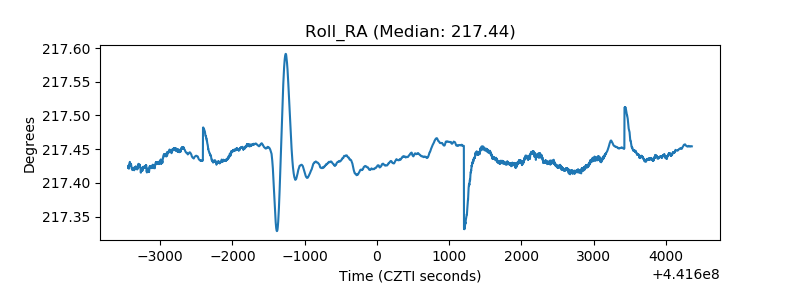 |
| Veto Counter | 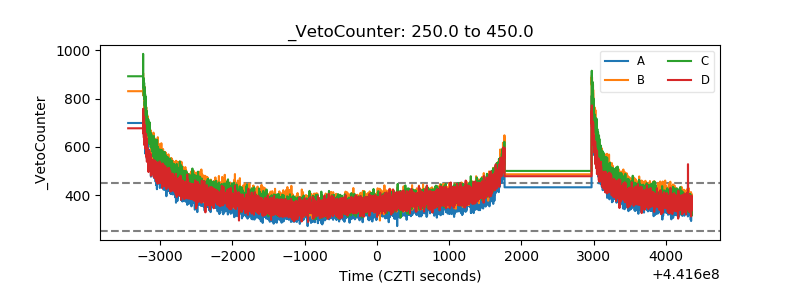 |