| Param | Original file | Final file |
|---|---|---|
| Filename | modeM0/AS1A13_072T01_9000006008_44637cztM0_level2.fits | modeM0/AS1A13_072T01_9000006008_44637cztM0_level2_quad_clean.evt |
| Size (bytes) | 936,852,480 | 196,292,160 |
| Size | 893.5 MB | 187.2 MB |
| Events in quadrant A | 9,023,375 | 1,315,007 |
| Events in quadrant B | 5,955,430 | 1,379,814 |
| Events in quadrant C | 9,490,196 | 1,244,107 |
| Events in quadrant D | 9,234,407 | 1,132,666 |
| Mode M0 | |||
|---|---|---|---|
| Quadrant | BADHDUFLAG | Total packets | Discarded packets |
| A | 0 | 37973 | 1 |
| B | 0 | 26995 | 1 |
| C | 0 | 37470 | 1 |
| D | 0 | 36291 | 1 |
| Mode SS | |||
|---|---|---|---|
| Quadrant | BADHDUFLAG | Total packets | Discarded packets |
| A | 0 | 254 | 0 |
| B | 0 | 254 | 0 |
| C | 0 | 254 | 0 |
| D | 0 | 254 | 0 |
| Mode M9 | |||
|---|---|---|---|
| Quadrant | BADHDUFLAG | Total packets | Discarded packets |
| A | 0 | 8 | 0 |
| B | 0 | 8 | 0 |
| C | 0 | 8 | 0 |
| D | 0 | 8 | 0 |
| Quadrant | Total seconds | Saturated seconds | Saturation percentage |
|---|---|---|---|
| A | 12608 | 553 | 4.386104% |
| B | 12609 | 400 | 3.172337% |
| C | 12609 | 875 | 6.939488% |
| D | 12609 | 922 | 7.312237% |
Noise dominated data is calculated using 1-second bins in cleaned event files. If a bin has >2000 counts, and if more than 50% of those come from <1% of pixels, then it is considered to be noise-dominated and hence unusable.
| Quadrant | # 1 sec bins | Bins with >0 counts | Bins with >2000 counts | High rate bins dominated by noise | Noise dominated (total time) | Noise dominated (detector-on time) | Marked lightcurve |
|---|---|---|---|---|---|---|---|
| A | 13398 | 12609 | 37 | 37 | 0.28% | 0.29% |  |
| B | 13399 | 12610 | 36 | 36 | 0.27% | 0.29% |  |
| C | 13399 | 12610 | 647 | 647 | 4.83% | 5.13% |  |
| D | 13399 | 12610 | 477 | 477 | 3.56% | 3.78% |  |
Top three noisy pixels from each quadrant. If the there are fewer than three noisy pixels in the level2.evt file, extra rows are filled as -1
| Pixel properties | Quadrant properties | ||||||
|---|---|---|---|---|---|---|---|
| Quadrant | DetID | PixID | Counts | Sigma | Mean | Median | Sigma |
| A | 10 | 83 | 3229291 | 11112.03 | 1410 | 1379 | 290.5 |
| A | 10 | 248 | 203823 | 696.91 | 1410 | 1379 | 290.5 |
| A | 13 | 248 | 116178 | 395.19 | 1410 | 1379 | 290.5 |
| B | 0 | 183 | 156302 | 562.28 | 1401 | 1357 | 275.6 |
| B | 5 | 172 | 98229 | 351.54 | 1401 | 1357 | 275.6 |
| B | 0 | 189 | 73737 | 262.66 | 1401 | 1357 | 275.6 |
| C | 12 | 2 | 3976989 | 12763.06 | 1340 | 1349 | 311.5 |
| C | 14 | 254 | 212417 | 677.59 | 1340 | 1349 | 311.5 |
| C | 3 | 233 | 47441 | 147.97 | 1340 | 1349 | 311.5 |
| D | 1 | 52 | 1611239 | 4871.58 | 1342 | 1298 | 330.5 |
| D | 13 | 249 | 672947 | 2032.37 | 1342 | 1298 | 330.5 |
| D | 2 | 37 | 506703 | 1529.32 | 1342 | 1298 | 330.5 |
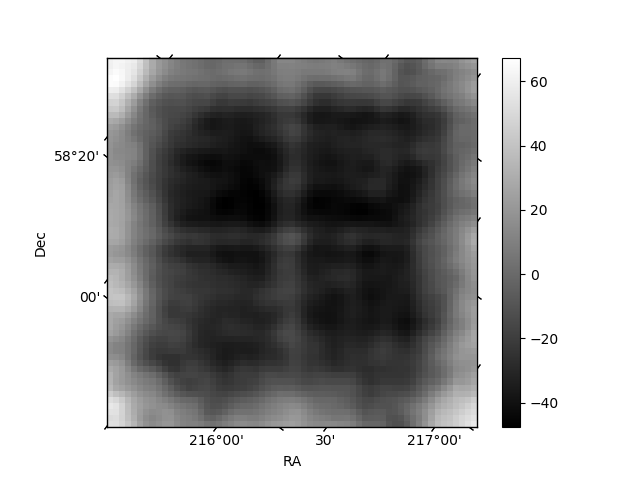
Histogram calculated using DETX and DETY for each event in the final _common_clean file
| Quadrant A | 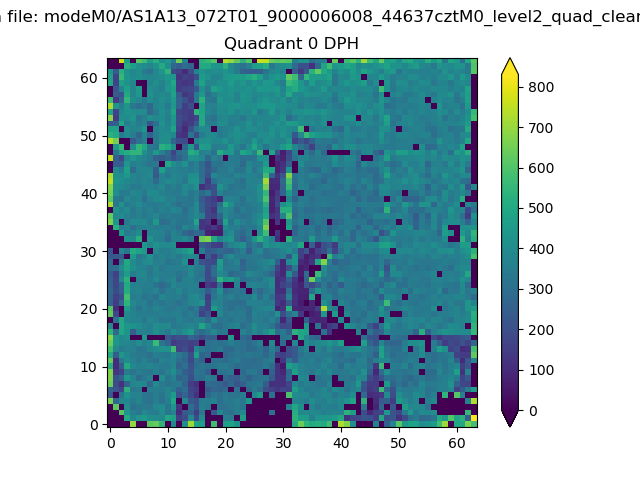 |
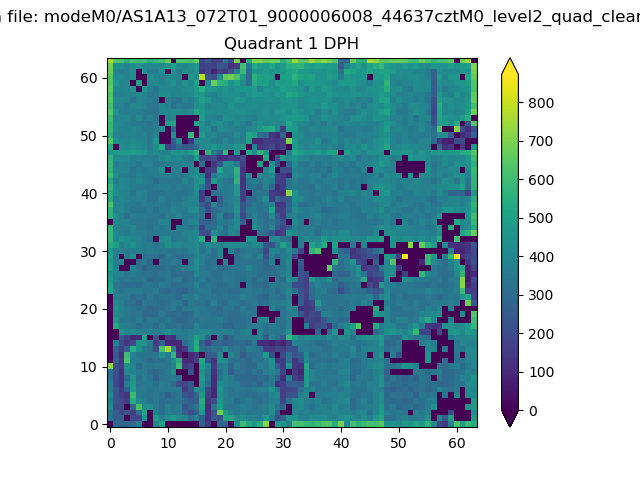 |
Quadrant B |
|---|---|---|---|
| Quadrant D | 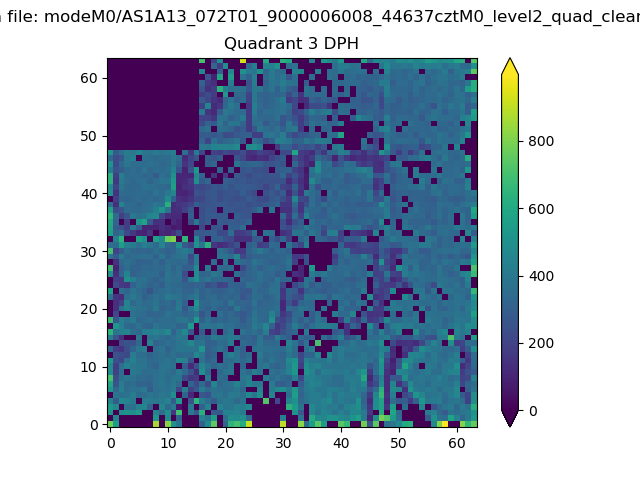 |
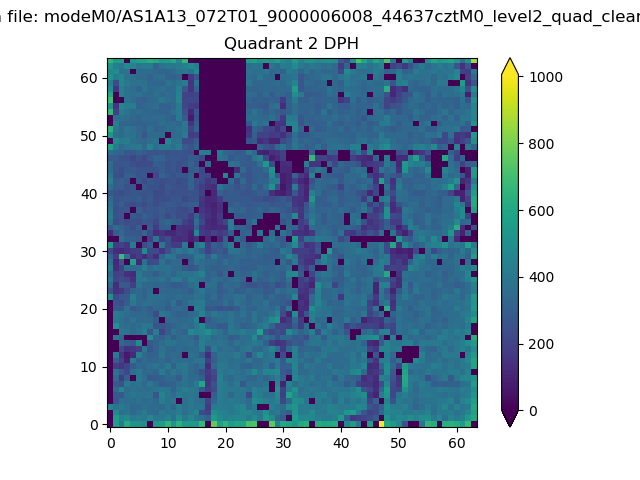 |
Quadrant C |
| Plot type | Count rate plots | Images |
|---|---|---|
| Comparison with Poisson distribution Blue bars denote a histogram of data divided into 1 sec bins. Red curve is a Poisson curve with rate = median count rate of data. |
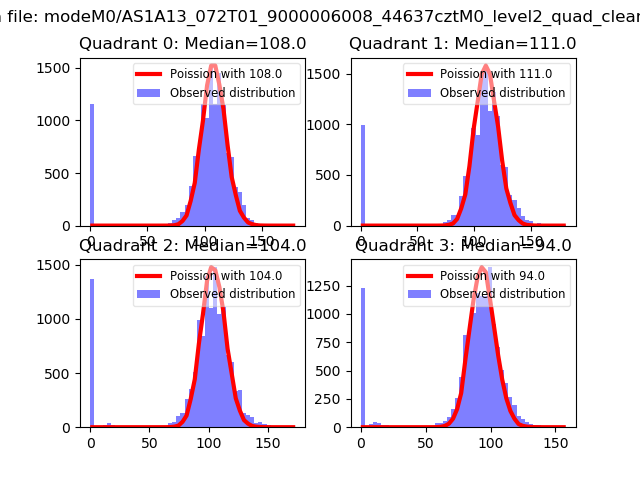 |
 |
| Quadrant-wise count rates Data is divided into 100 sec bins |
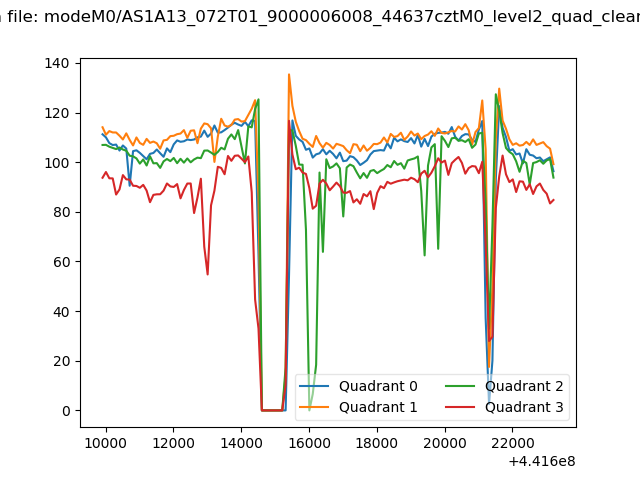 |
|
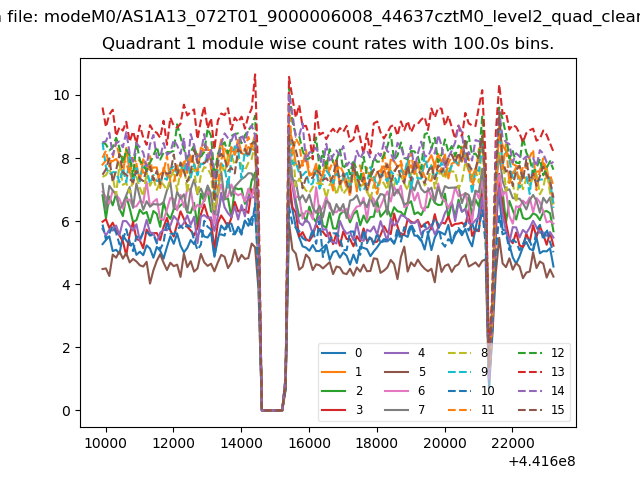
| Module-wise count rates for Quadrant A Data is divided into 100 sec bins |
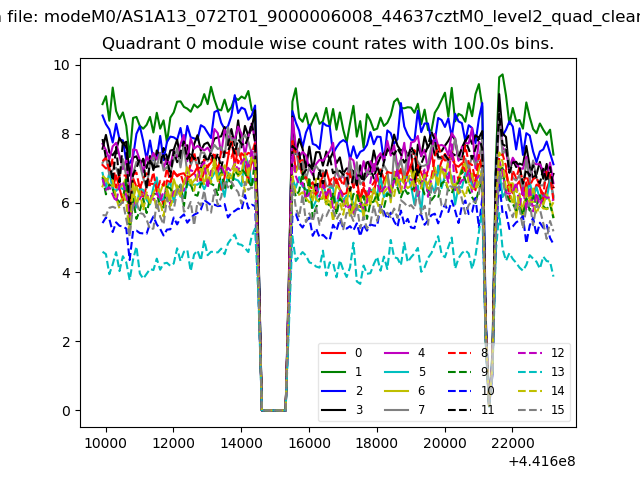 |
 |
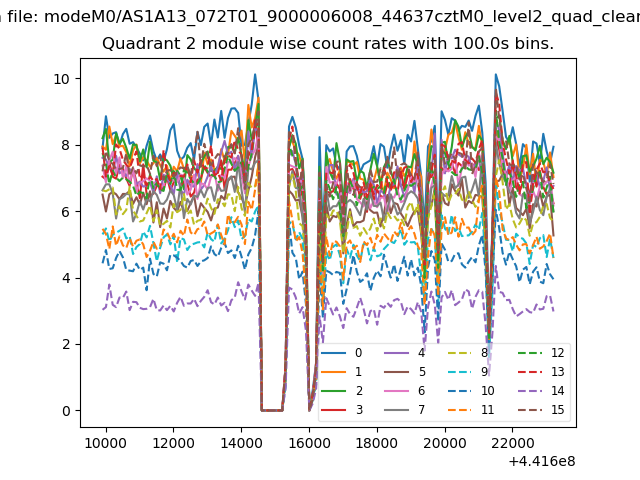
| Module-wise count rates for Quadrant B Data is divided into 100 sec bins |
 |
 |
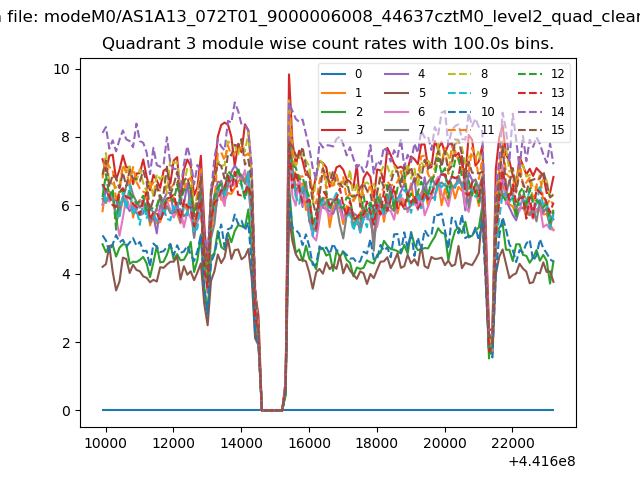
| Module-wise count rates for Quadrant C Data is divided into 100 sec bins |
 |
 |
| Module-wise count rates for Quadrant D Data is divided into 100 sec bins |
 |
 |
| Parameter | Plot |
|---|---|
| CZT HV Monitor | 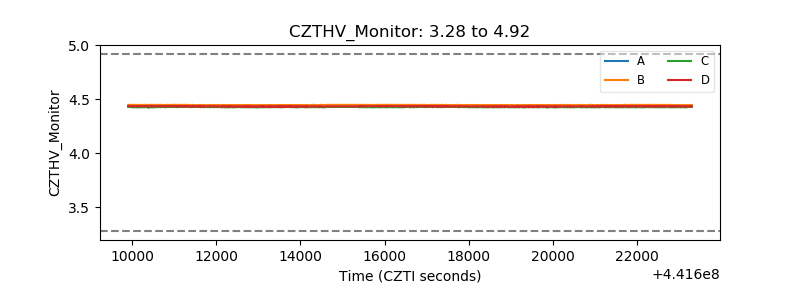 |
| D_VDD | 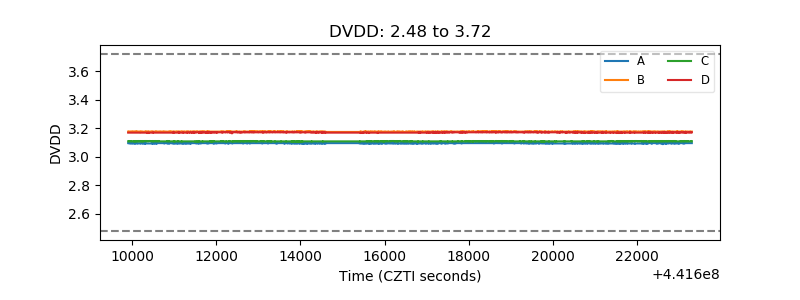 |
| Temperature 1 | 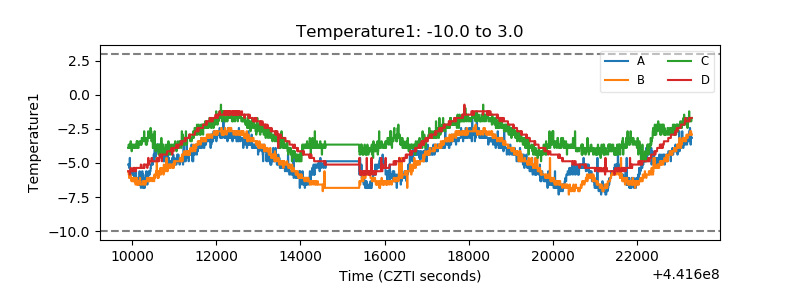 |
| Veto HV Monitor | 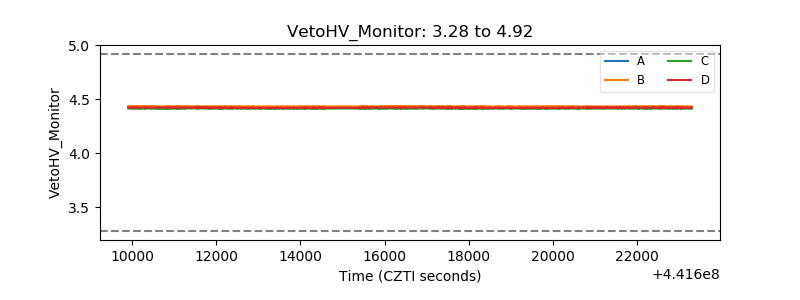 |
| Veto LLD | 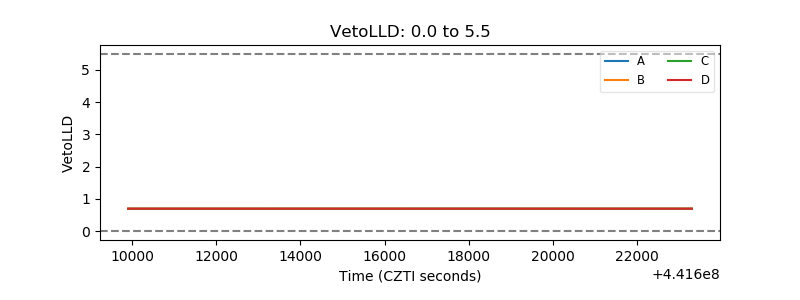 |
| Alpha Counter | 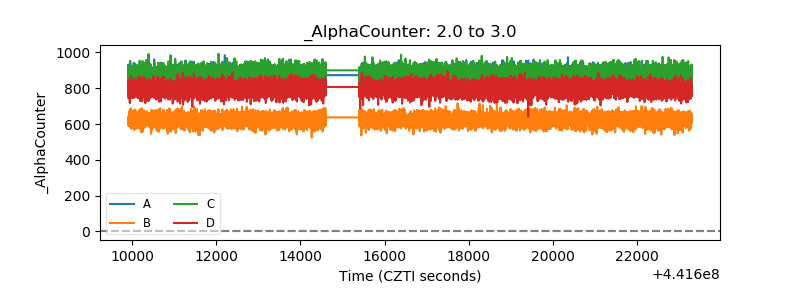 |
| _CPM_Rate | 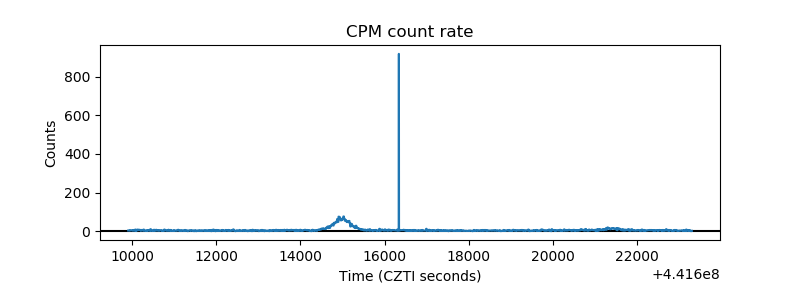 |
| CZT Counter | 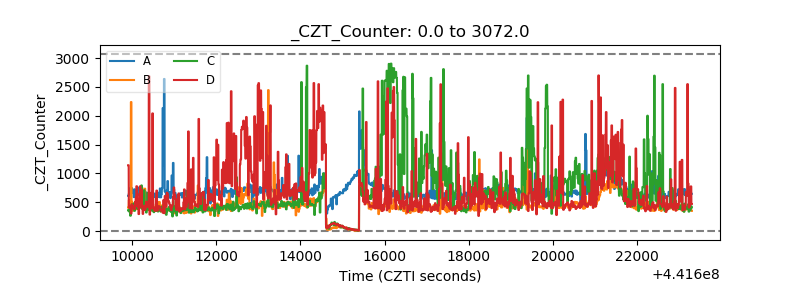 |
| +2.5 Volts monitor | 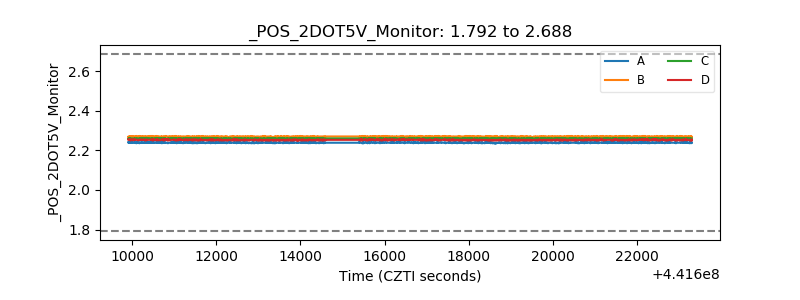 |
| +5 Volts monitor | 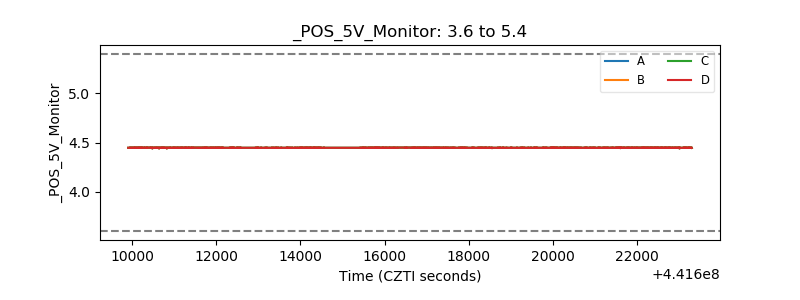 |
| _ROLL_ROT | 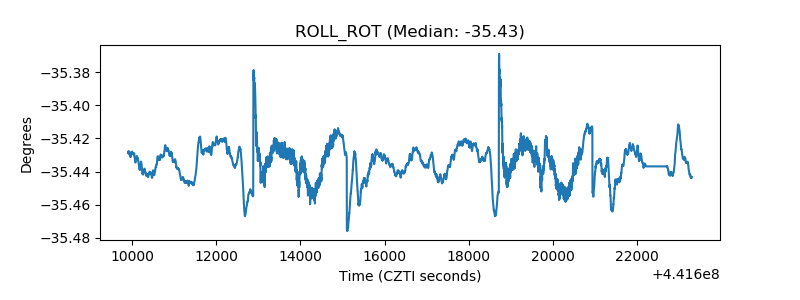 |
| _Roll_DEC | 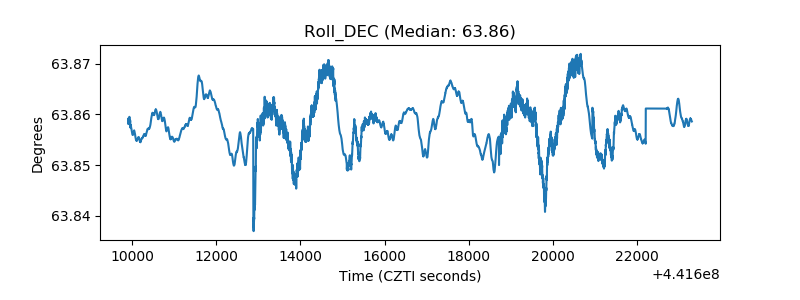 |
| _Roll_RA | 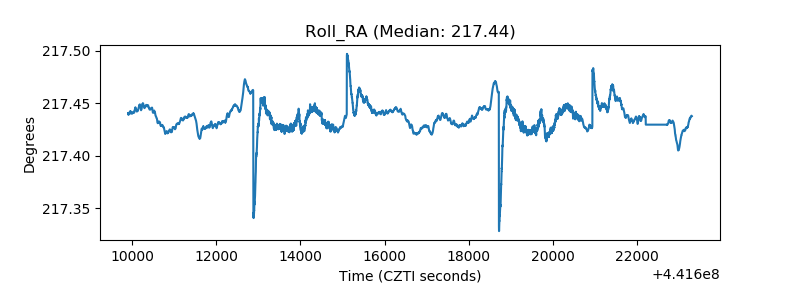 |
| Veto Counter | 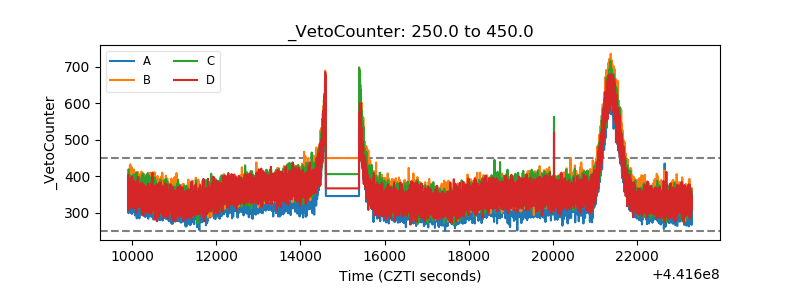 |