| Param | Original file | Final file |
|---|---|---|
| Filename | modeM0/AS1A13_072T01_9000006008_44639cztM0_level2.fits | modeM0/AS1A13_072T01_9000006008_44639cztM0_level2_quad_clean.evt |
| Size (bytes) | 599,587,200 | 109,658,880 |
| Size | 571.8 MB | 104.6 MB |
| Events in quadrant A | 5,211,967 | 738,002 |
| Events in quadrant B | 4,056,967 | 757,952 |
| Events in quadrant C | 5,506,907 | 719,013 |
| Events in quadrant D | 6,873,146 | 613,927 |
| Mode M0 | |||
|---|---|---|---|
| Quadrant | BADHDUFLAG | Total packets | Discarded packets |
| A | 0 | 21732 | 0 |
| B | 0 | 16824 | 0 |
| C | 0 | 21193 | 0 |
| D | 0 | 25317 | 0 |
| Mode SS | |||
|---|---|---|---|
| Quadrant | BADHDUFLAG | Total packets | Discarded packets |
| A | 0 | 142 | 0 |
| B | 0 | 142 | 0 |
| C | 0 | 142 | 0 |
| D | 0 | 142 | 0 |
| Quadrant | Total seconds | Saturated seconds | Saturation percentage |
|---|---|---|---|
| A | 7050 | 196 | 2.780142% |
| B | 7050 | 204 | 2.893617% |
| C | 7050 | 126 | 1.787234% |
| D | 7050 | 704 | 9.985816% |
Noise dominated data is calculated using 1-second bins in cleaned event files. If a bin has >2000 counts, and if more than 50% of those come from <1% of pixels, then it is considered to be noise-dominated and hence unusable.
| Quadrant | # 1 sec bins | Bins with >0 counts | Bins with >2000 counts | High rate bins dominated by noise | Noise dominated (total time) | Noise dominated (detector-on time) | Marked lightcurve |
|---|---|---|---|---|---|---|---|
| A | 7050 | 7050 | 94 | 94 | 1.33% | 1.33% | 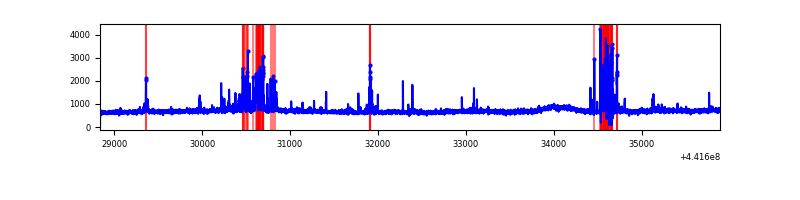 |
| B | 7050 | 7050 | 113 | 113 | 1.60% | 1.60% | 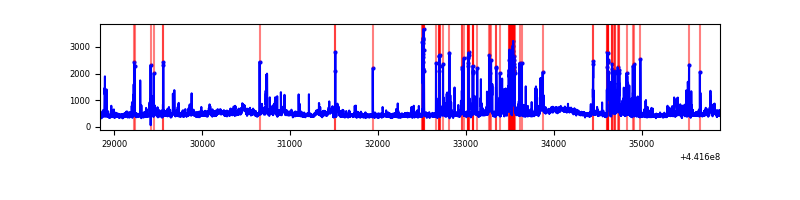 |
| C | 7050 | 7050 | 120 | 120 | 1.70% | 1.70% |  |
| D | 7050 | 7050 | 644 | 644 | 9.13% | 9.13% | 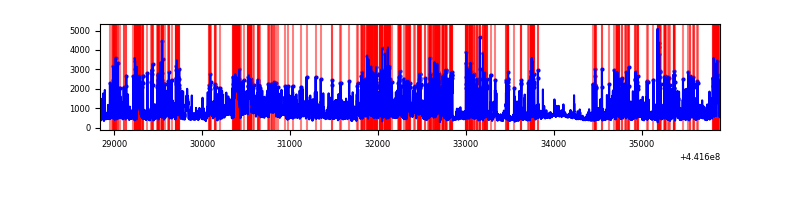 |
Top three noisy pixels from each quadrant. If the there are fewer than three noisy pixels in the level2.evt file, extra rows are filled as -1
| Pixel properties | Quadrant properties | ||||||
|---|---|---|---|---|---|---|---|
| Quadrant | DetID | PixID | Counts | Sigma | Mean | Median | Sigma |
| A | 10 | 83 | 1762694 | 11094.18 | 765 | 747 | 158.8 |
| A | 13 | 248 | 246501 | 1547.4 | 765 | 747 | 158.8 |
| A | 15 | 223 | 208150 | 1305.92 | 765 | 747 | 158.8 |
| B | 4 | 171 | 690794 | 4567.54 | 763 | 739 | 151.1 |
| B | 5 | 172 | 128630 | 846.52 | 763 | 739 | 151.1 |
| B | 0 | 155 | 56878 | 371.59 | 763 | 739 | 151.1 |
| C | 12 | 2 | 2136235 | 12235.88 | 744 | 747 | 174.5 |
| C | 12 | 250 | 189075 | 1079.08 | 744 | 747 | 174.5 |
| C | 3 | 233 | 151541 | 864.02 | 744 | 747 | 174.5 |
| D | 13 | 249 | 1428754 | 7852.42 | 721 | 697 | 181.9 |
| D | 1 | 52 | 944292 | 5188.52 | 721 | 697 | 181.9 |
| D | 13 | 174 | 729080 | 4005.14 | 721 | 697 | 181.9 |
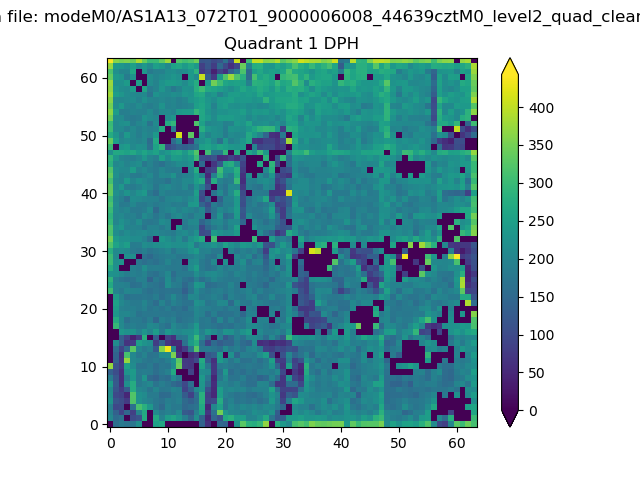
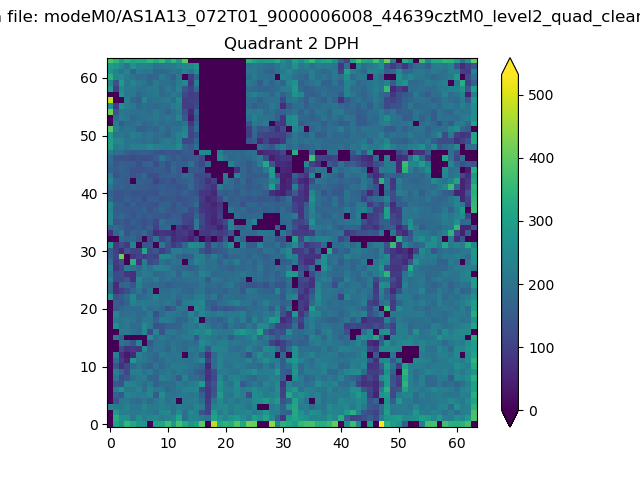
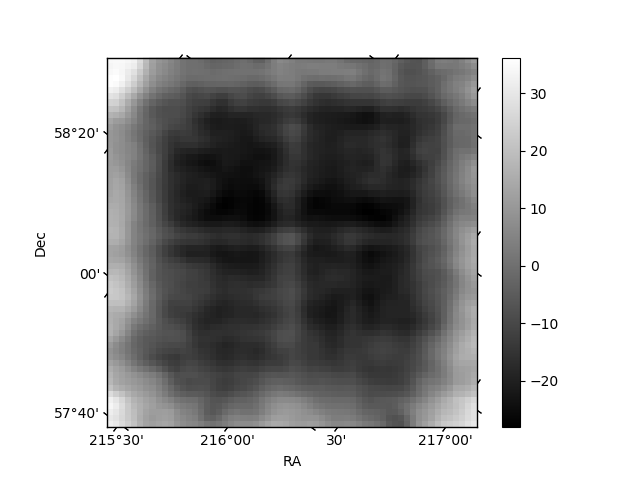
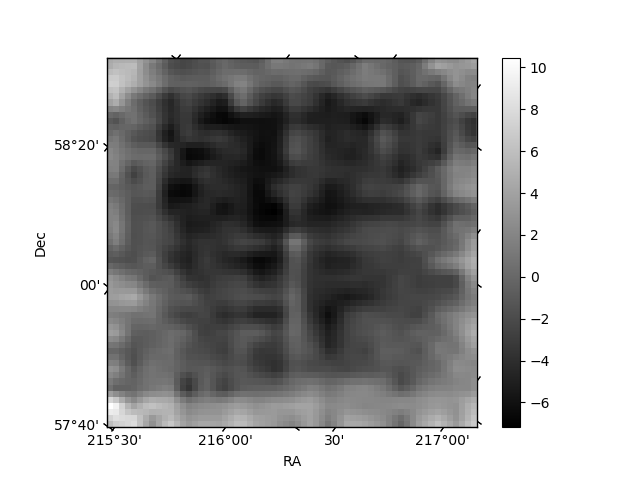
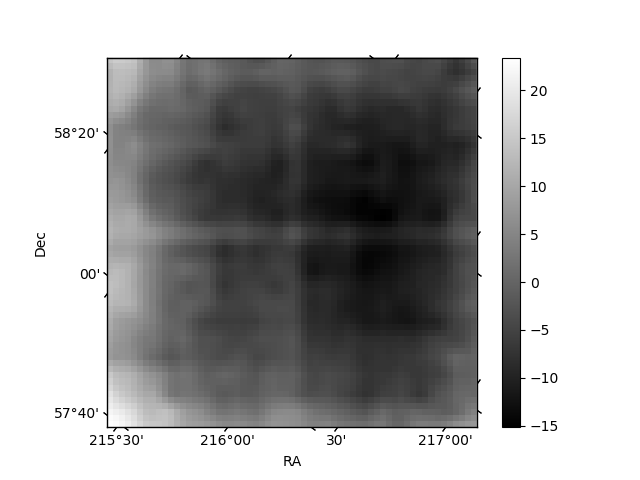
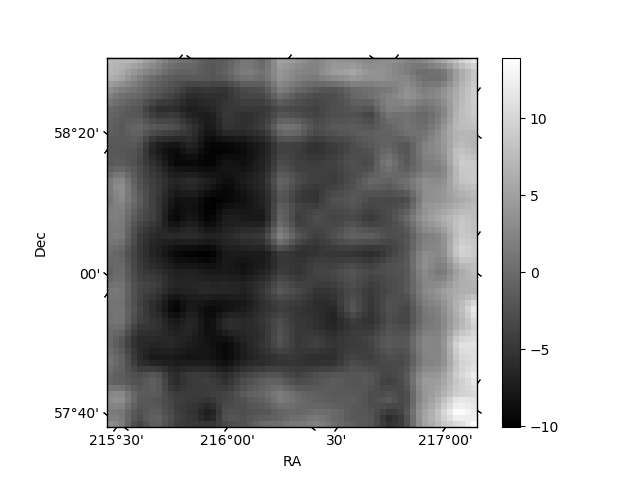
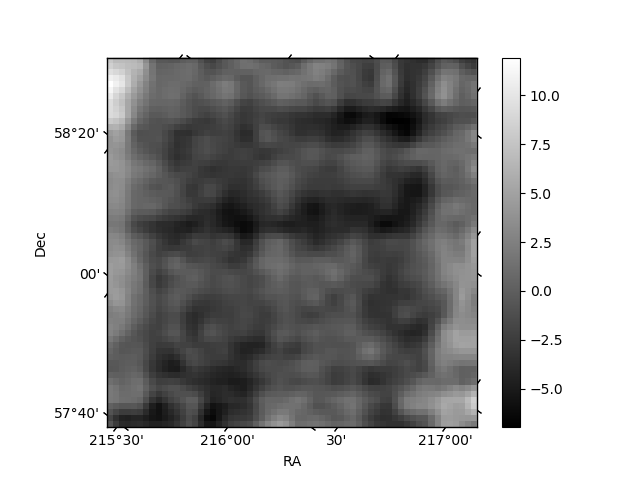
Histogram calculated using DETX and DETY for each event in the final _common_clean file
| Quadrant A | 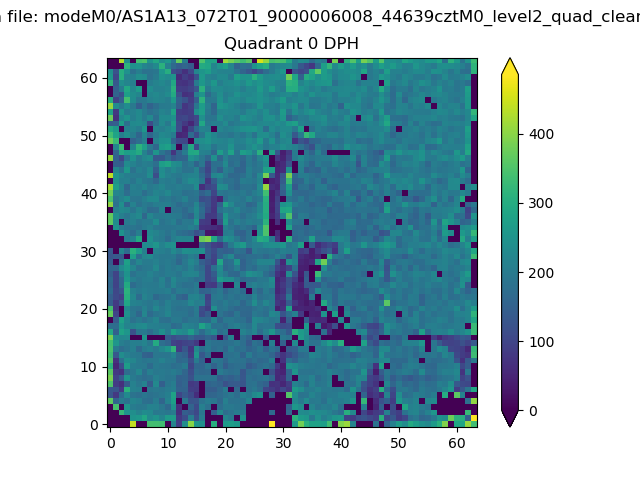 |
 |
Quadrant B |
|---|---|---|---|
| Quadrant D | 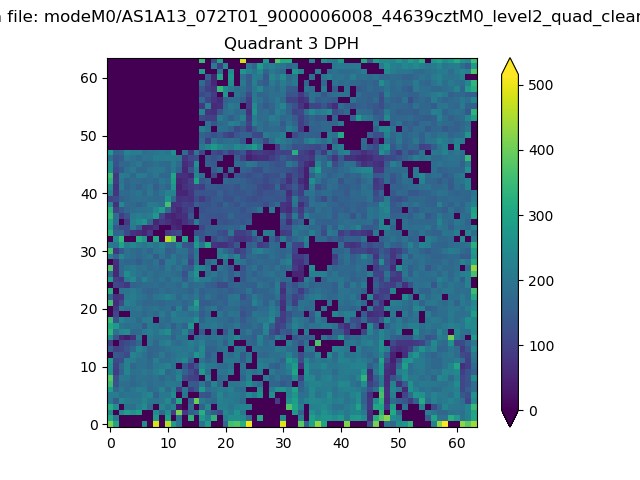 |
 |
Quadrant C |
| Plot type | Count rate plots | Images |
|---|---|---|
| Comparison with Poisson distribution Blue bars denote a histogram of data divided into 1 sec bins. Red curve is a Poisson curve with rate = median count rate of data. |
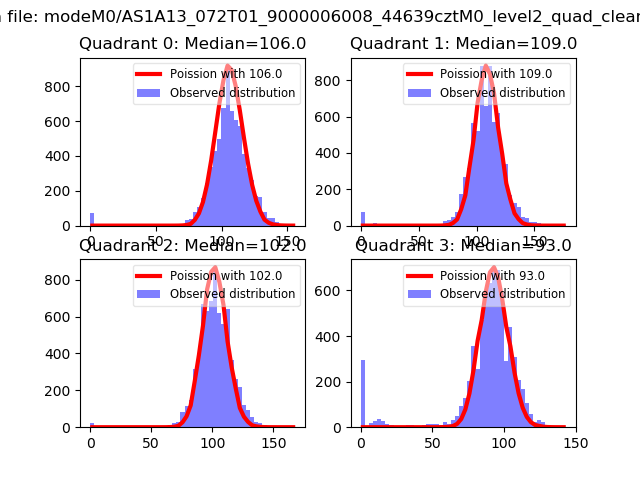 |
 |
| Quadrant-wise count rates Data is divided into 100 sec bins |
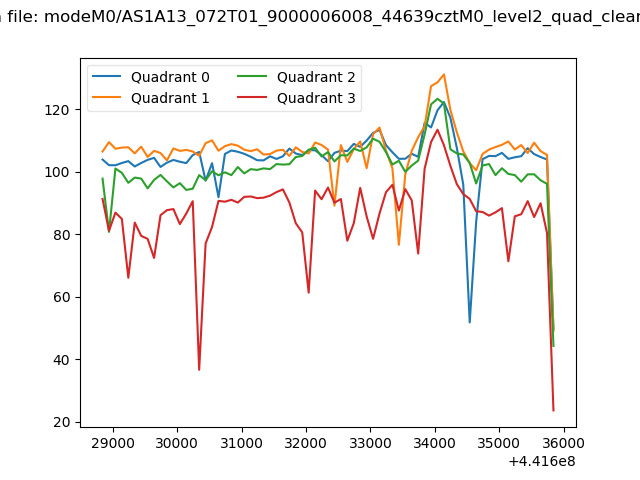 |
|
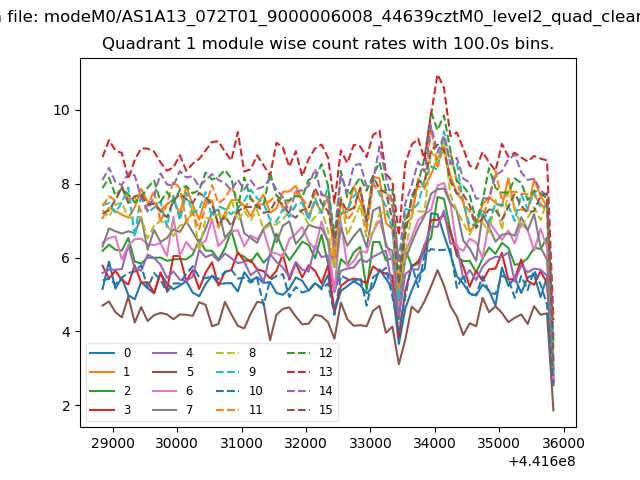
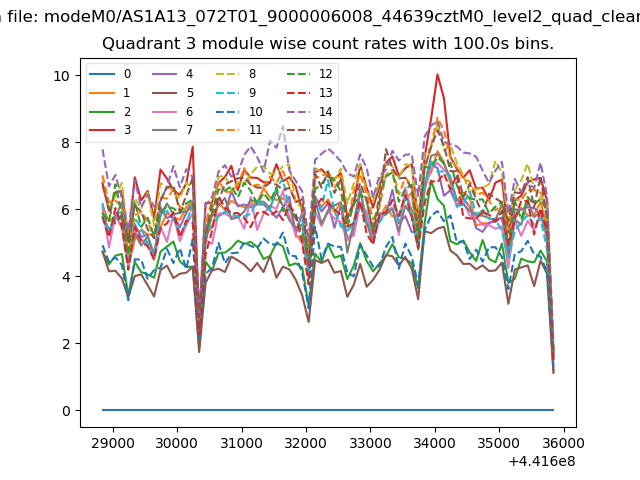
| Module-wise count rates for Quadrant A Data is divided into 100 sec bins |
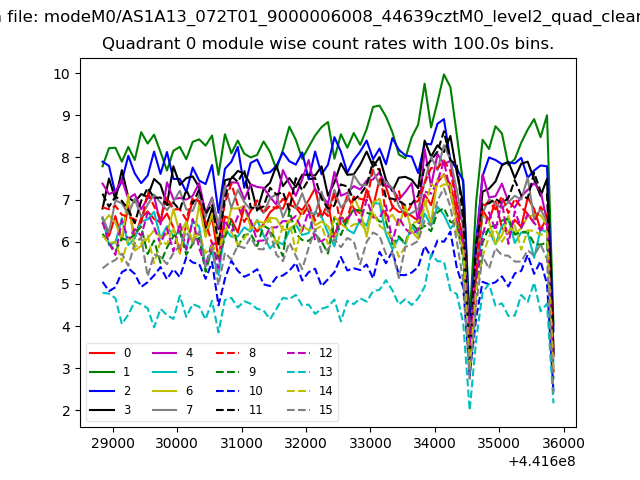 |
 |
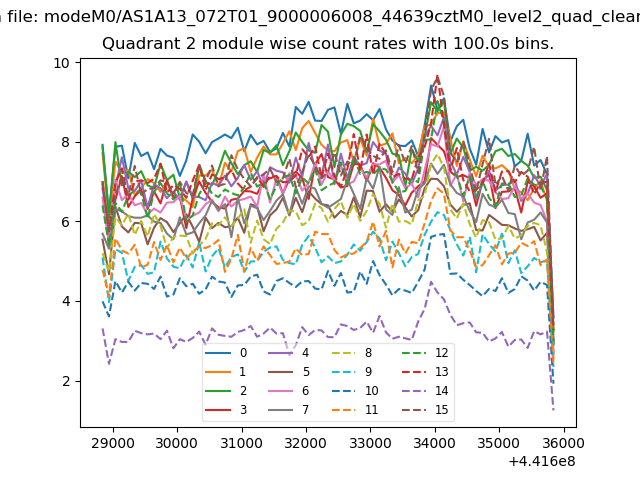
| Module-wise count rates for Quadrant B Data is divided into 100 sec bins |
 |
 |
| Module-wise count rates for Quadrant C Data is divided into 100 sec bins |
 |
 |
| Module-wise count rates for Quadrant D Data is divided into 100 sec bins |
 |
 |
| Parameter | Plot |
|---|---|
| CZT HV Monitor | 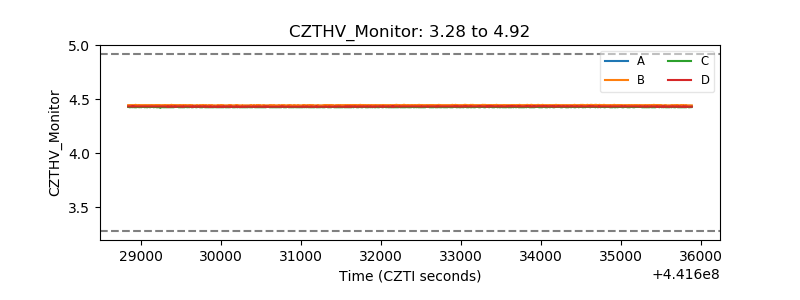 |
| D_VDD | 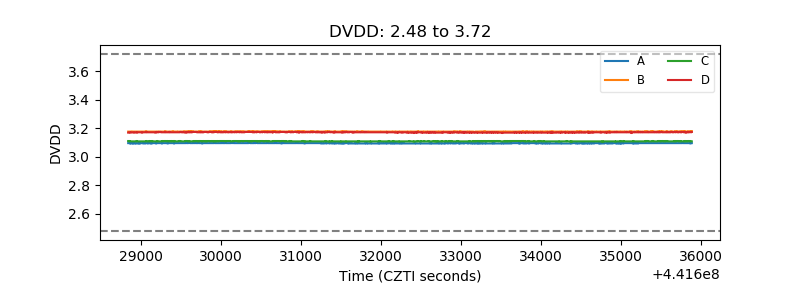 |
| Temperature 1 | 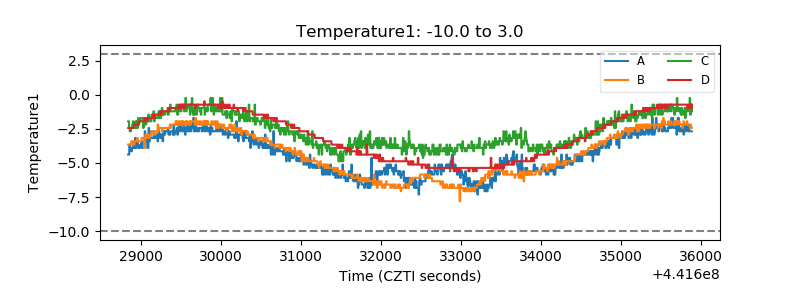 |
| Veto HV Monitor | 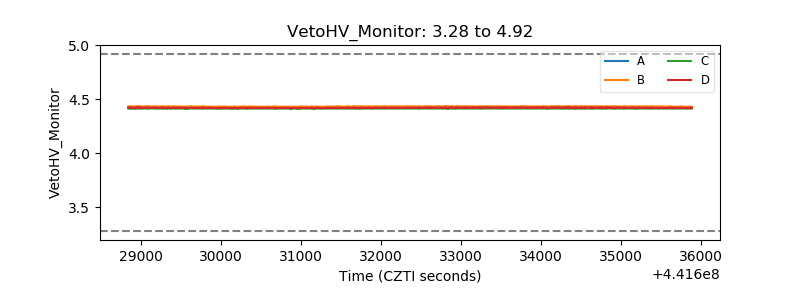 |
| Veto LLD | 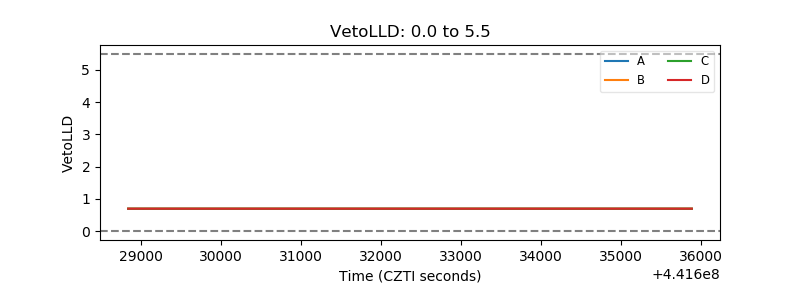 |
| Alpha Counter | 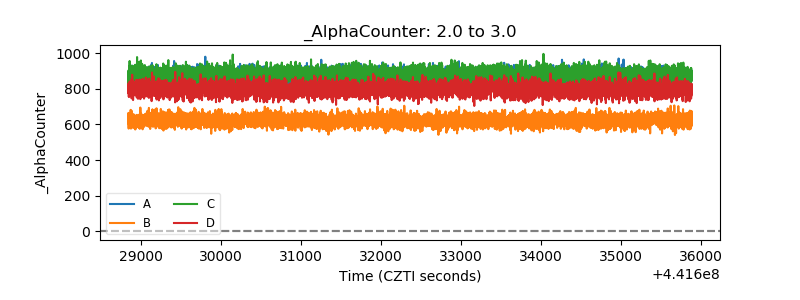 |
| _CPM_Rate | 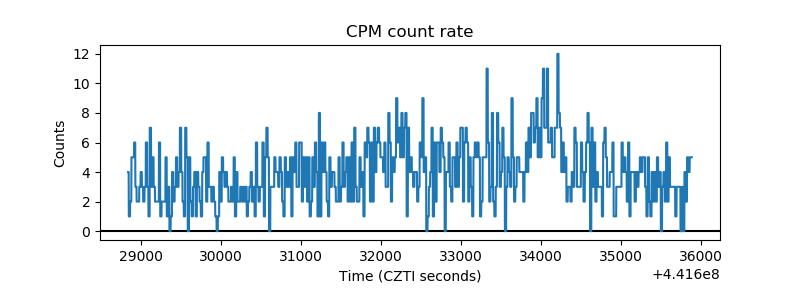 |
| CZT Counter | 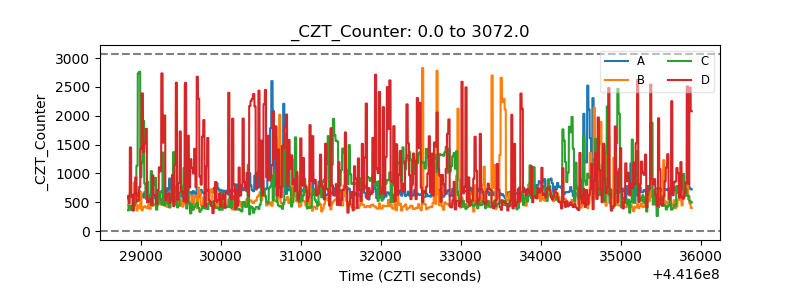 |
| +2.5 Volts monitor | 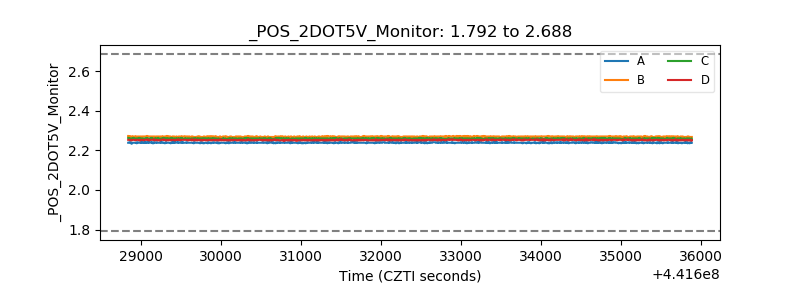 |
| +5 Volts monitor | 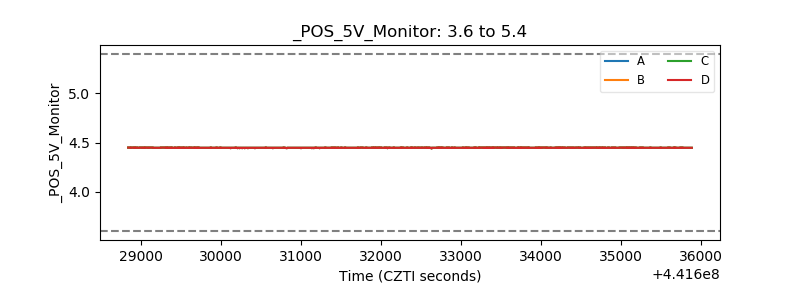 |
| _ROLL_ROT | 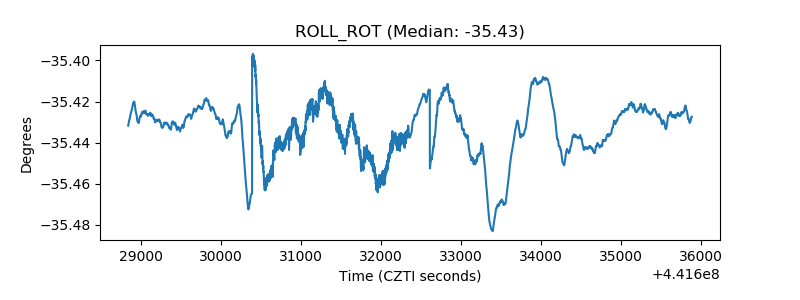 |
| _Roll_DEC | 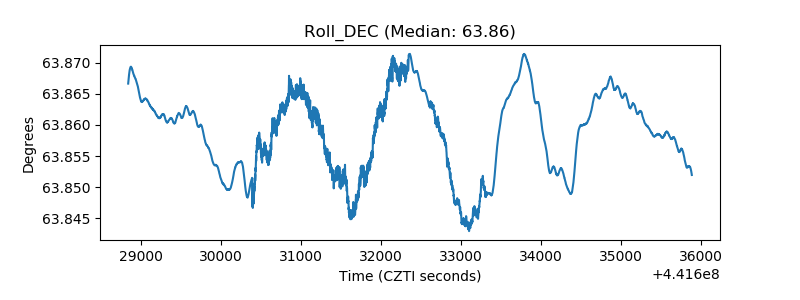 |
| _Roll_RA | 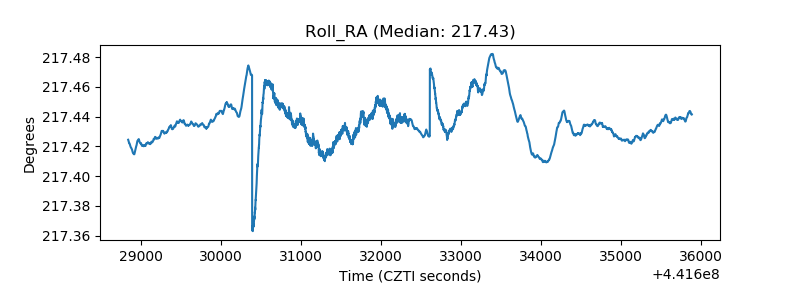 |
| Veto Counter | 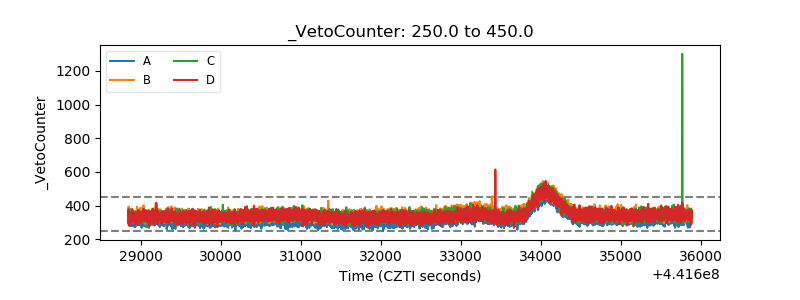 |