| Param | Original file | Final file |
|---|---|---|
| Filename | modeM0/AS1A13_072T01_9000006008_44642cztM0_level2.fits | modeM0/AS1A13_072T01_9000006008_44642cztM0_level2_quad_clean.evt |
| Size (bytes) | 1,340,904,960 | 278,976,960 |
| Size | 1.2 GB | 266.1 MB |
| Events in quadrant A | 14,361,696 | 1,874,978 |
| Events in quadrant B | 9,219,548 | 1,939,208 |
| Events in quadrant C | 11,012,451 | 1,776,583 |
| Events in quadrant D | 13,634,855 | 1,599,710 |
| Mode M0 | |||
|---|---|---|---|
| Quadrant | BADHDUFLAG | Total packets | Discarded packets |
| A | 0 | 57712 | 3 |
| B | 0 | 40172 | 3 |
| C | 0 | 45678 | 3 |
| D | 0 | 53046 | 3 |
| Mode SS | |||
|---|---|---|---|
| Quadrant | BADHDUFLAG | Total packets | Discarded packets |
| A | 0 | 372 | 0 |
| B | 0 | 372 | 0 |
| C | 0 | 372 | 0 |
| D | 0 | 372 | 0 |
| Mode M9 | |||
|---|---|---|---|
| Quadrant | BADHDUFLAG | Total packets | Discarded packets |
| A | 0 | 15 | 0 |
| B | 0 | 15 | 0 |
| C | 0 | 15 | 0 |
| D | 0 | 15 | 0 |
| Quadrant | Total seconds | Saturated seconds | Saturation percentage |
|---|---|---|---|
| A | 18212 | 646 | 3.547112% |
| B | 18212 | 355 | 1.949264% |
| C | 18212 | 732 | 4.019328% |
| D | 18212 | 1266 | 6.951461% |
Noise dominated data is calculated using 1-second bins in cleaned event files. If a bin has >2000 counts, and if more than 50% of those come from <1% of pixels, then it is considered to be noise-dominated and hence unusable.
| Quadrant | # 1 sec bins | Bins with >0 counts | Bins with >2000 counts | High rate bins dominated by noise | Noise dominated (total time) | Noise dominated (detector-on time) | Marked lightcurve |
|---|---|---|---|---|---|---|---|
| A | 19732 | 18215 | 251 | 251 | 1.27% | 1.38% | 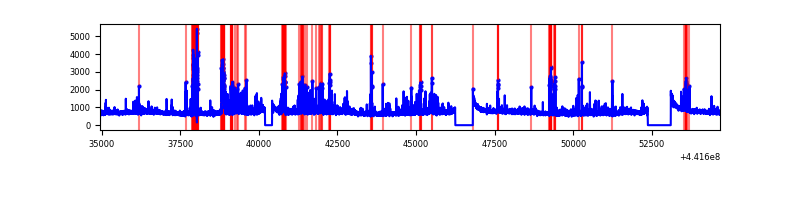 |
| B | 19732 | 18215 | 101 | 101 | 0.51% | 0.55% | 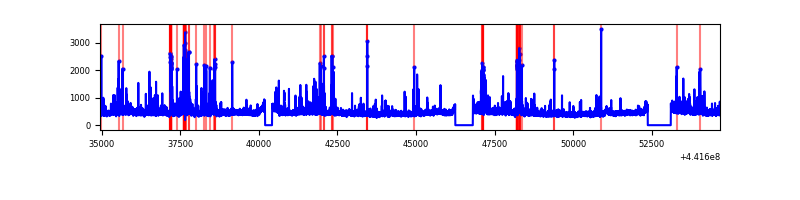 |
| C | 19732 | 18215 | 554 | 554 | 2.81% | 3.04% | 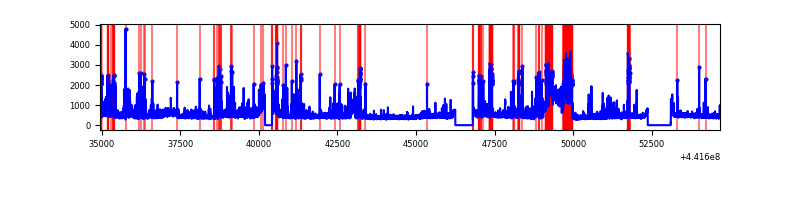 |
| D | 19732 | 18215 | 905 | 905 | 4.59% | 4.97% | 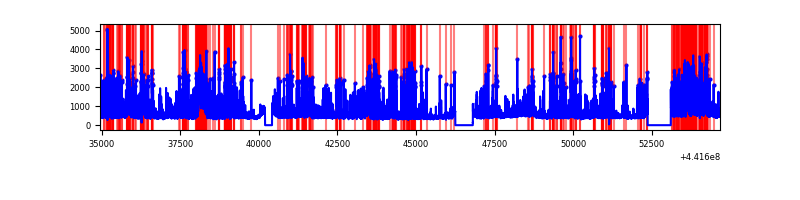 |
Top three noisy pixels from each quadrant. If the there are fewer than three noisy pixels in the level2.evt file, extra rows are filled as -1
| Pixel properties | Quadrant properties | ||||||
|---|---|---|---|---|---|---|---|
| Quadrant | DetID | PixID | Counts | Sigma | Mean | Median | Sigma |
| A | 10 | 83 | 4972631 | 12236.2 | 1976 | 1936 | 406.2 |
| A | 15 | 223 | 962556 | 2364.73 | 1976 | 1936 | 406.2 |
| A | 13 | 248 | 423141 | 1036.87 | 1976 | 1936 | 406.2 |
| B | 4 | 171 | 452376 | 1165.43 | 1978 | 1916 | 386.5 |
| B | 0 | 183 | 221407 | 567.87 | 1978 | 1916 | 386.5 |
| B | 0 | 189 | 200585 | 513.99 | 1978 | 1916 | 386.5 |
| C | 12 | 2 | 2788847 | 6204.73 | 1921 | 1934 | 449.2 |
| C | 14 | 254 | 215275 | 474.98 | 1921 | 1934 | 449.2 |
| C | 3 | 233 | 188756 | 415.94 | 1921 | 1934 | 449.2 |
| D | 13 | 249 | 2178239 | 4558.34 | 1901 | 1842 | 477.5 |
| D | 1 | 52 | 2019435 | 4225.73 | 1901 | 1842 | 477.5 |
| D | 4 | 232 | 505630 | 1055.15 | 1901 | 1842 | 477.5 |
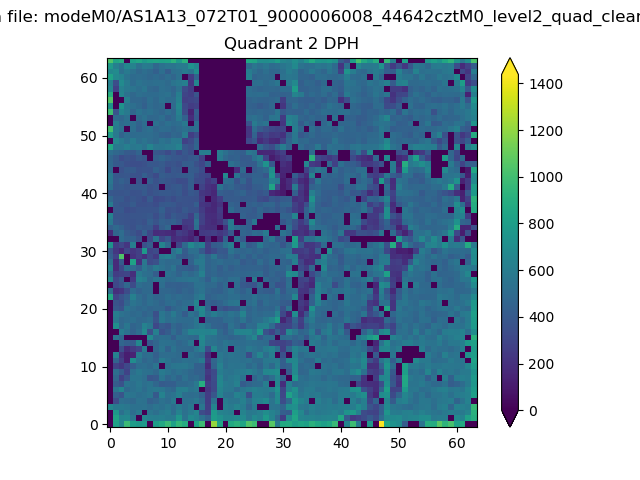
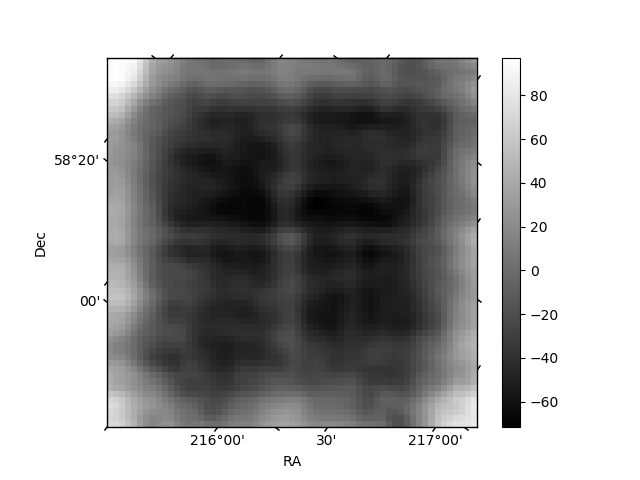
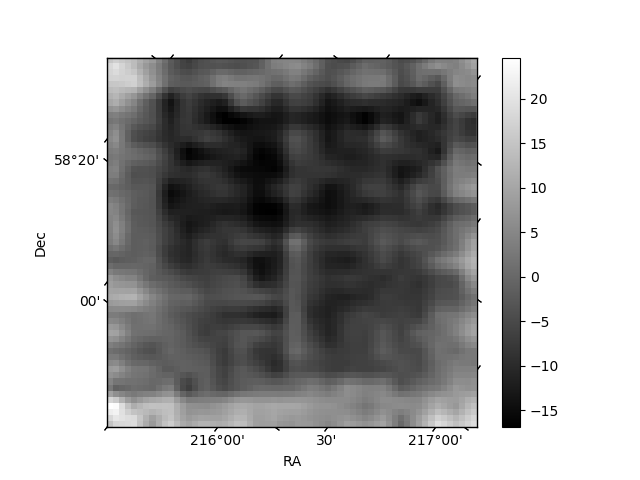
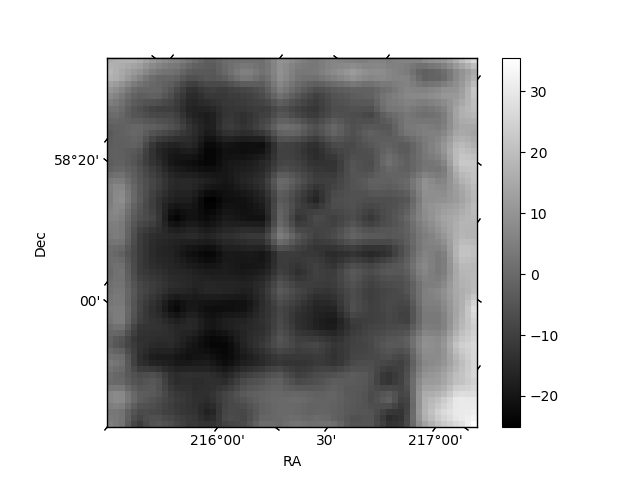
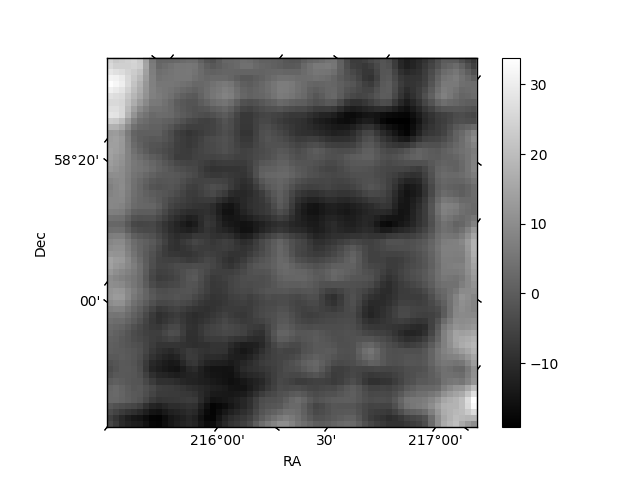
Histogram calculated using DETX and DETY for each event in the final _common_clean file
| Quadrant A | 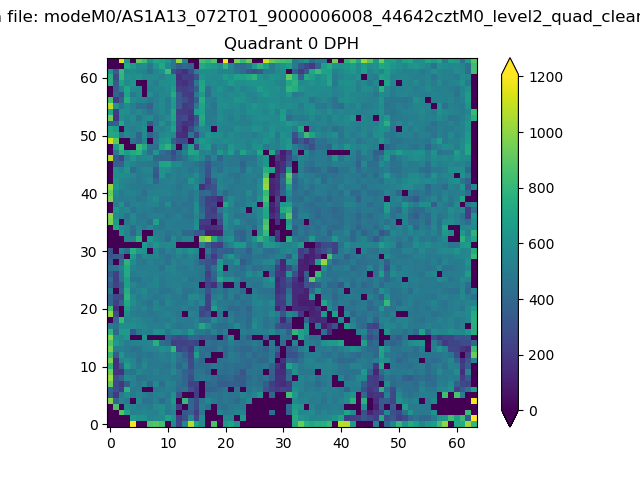 |
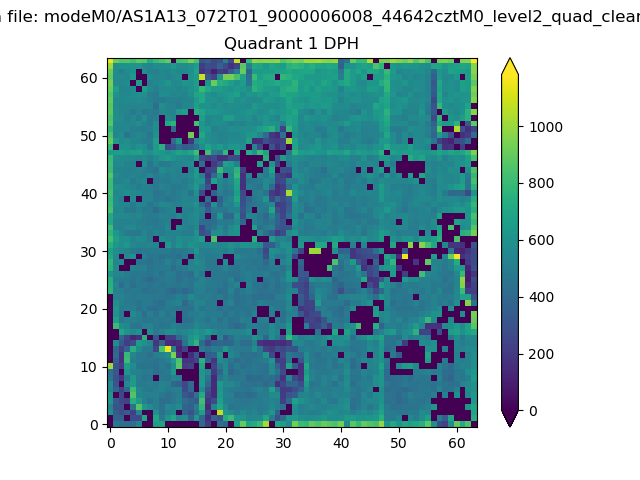 |
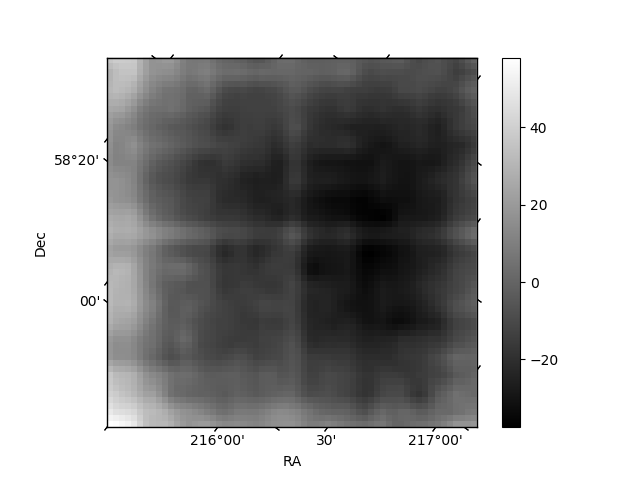
Quadrant B |
|---|---|---|---|
| Quadrant D | 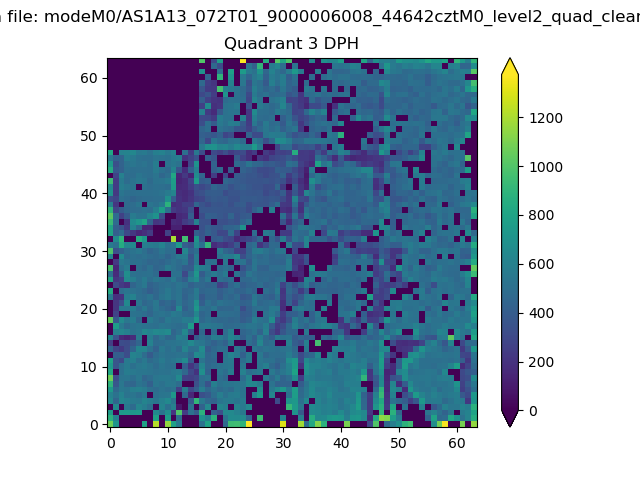 |
 |
Quadrant C |
| Plot type | Count rate plots | Images |
|---|---|---|
| Comparison with Poisson distribution Blue bars denote a histogram of data divided into 1 sec bins. Red curve is a Poisson curve with rate = median count rate of data. |
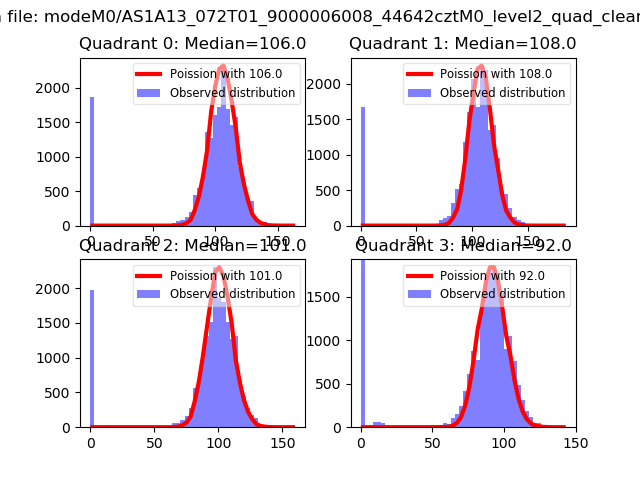 |
 |
| Quadrant-wise count rates Data is divided into 100 sec bins |
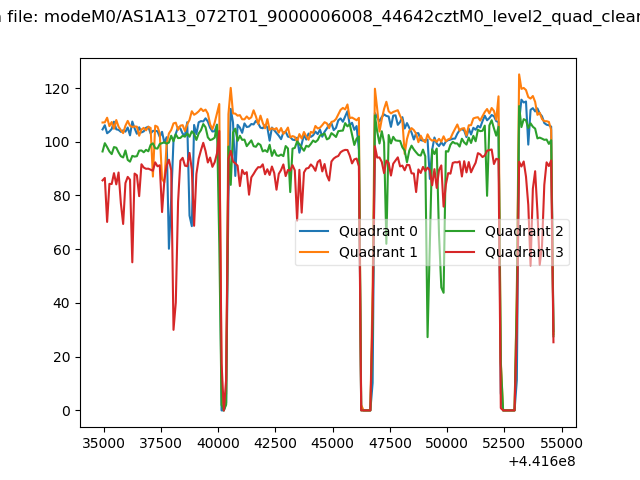 |
|
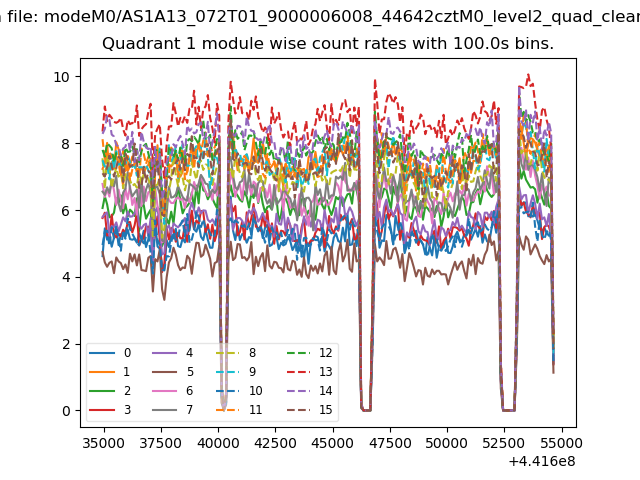
| Module-wise count rates for Quadrant A Data is divided into 100 sec bins |
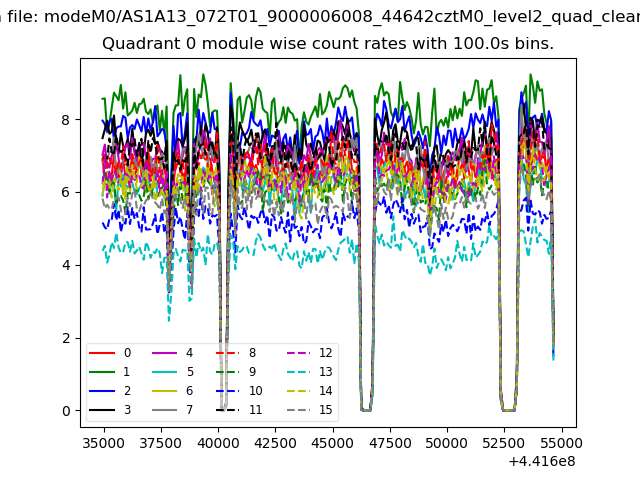 |
 |
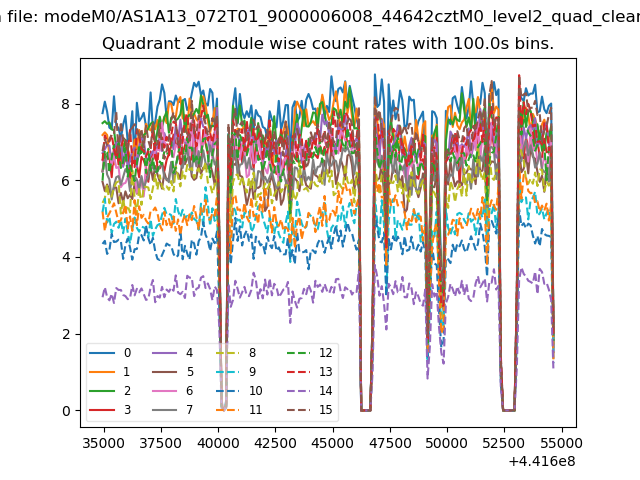
| Module-wise count rates for Quadrant B Data is divided into 100 sec bins |
 |
 |
| Module-wise count rates for Quadrant C Data is divided into 100 sec bins |
 |
 |
| Module-wise count rates for Quadrant D Data is divided into 100 sec bins |
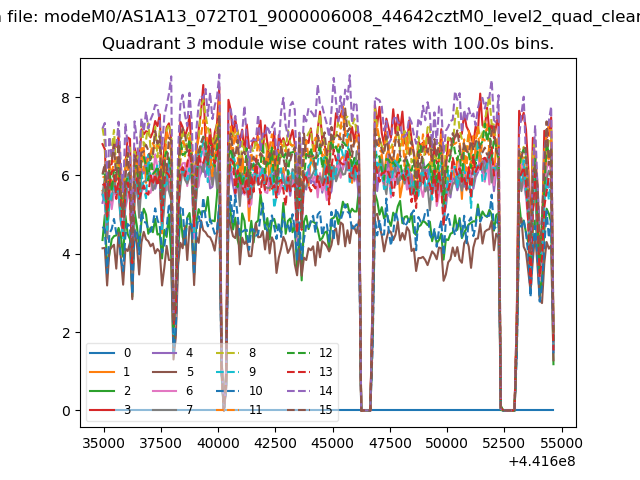 |
 |
| Parameter | Plot |
|---|---|
| CZT HV Monitor | 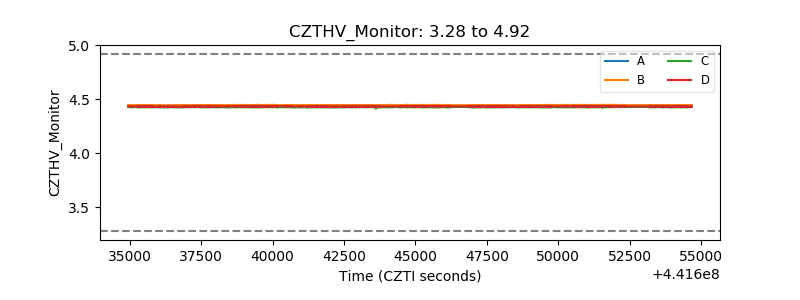 |
| D_VDD | 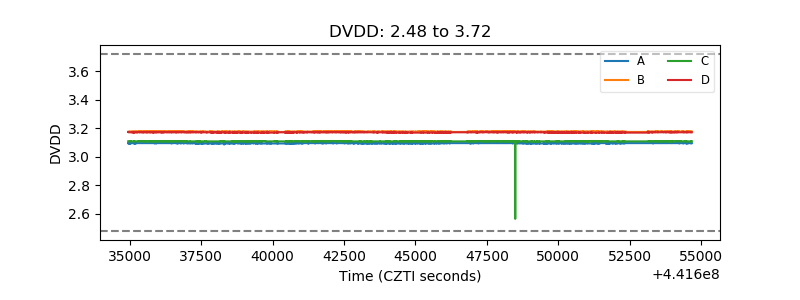 |
| Temperature 1 | 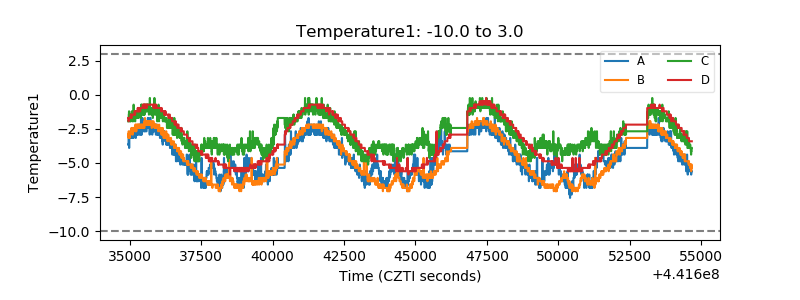 |
| Veto HV Monitor |  |
| Veto LLD | 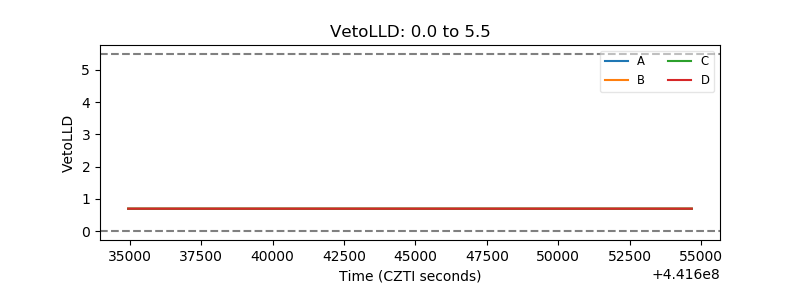 |
| Alpha Counter |  |
| _CPM_Rate | 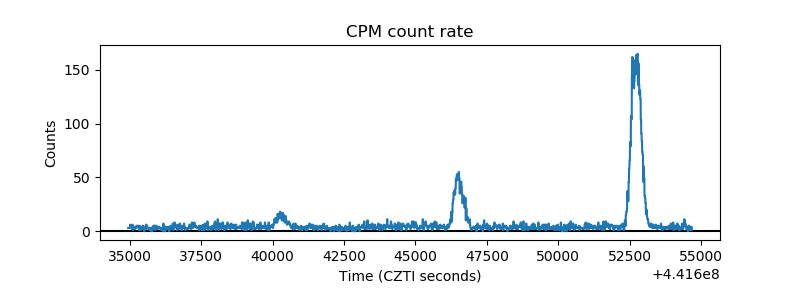 |
| CZT Counter | 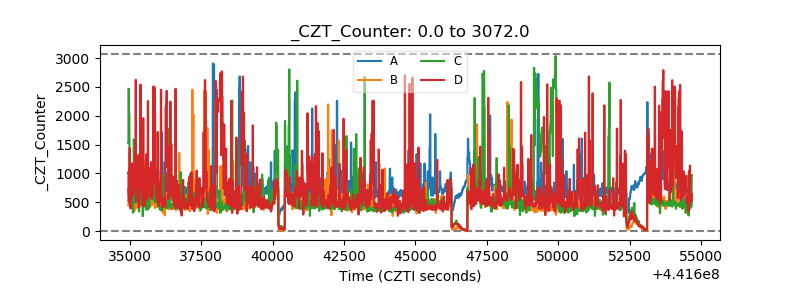 |
| +2.5 Volts monitor | 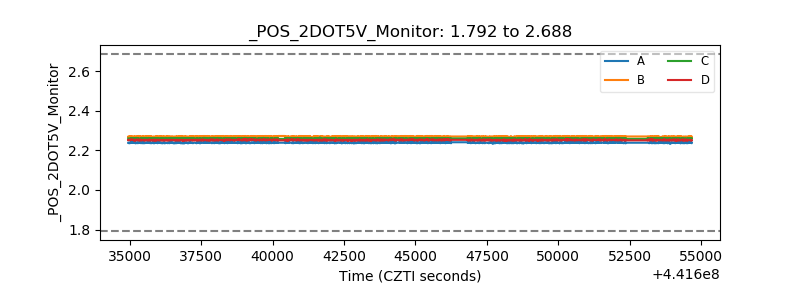 |
| +5 Volts monitor | 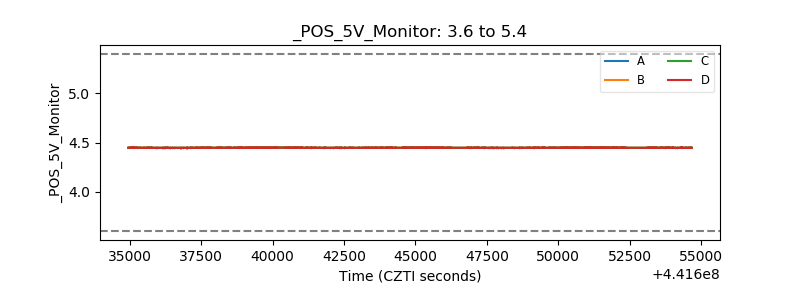 |
| _ROLL_ROT | 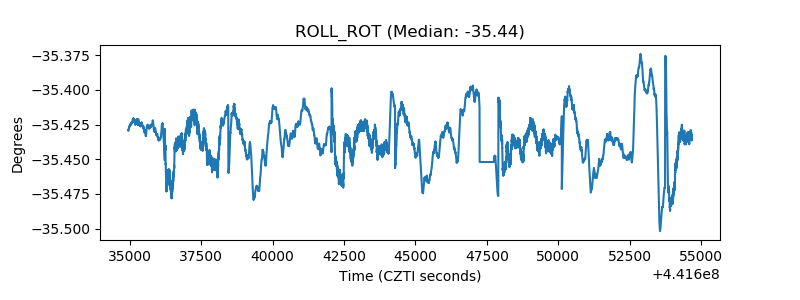 |
| _Roll_DEC | 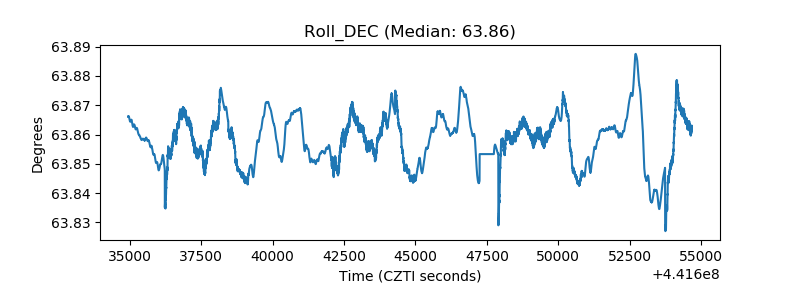 |
| _Roll_RA | 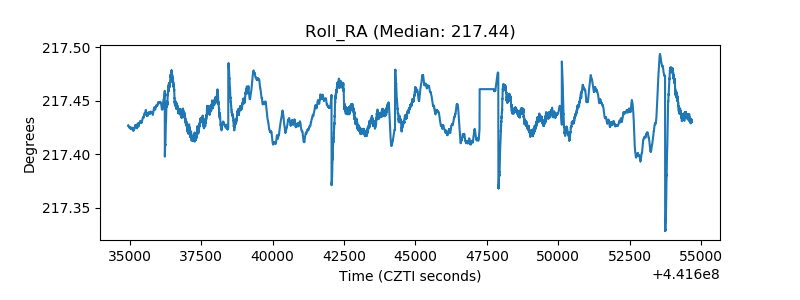 |
| Veto Counter | 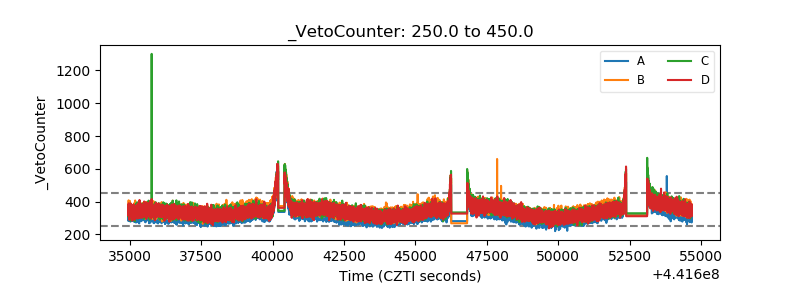 |