| Param | Original file | Final file |
|---|---|---|
| Filename | modeM0/AS1A13_072T01_9000006008_44645cztM0_level2.fits | modeM0/AS1A13_072T01_9000006008_44645cztM0_level2_quad_clean.evt |
| Size (bytes) | 494,406,720 | 106,804,800 |
| Size | 471.5 MB | 101.9 MB |
| Events in quadrant A | 5,188,255 | 711,844 |
| Events in quadrant B | 3,358,491 | 742,345 |
| Events in quadrant C | 3,451,909 | 706,314 |
| Events in quadrant D | 5,788,637 | 611,706 |
| Mode M0 | |||
|---|---|---|---|
| Quadrant | BADHDUFLAG | Total packets | Discarded packets |
| A | 0 | 20862 | 2 |
| B | 0 | 14779 | 2 |
| C | 0 | 14967 | 2 |
| D | 0 | 21850 | 3 |
| Mode SS | |||
|---|---|---|---|
| Quadrant | BADHDUFLAG | Total packets | Discarded packets |
| A | 0 | 134 | 0 |
| B | 0 | 134 | 0 |
| C | 0 | 134 | 0 |
| D | 0 | 134 | 0 |
| Mode M9 | |||
|---|---|---|---|
| Quadrant | BADHDUFLAG | Total packets | Discarded packets |
| A | 0 | 13 | 0 |
| B | 0 | 14 | 0 |
| C | 0 | 14 | 0 |
| D | 0 | 14 | 0 |
| Quadrant | Total seconds | Saturated seconds | Saturation percentage |
|---|---|---|---|
| A | 6622 | 237 | 3.578979% |
| B | 6622 | 120 | 1.812141% |
| C | 6622 | 122 | 1.842344% |
| D | 6621 | 610 | 9.213110% |
Noise dominated data is calculated using 1-second bins in cleaned event files. If a bin has >2000 counts, and if more than 50% of those come from <1% of pixels, then it is considered to be noise-dominated and hence unusable.
| Quadrant | # 1 sec bins | Bins with >0 counts | Bins with >2000 counts | High rate bins dominated by noise | Noise dominated (total time) | Noise dominated (detector-on time) | Marked lightcurve |
|---|---|---|---|---|---|---|---|
| A | 7682 | 6623 | 81 | 81 | 1.05% | 1.22% | 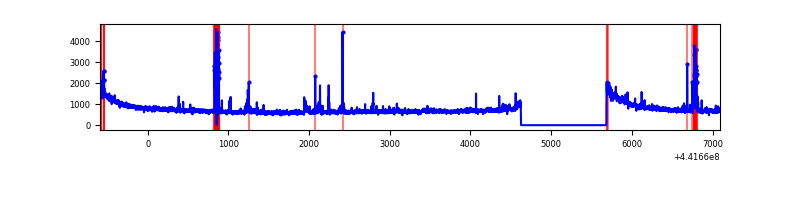 |
| B | 7682 | 6623 | 49 | 49 | 0.64% | 0.74% | 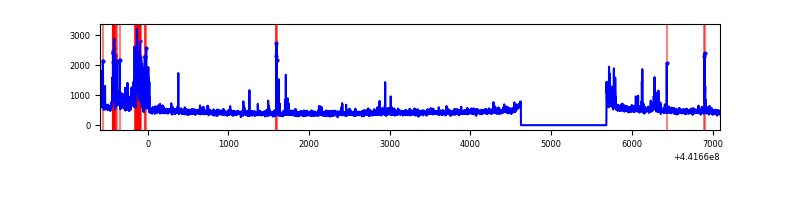 |
| C | 7682 | 6623 | 82 | 82 | 1.07% | 1.24% | 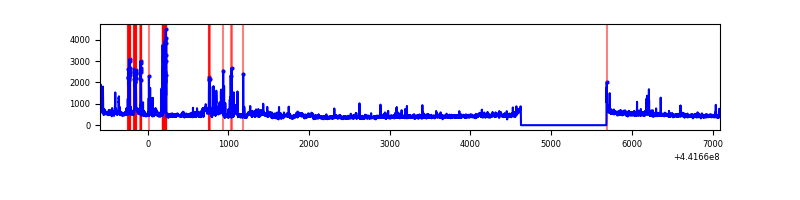 |
| D | 7681 | 6622 | 490 | 490 | 6.38% | 7.40% | 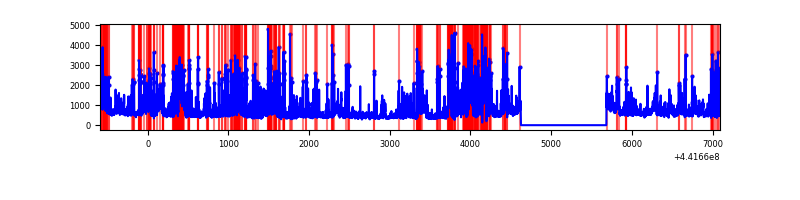 |
Top three noisy pixels from each quadrant. If the there are fewer than three noisy pixels in the level2.evt file, extra rows are filled as -1
| Pixel properties | Quadrant properties | ||||||
|---|---|---|---|---|---|---|---|
| Quadrant | DetID | PixID | Counts | Sigma | Mean | Median | Sigma |
| A | 10 | 83 | 1967644 | 13066.95 | 726 | 711 | 150.5 |
| A | 15 | 223 | 197870 | 1309.79 | 726 | 711 | 150.5 |
| A | 13 | 248 | 159293 | 1053.51 | 726 | 711 | 150.5 |
| B | 0 | 189 | 237824 | 1650.42 | 733 | 711 | 143.7 |
| B | 0 | 186 | 113771 | 786.95 | 733 | 711 | 143.7 |
| B | 0 | 183 | 31725 | 215.87 | 733 | 711 | 143.7 |
| C | 12 | 2 | 409898 | 2425.56 | 720 | 724 | 168.7 |
| C | 12 | 16 | 110692 | 651.89 | 720 | 724 | 168.7 |
| C | 3 | 233 | 53026 | 310.04 | 720 | 724 | 168.7 |
| D | 1 | 52 | 1534629 | 8877.04 | 694 | 673 | 172.8 |
| D | 13 | 249 | 687507 | 3974.72 | 694 | 673 | 172.8 |
| D | 2 | 249 | 266787 | 1540.01 | 694 | 673 | 172.8 |
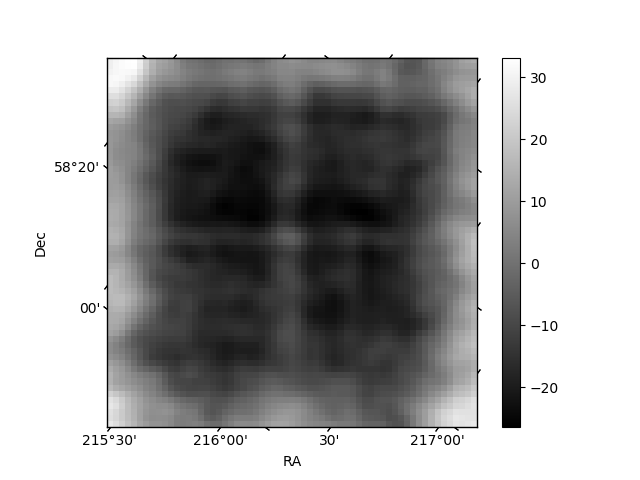
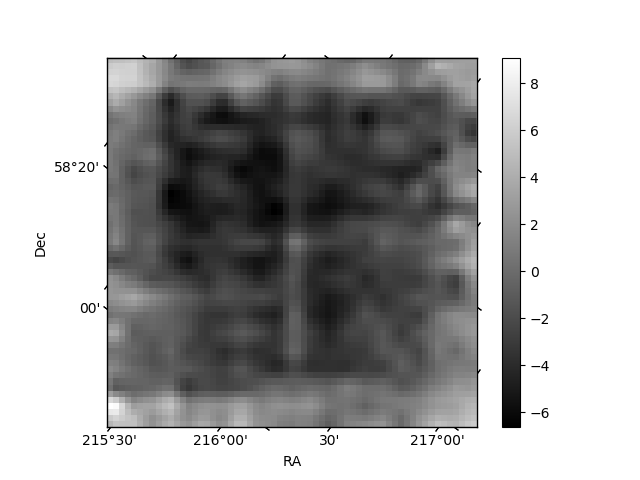
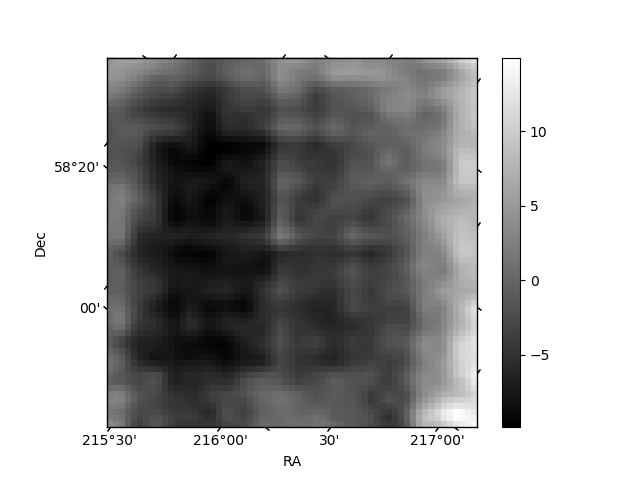
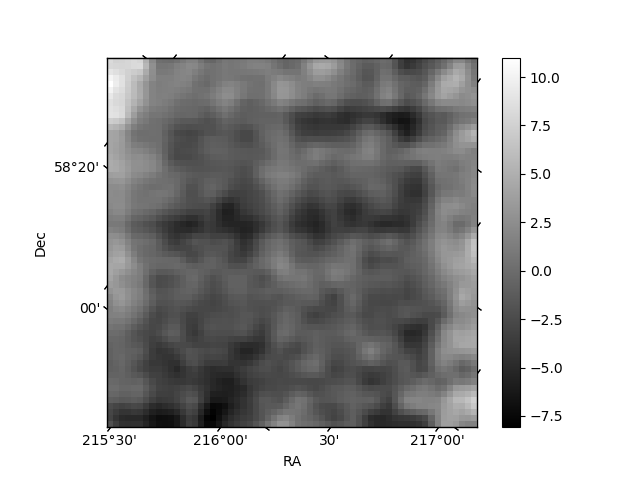
Histogram calculated using DETX and DETY for each event in the final _common_clean file
| Quadrant A | 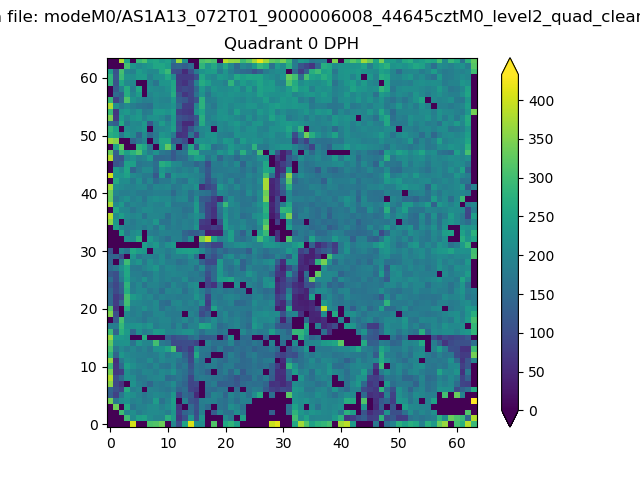 |
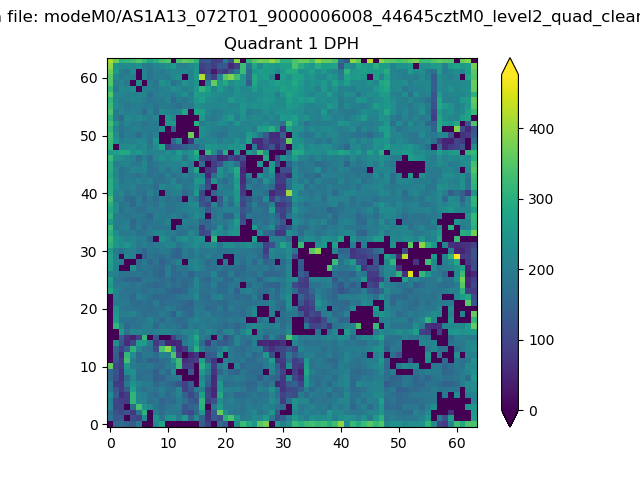 |
Quadrant B |
|---|---|---|---|
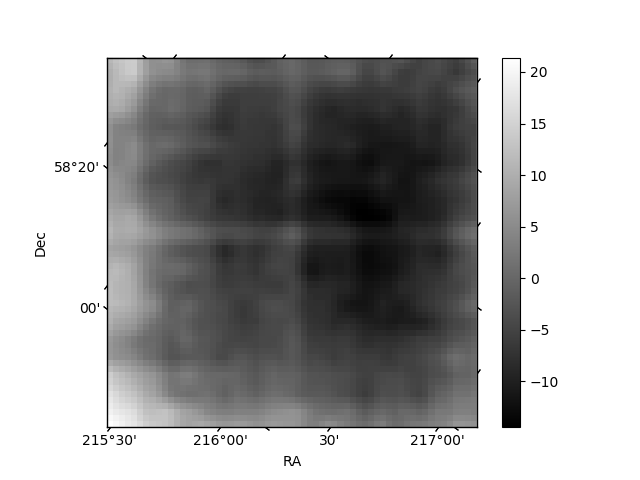
| Quadrant D | 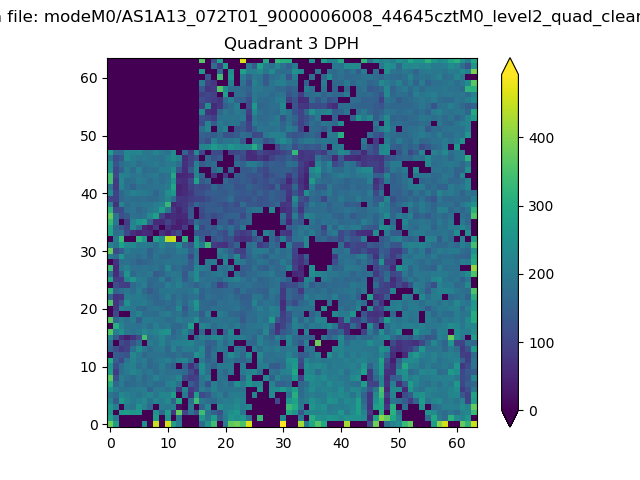 |
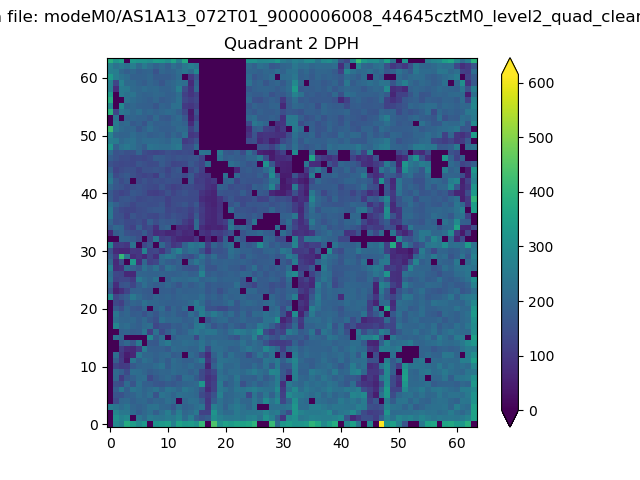 |
Quadrant C |
| Plot type | Count rate plots | Images |
|---|---|---|
| Comparison with Poisson distribution Blue bars denote a histogram of data divided into 1 sec bins. Red curve is a Poisson curve with rate = median count rate of data. |
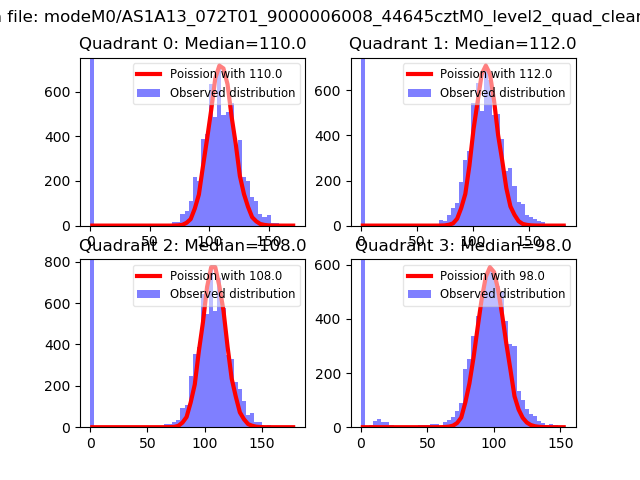 |
 |
| Quadrant-wise count rates Data is divided into 100 sec bins |
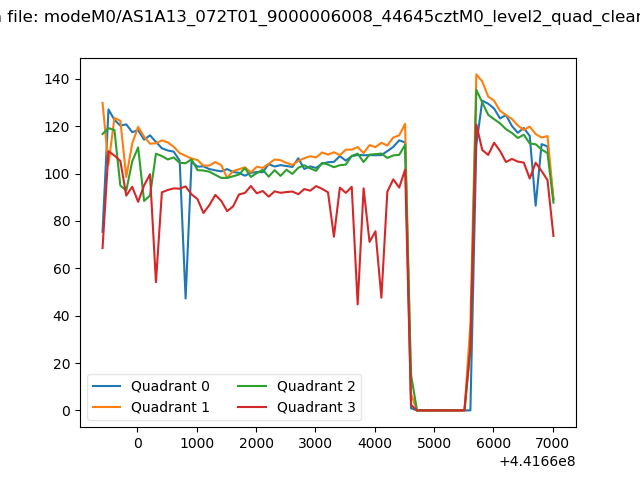 |
|
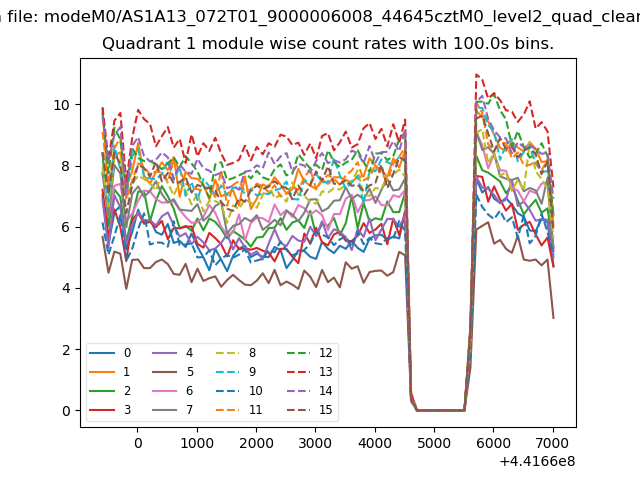
| Module-wise count rates for Quadrant A Data is divided into 100 sec bins |
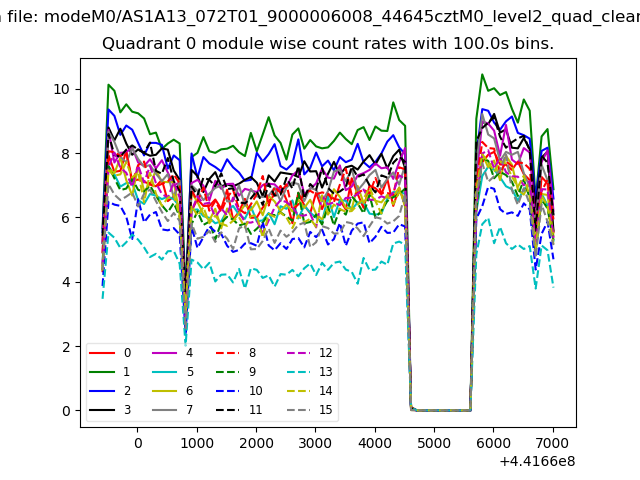 |
 |
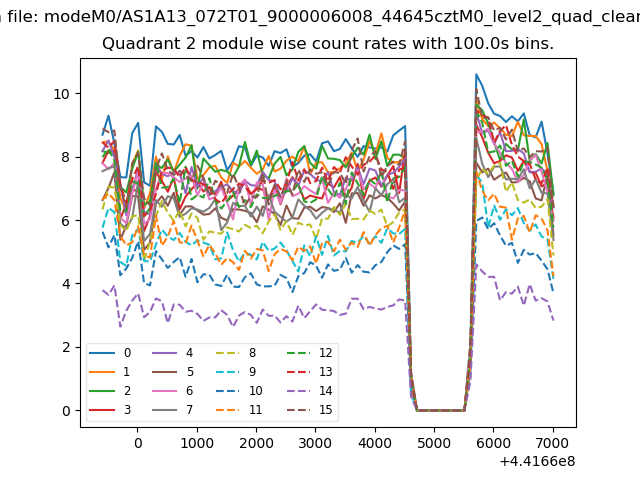
| Module-wise count rates for Quadrant B Data is divided into 100 sec bins |
 |
 |
| Module-wise count rates for Quadrant C Data is divided into 100 sec bins |
 |
 |
| Module-wise count rates for Quadrant D Data is divided into 100 sec bins |
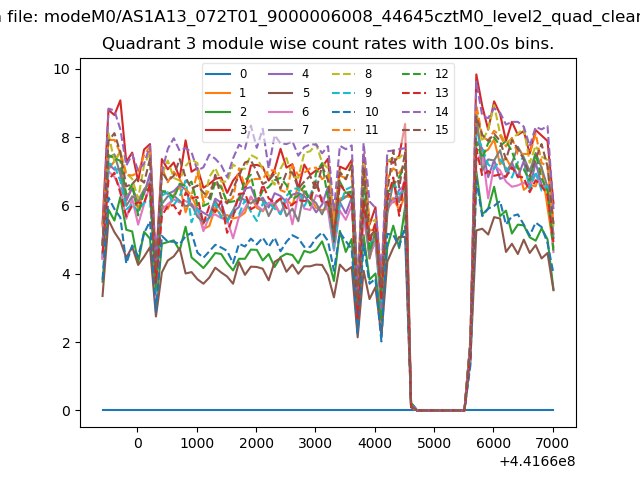 |
 |
| Parameter | Plot |
|---|---|
| CZT HV Monitor | 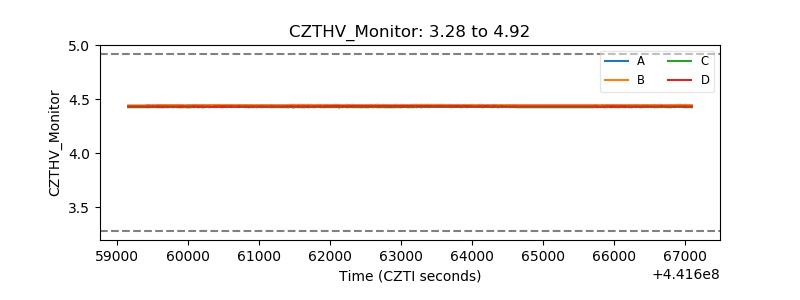 |
| D_VDD | 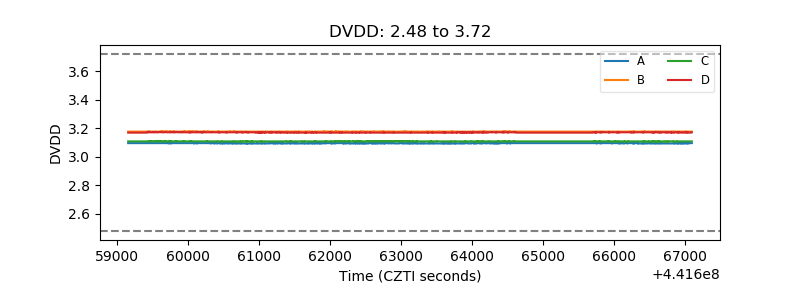 |
| Temperature 1 | 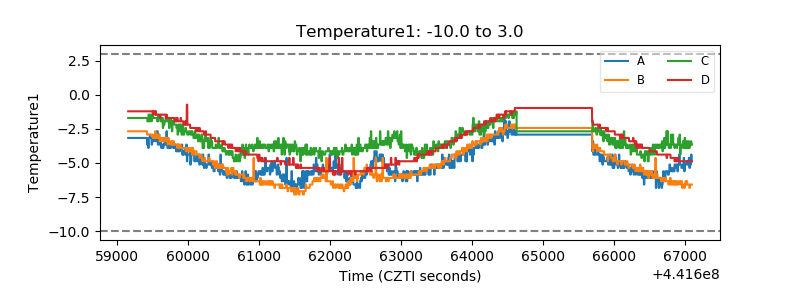 |
| Veto HV Monitor | 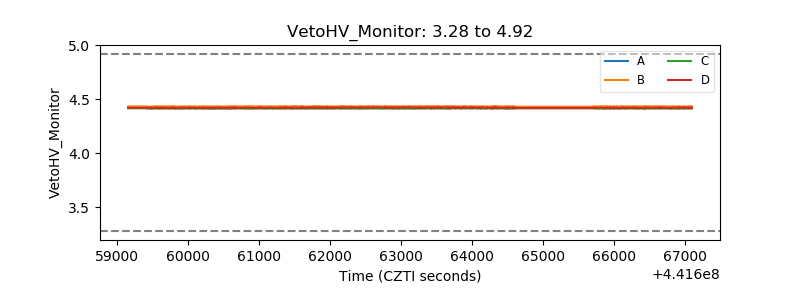 |
| Veto LLD | 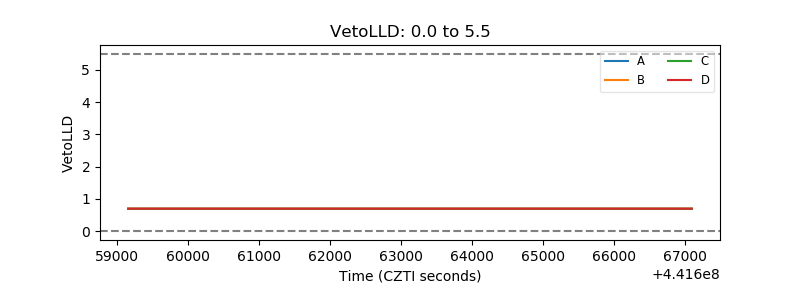 |
| Alpha Counter | 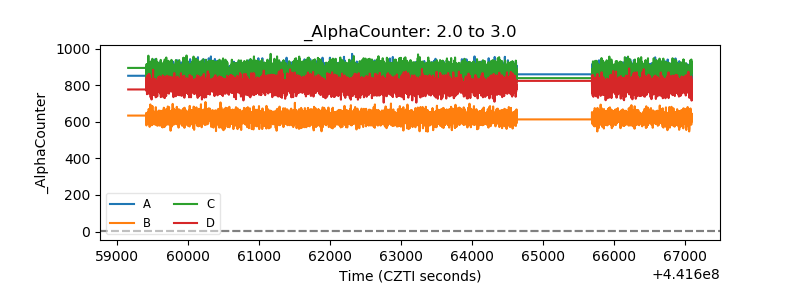 |
| _CPM_Rate | 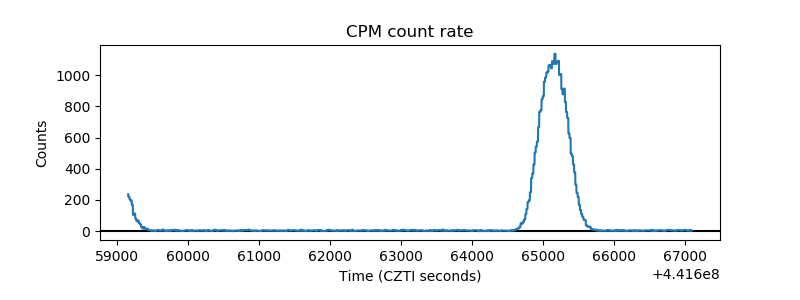 |
| CZT Counter | 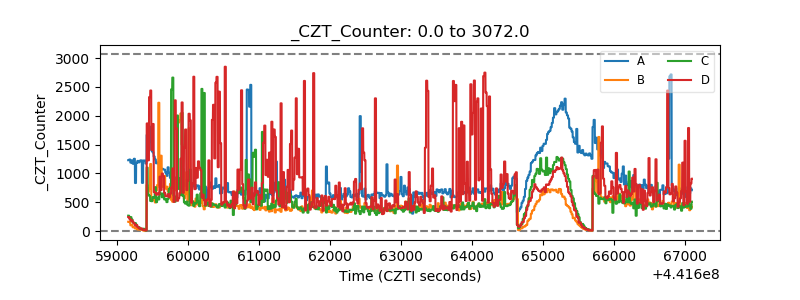 |
| +2.5 Volts monitor | 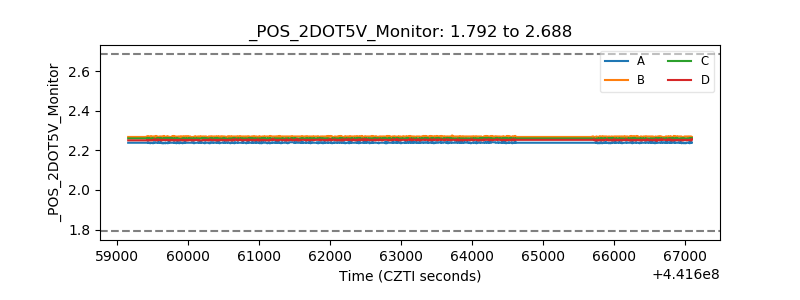 |
| +5 Volts monitor | 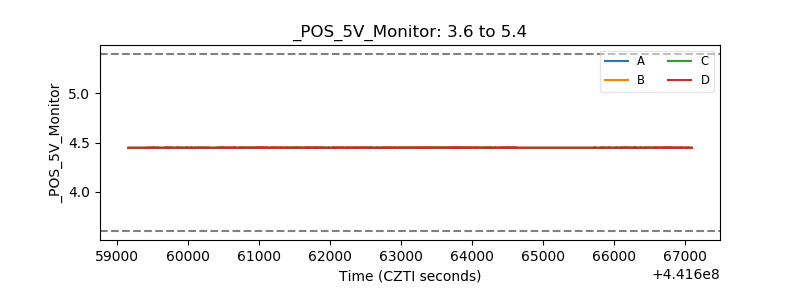 |
| _ROLL_ROT | 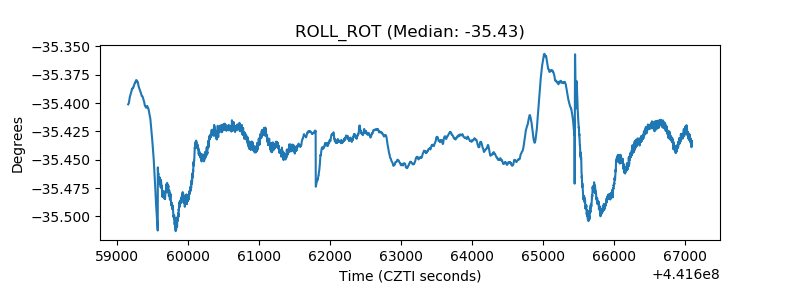 |
| _Roll_DEC | 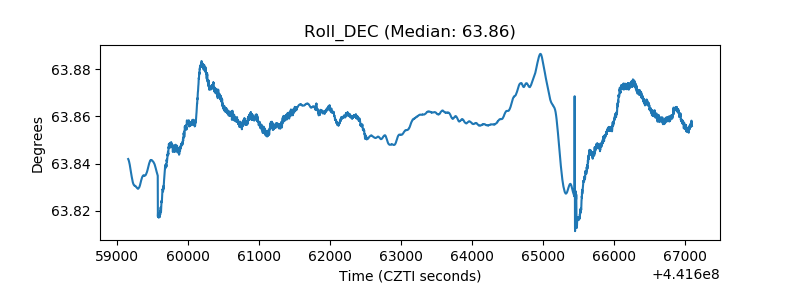 |
| _Roll_RA | 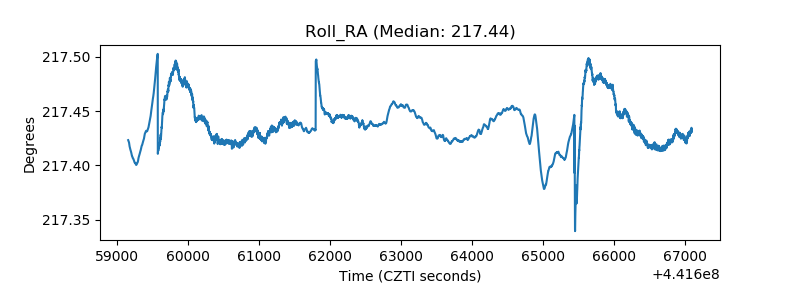 |
| Veto Counter | 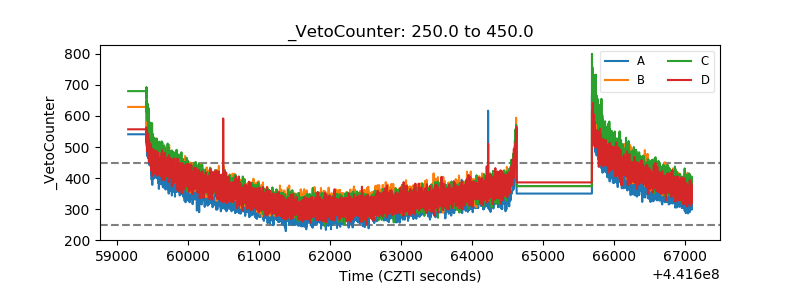 |