| Param | Original file | Final file |
|---|---|---|
| Filename | modeM0/AS1A13_072T01_9000006008_44646cztM0_level2.fits | modeM0/AS1A13_072T01_9000006008_44646cztM0_level2_quad_clean.evt |
| Size (bytes) | 397,811,520 | 103,538,880 |
| Size | 379.4 MB | 98.7 MB |
| Events in quadrant A | 4,635,423 | 686,770 |
| Events in quadrant B | 2,921,339 | 718,485 |
| Events in quadrant C | 2,770,029 | 686,235 |
| Events in quadrant D | 3,921,085 | 614,938 |
| Mode M0 | |||
|---|---|---|---|
| Quadrant | BADHDUFLAG | Total packets | Discarded packets |
| A | 0 | 18915 | 1 |
| B | 0 | 13009 | 1 |
| C | 0 | 12759 | 1 |
| D | 0 | 16152 | 2 |
| Mode SS | |||
|---|---|---|---|
| Quadrant | BADHDUFLAG | Total packets | Discarded packets |
| A | 0 | 124 | 0 |
| B | 0 | 124 | 0 |
| C | 0 | 124 | 0 |
| D | 0 | 124 | 0 |
| Mode M9 | |||
|---|---|---|---|
| Quadrant | BADHDUFLAG | Total packets | Discarded packets |
| A | 0 | 12 | 0 |
| B | 0 | 12 | 0 |
| C | 0 | 12 | 0 |
| D | 0 | 12 | 0 |
| Quadrant | Total seconds | Saturated seconds | Saturation percentage |
|---|---|---|---|
| A | 6143 | 119 | 1.937164% |
| B | 6144 | 46 | 0.748698% |
| C | 6144 | 16 | 0.260417% |
| D | 6143 | 165 | 2.685984% |
Noise dominated data is calculated using 1-second bins in cleaned event files. If a bin has >2000 counts, and if more than 50% of those come from <1% of pixels, then it is considered to be noise-dominated and hence unusable.
| Quadrant | # 1 sec bins | Bins with >0 counts | Bins with >2000 counts | High rate bins dominated by noise | Noise dominated (total time) | Noise dominated (detector-on time) | Marked lightcurve |
|---|---|---|---|---|---|---|---|
| A | 7333 | 6144 | 55 | 55 | 0.75% | 0.90% | 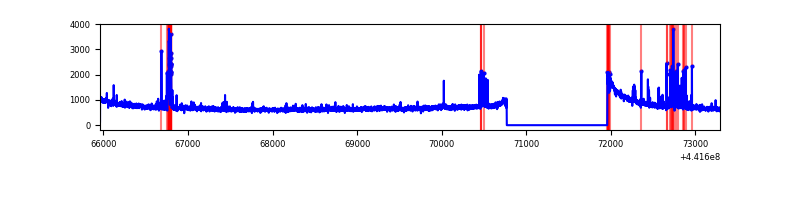 |
| B | 7334 | 6145 | 19 | 19 | 0.26% | 0.31% | 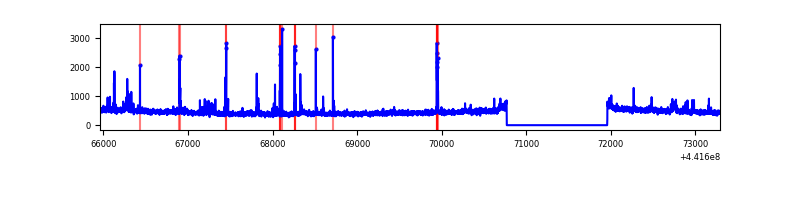 |
| C | 7334 | 6145 | 6 | 6 | 0.08% | 0.10% | 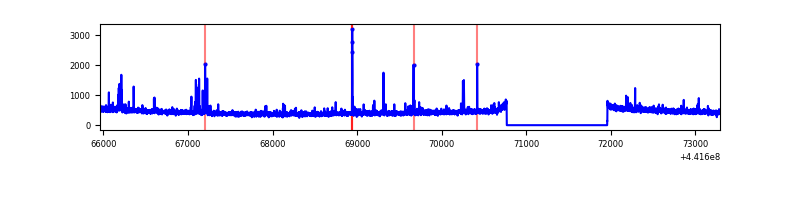 |
| D | 7333 | 6144 | 130 | 130 | 1.77% | 2.12% | 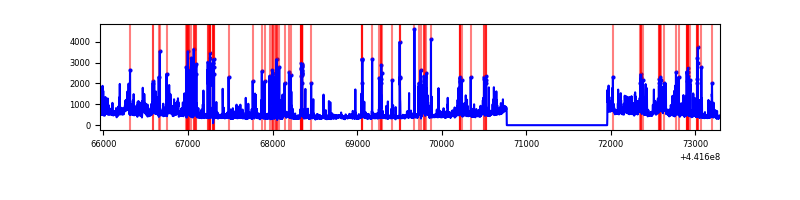 |
Top three noisy pixels from each quadrant. If the there are fewer than three noisy pixels in the level2.evt file, extra rows are filled as -1
| Pixel properties | Quadrant properties | ||||||
|---|---|---|---|---|---|---|---|
| Quadrant | DetID | PixID | Counts | Sigma | Mean | Median | Sigma |
| A | 10 | 83 | 1737049 | 12462.01 | 675 | 662 | 139.3 |
| A | 13 | 248 | 134954 | 963.81 | 675 | 662 | 139.3 |
| A | 15 | 223 | 123494 | 881.56 | 675 | 662 | 139.3 |
| B | 5 | 172 | 108361 | 810.19 | 680 | 661 | 132.9 |
| B | 0 | 183 | 30730 | 226.2 | 680 | 661 | 132.9 |
| B | 0 | 189 | 26202 | 192.14 | 680 | 661 | 132.9 |
| C | 2 | 14 | 63047 | 395.34 | 673 | 676 | 157.8 |
| C | 3 | 233 | 50538 | 316.05 | 673 | 676 | 157.8 |
| C | 12 | 249 | 13071 | 78.57 | 673 | 676 | 157.8 |
| D | 1 | 52 | 347046 | 2122.85 | 657 | 637 | 163.2 |
| D | 13 | 249 | 301768 | 1845.38 | 657 | 637 | 163.2 |
| D | 2 | 249 | 283715 | 1734.75 | 657 | 637 | 163.2 |
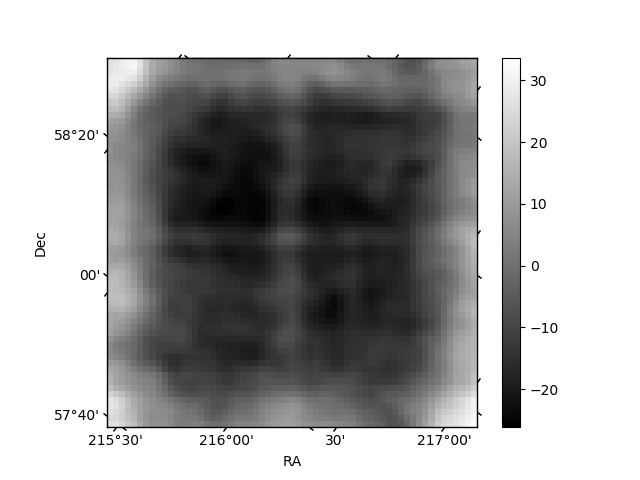
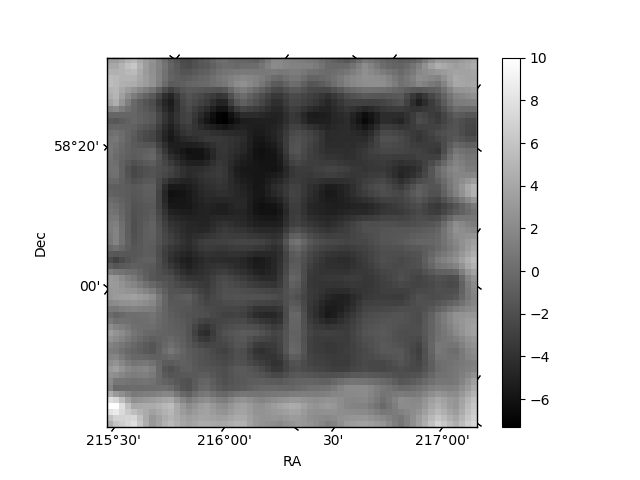
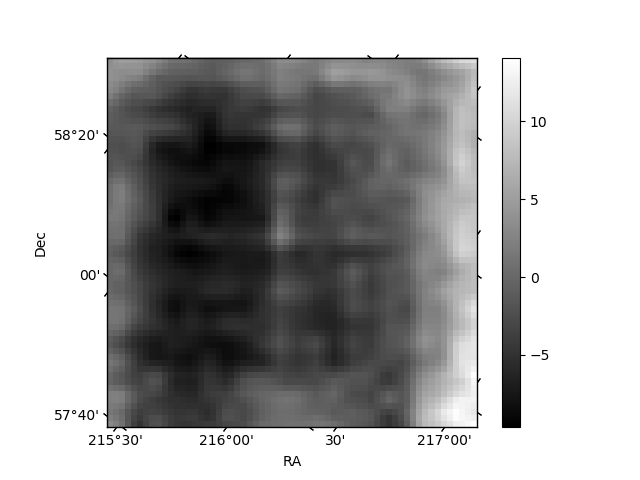
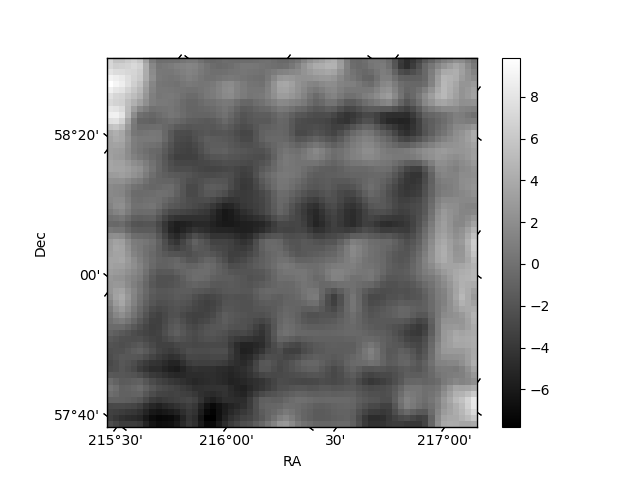
Histogram calculated using DETX and DETY for each event in the final _common_clean file
| Quadrant A | 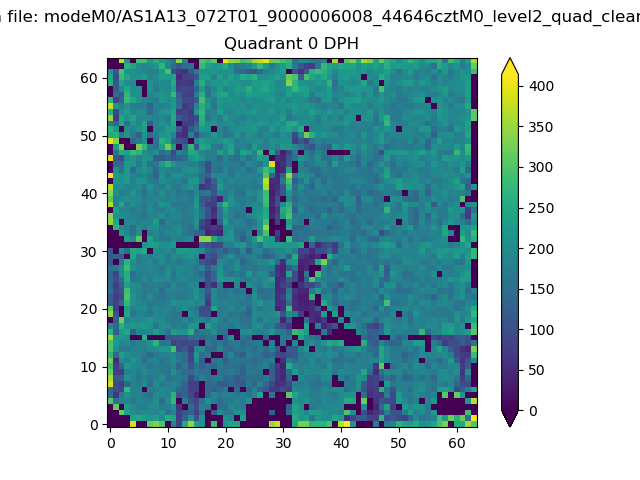 |
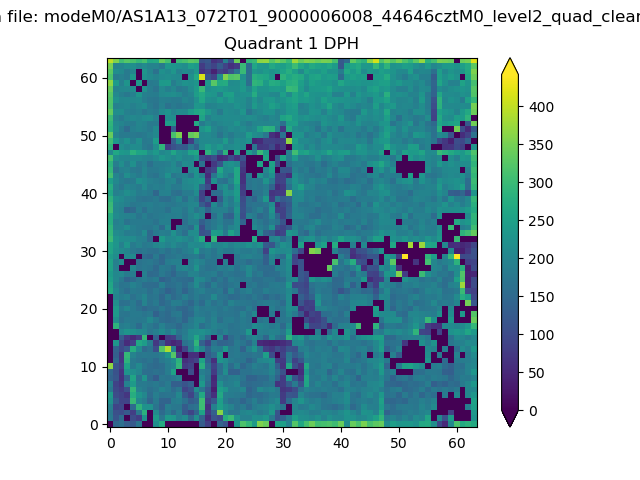 |
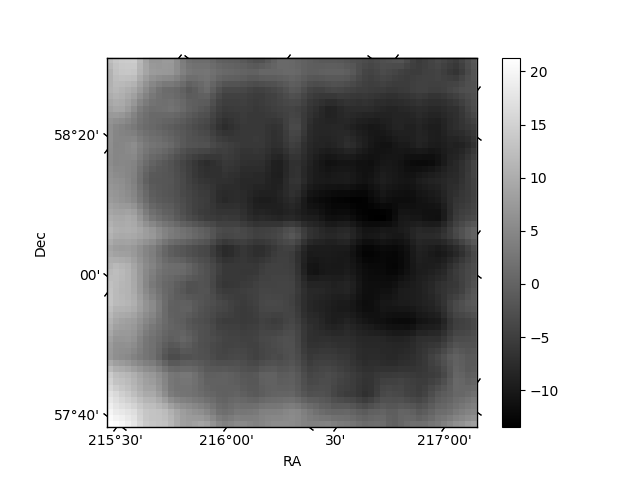
Quadrant B |
|---|---|---|---|
| Quadrant D | 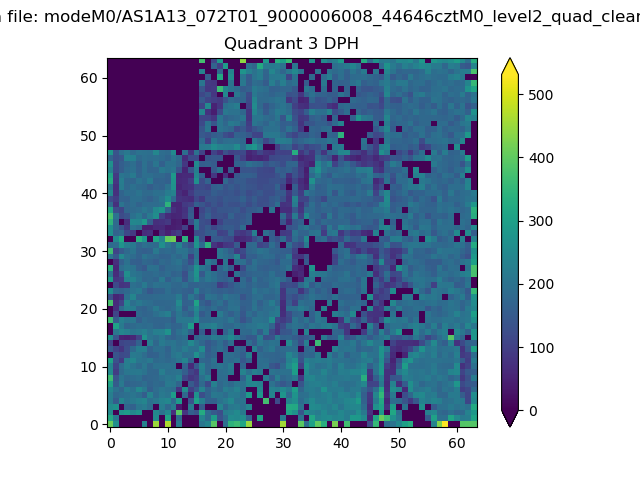 |
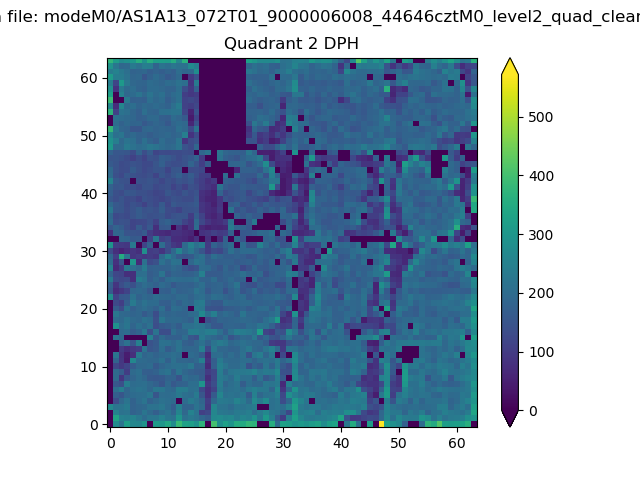 |
Quadrant C |
| Plot type | Count rate plots | Images |
|---|---|---|
| Comparison with Poisson distribution Blue bars denote a histogram of data divided into 1 sec bins. Red curve is a Poisson curve with rate = median count rate of data. |
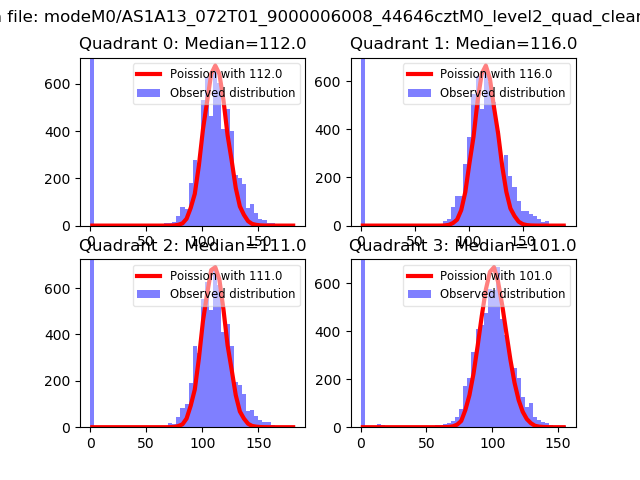 |
 |
| Quadrant-wise count rates Data is divided into 100 sec bins |
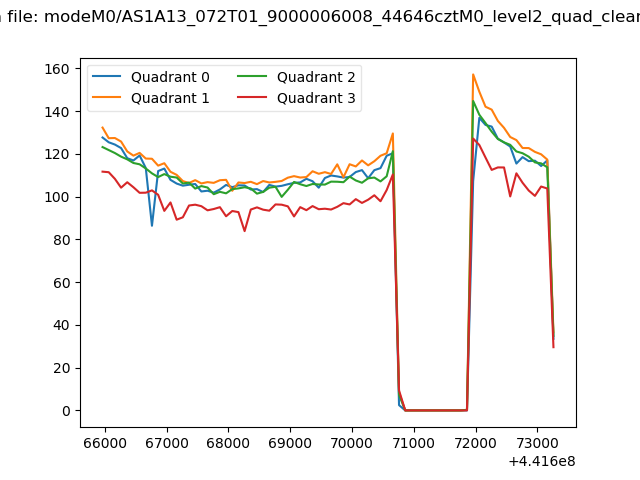 |
|
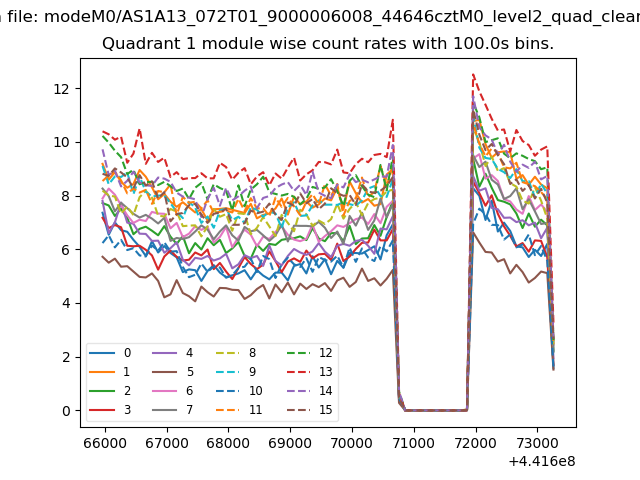
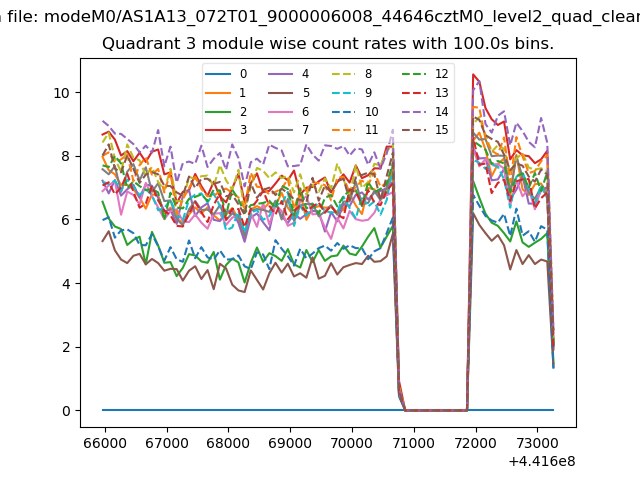
| Module-wise count rates for Quadrant A Data is divided into 100 sec bins |
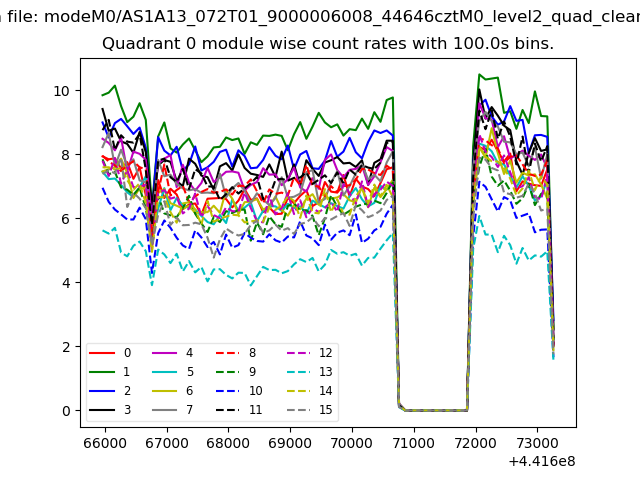 |
 |
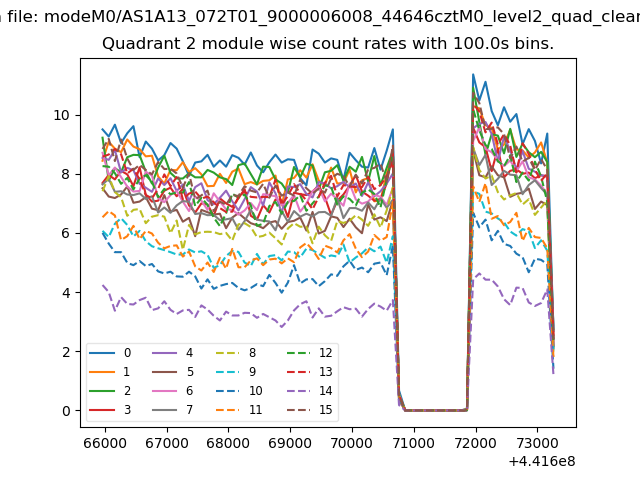
| Module-wise count rates for Quadrant B Data is divided into 100 sec bins |
 |
 |
| Module-wise count rates for Quadrant C Data is divided into 100 sec bins |
 |
 |
| Module-wise count rates for Quadrant D Data is divided into 100 sec bins |
 |
 |
| Parameter | Plot |
|---|---|
| CZT HV Monitor | 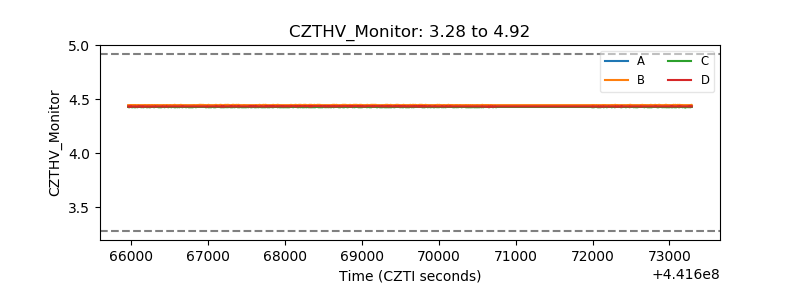 |
| D_VDD | 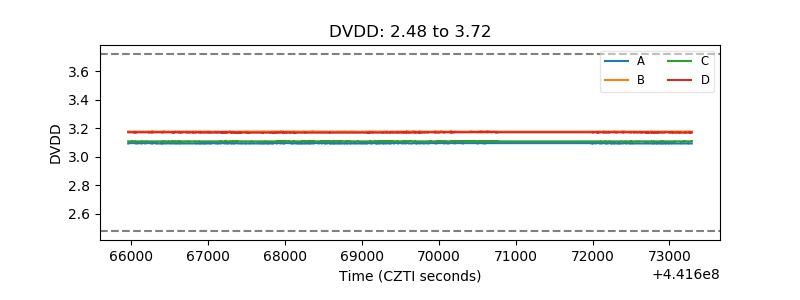 |
| Temperature 1 | 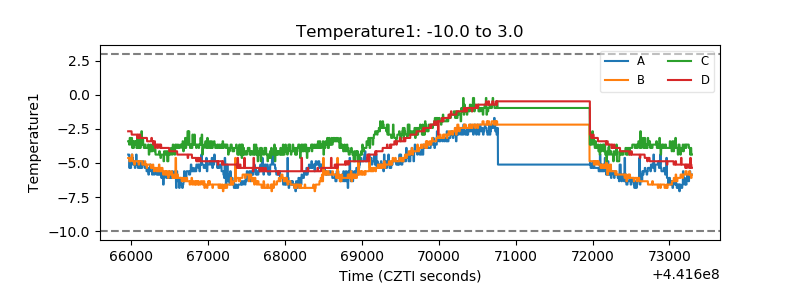 |
| Veto HV Monitor | 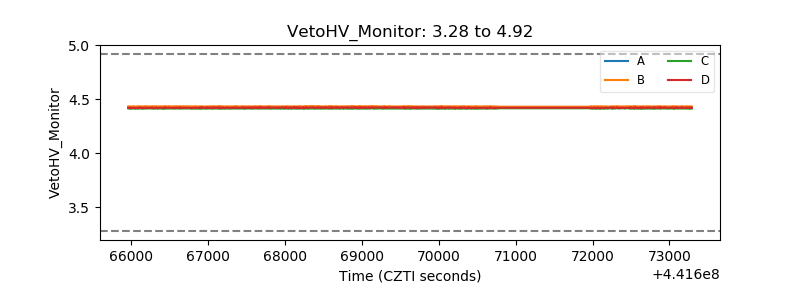 |
| Veto LLD | 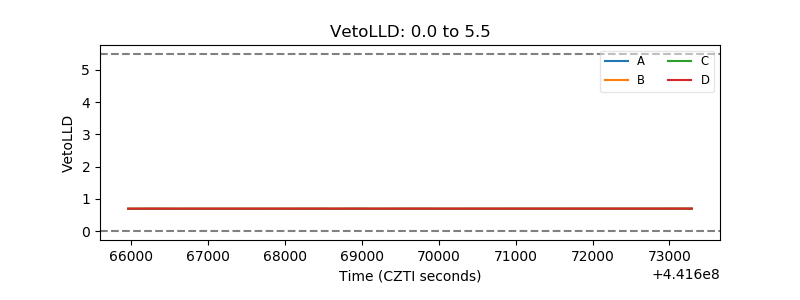 |
| Alpha Counter | 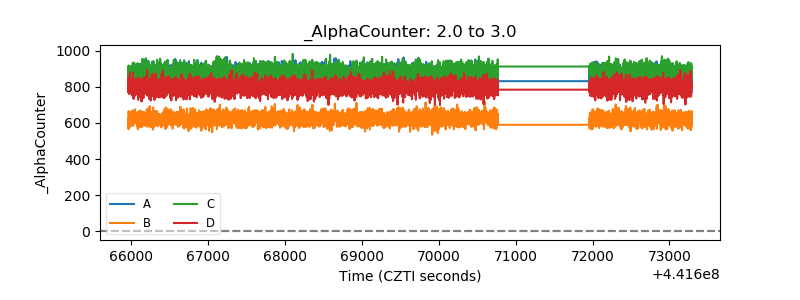 |
| _CPM_Rate | 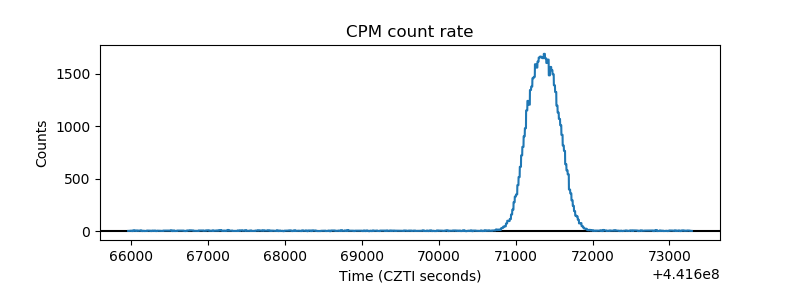 |
| CZT Counter | 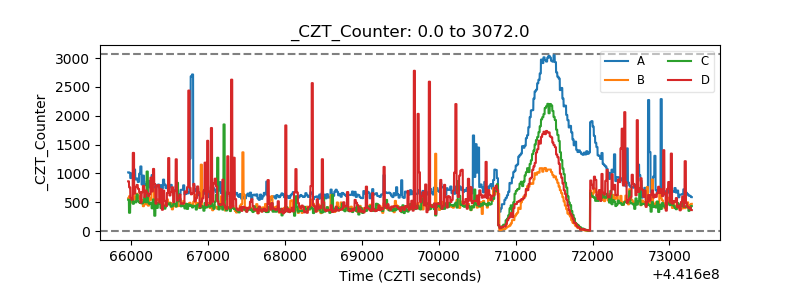 |
| +2.5 Volts monitor | 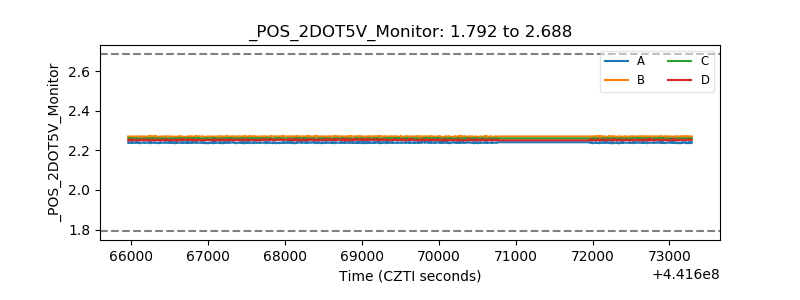 |
| +5 Volts monitor | 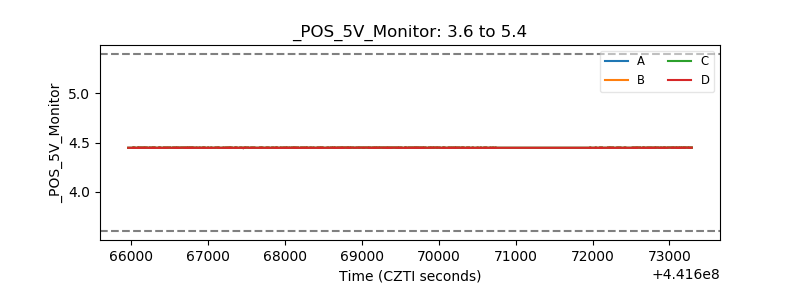 |
| _ROLL_ROT | 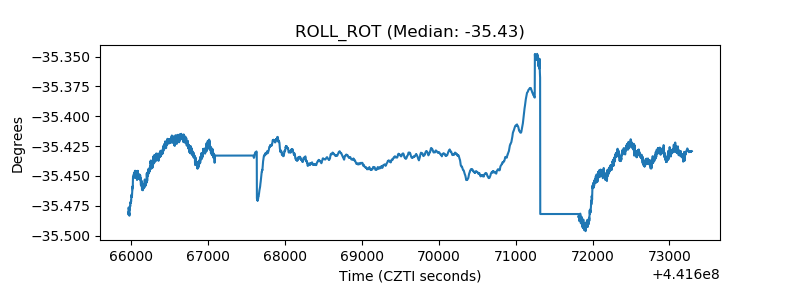 |
| _Roll_DEC | 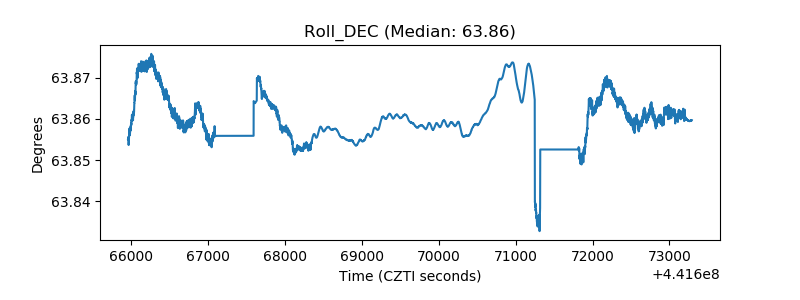 |
| _Roll_RA | 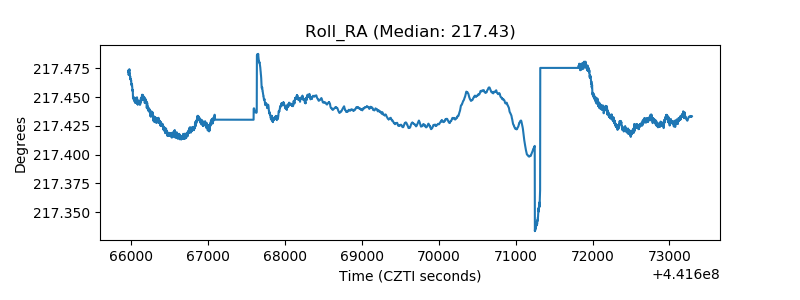 |
| Veto Counter | 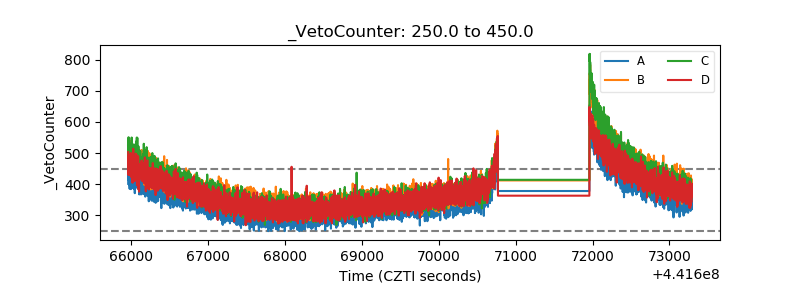 |