| Param | Original file | Final file |
|---|---|---|
| Filename | modeM0/AS1A13_072T01_9000006008_44647cztM0_level2.fits | modeM0/AS1A13_072T01_9000006008_44647cztM0_level2_quad_clean.evt |
| Size (bytes) | 434,226,240 | 109,241,280 |
| Size | 414.1 MB | 104.2 MB |
| Events in quadrant A | 5,178,324 | 727,702 |
| Events in quadrant B | 3,097,998 | 768,462 |
| Events in quadrant C | 2,971,374 | 730,503 |
| Events in quadrant D | 4,334,716 | 640,362 |
| Mode M0 | |||
|---|---|---|---|
| Quadrant | BADHDUFLAG | Total packets | Discarded packets |
| A | 0 | 20592 | 2 |
| B | 0 | 13613 | 2 |
| C | 0 | 13373 | 2 |
| D | 0 | 17501 | 2 |
| Mode SS | |||
|---|---|---|---|
| Quadrant | BADHDUFLAG | Total packets | Discarded packets |
| A | 0 | 126 | 0 |
| B | 0 | 126 | 0 |
| C | 0 | 126 | 0 |
| D | 0 | 126 | 0 |
| Mode M9 | |||
|---|---|---|---|
| Quadrant | BADHDUFLAG | Total packets | Discarded packets |
| A | 0 | 14 | 0 |
| B | 0 | 15 | 0 |
| C | 0 | 15 | 0 |
| D | 0 | 15 | 0 |
| Quadrant | Total seconds | Saturated seconds | Saturation percentage |
|---|---|---|---|
| A | 6324 | 231 | 3.652751% |
| B | 6324 | 79 | 1.249209% |
| C | 6324 | 20 | 0.316256% |
| D | 6324 | 289 | 4.569892% |
Noise dominated data is calculated using 1-second bins in cleaned event files. If a bin has >2000 counts, and if more than 50% of those come from <1% of pixels, then it is considered to be noise-dominated and hence unusable.
| Quadrant | # 1 sec bins | Bins with >0 counts | Bins with >2000 counts | High rate bins dominated by noise | Noise dominated (total time) | Noise dominated (detector-on time) | Marked lightcurve |
|---|---|---|---|---|---|---|---|
| A | 7559 | 6325 | 57 | 57 | 0.75% | 0.90% | 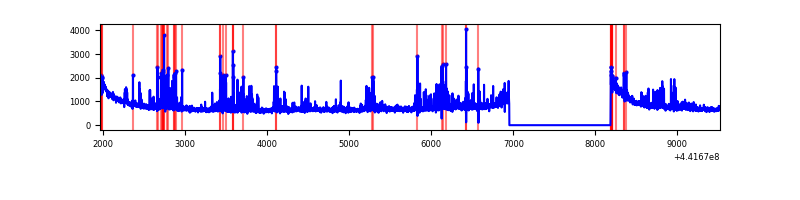 |
| B | 7559 | 6325 | 37 | 37 | 0.49% | 0.58% | 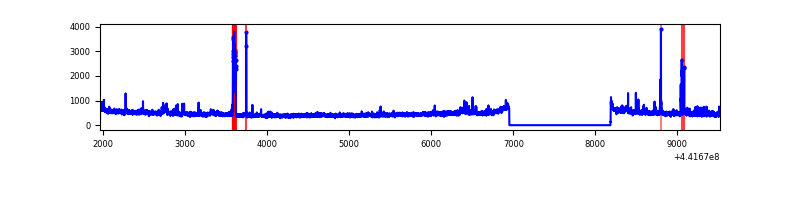 |
| C | 7559 | 6325 | 9 | 9 | 0.12% | 0.14% | 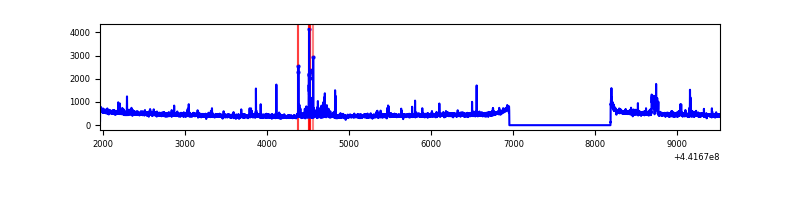 |
| D | 7559 | 6325 | 185 | 185 | 2.45% | 2.92% | 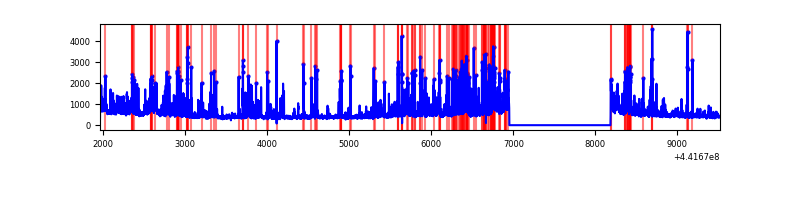 |
Top three noisy pixels from each quadrant. If the there are fewer than three noisy pixels in the level2.evt file, extra rows are filled as -1
| Pixel properties | Quadrant properties | ||||||
|---|---|---|---|---|---|---|---|
| Quadrant | DetID | PixID | Counts | Sigma | Mean | Median | Sigma |
| A | 10 | 83 | 1901744 | 12992.62 | 708 | 694 | 146.3 |
| A | 15 | 223 | 423870 | 2892.17 | 708 | 694 | 146.3 |
| A | 13 | 248 | 80747 | 547.12 | 708 | 694 | 146.3 |
| B | 7 | 221 | 91160 | 657.71 | 717 | 698 | 137.5 |
| B | 0 | 183 | 71384 | 513.93 | 717 | 698 | 137.5 |
| B | 5 | 172 | 47200 | 338.1 | 717 | 698 | 137.5 |
| C | 14 | 254 | 73521 | 441.83 | 707 | 711 | 164.8 |
| C | 15 | 252 | 58218 | 348.97 | 707 | 711 | 164.8 |
| C | 3 | 233 | 44121 | 263.42 | 707 | 711 | 164.8 |
| D | 13 | 249 | 554228 | 3237.02 | 683 | 663 | 171.0 |
| D | 1 | 52 | 382250 | 2231.37 | 683 | 663 | 171.0 |
| D | 2 | 249 | 375511 | 2191.96 | 683 | 663 | 171.0 |
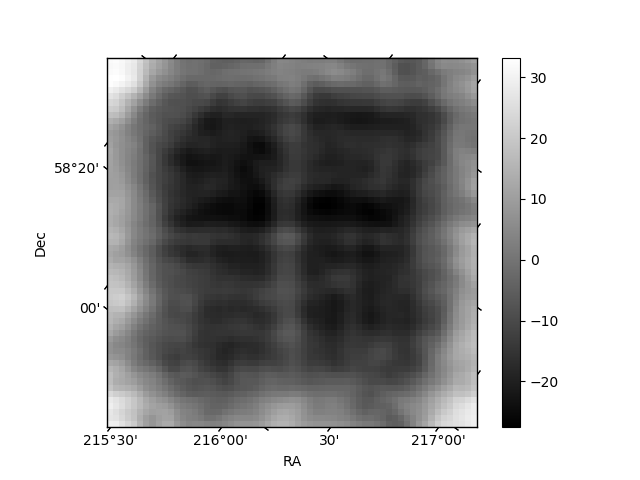
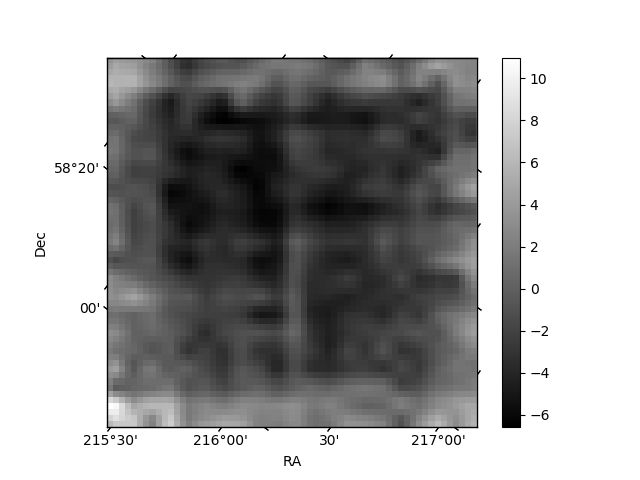
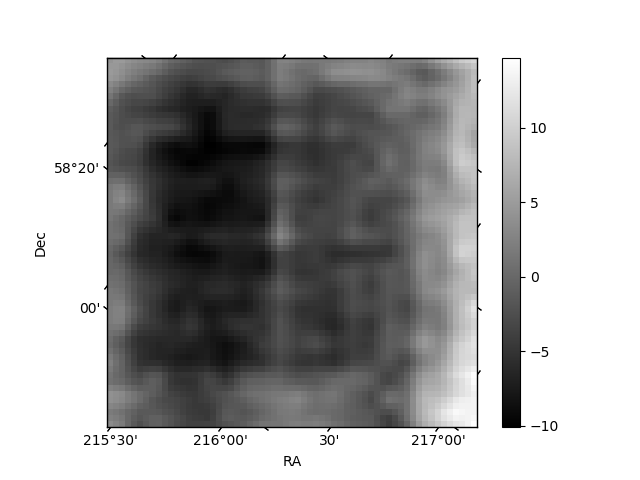
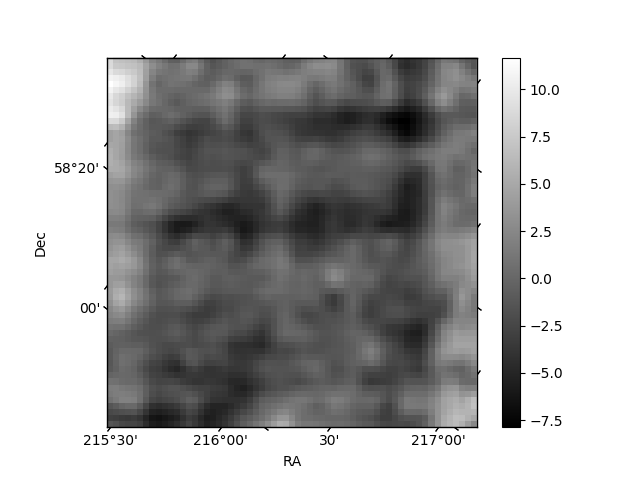
Histogram calculated using DETX and DETY for each event in the final _common_clean file
| Quadrant A | 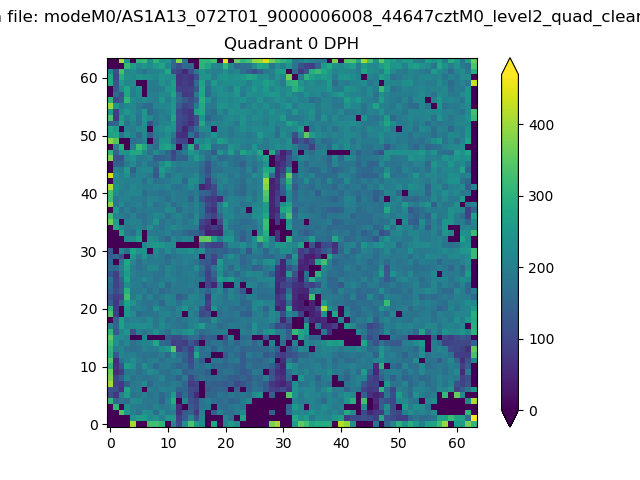 |
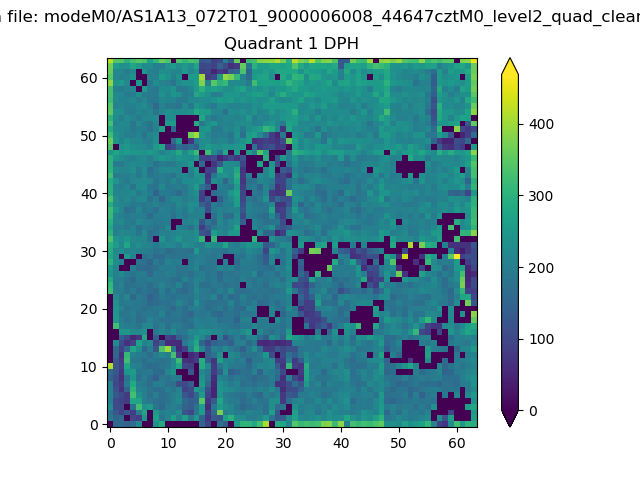 |
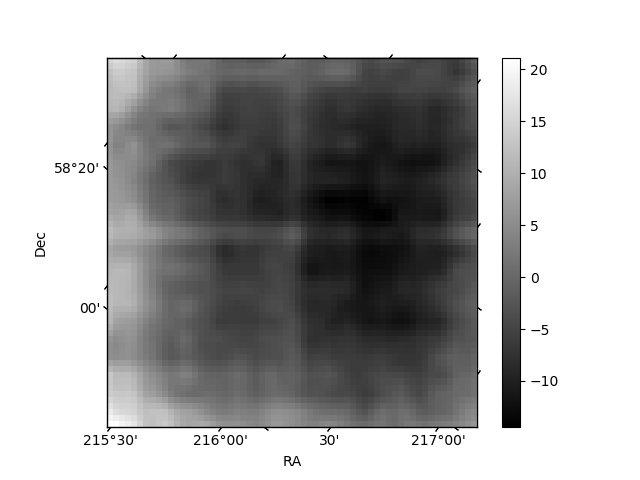
Quadrant B |
|---|---|---|---|
| Quadrant D | 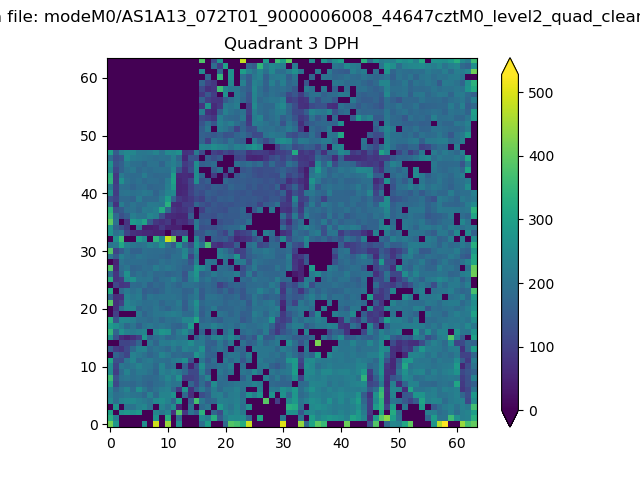 |
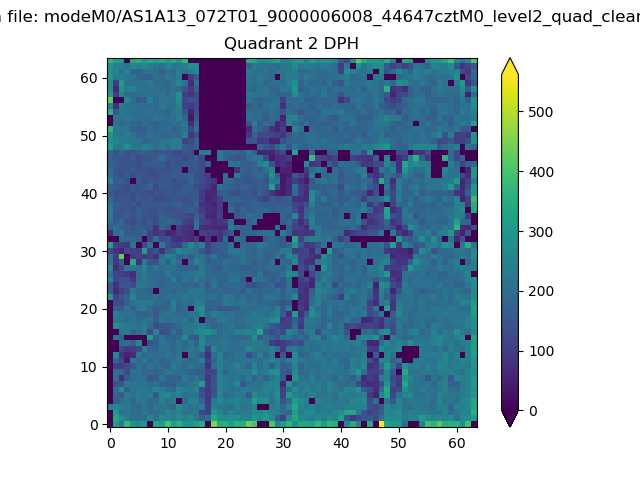 |
Quadrant C |
| Plot type | Count rate plots | Images |
|---|---|---|
| Comparison with Poisson distribution Blue bars denote a histogram of data divided into 1 sec bins. Red curve is a Poisson curve with rate = median count rate of data. |
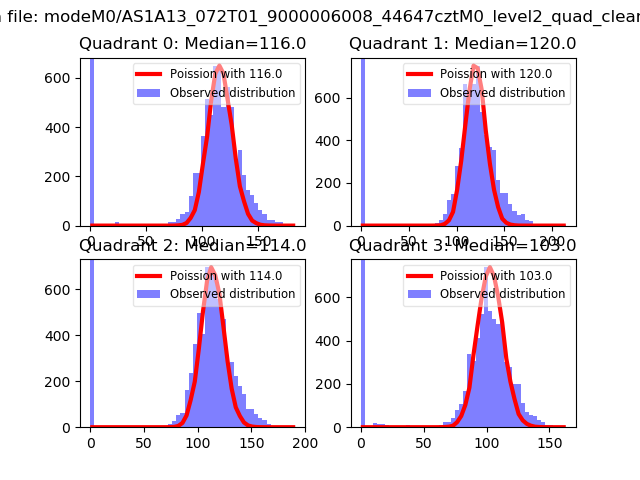 |
 |
| Quadrant-wise count rates Data is divided into 100 sec bins |
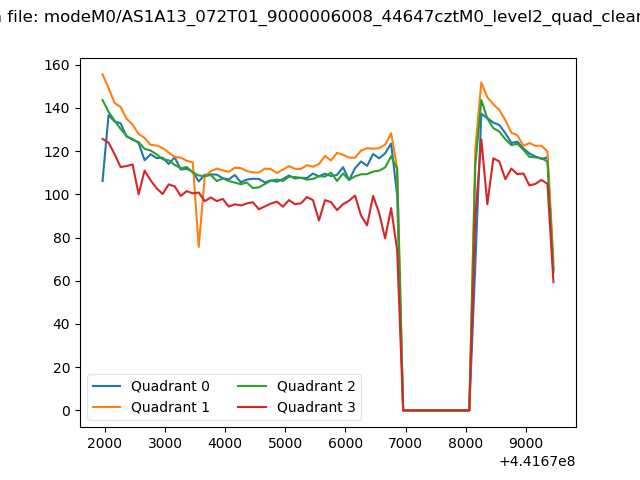 |
|
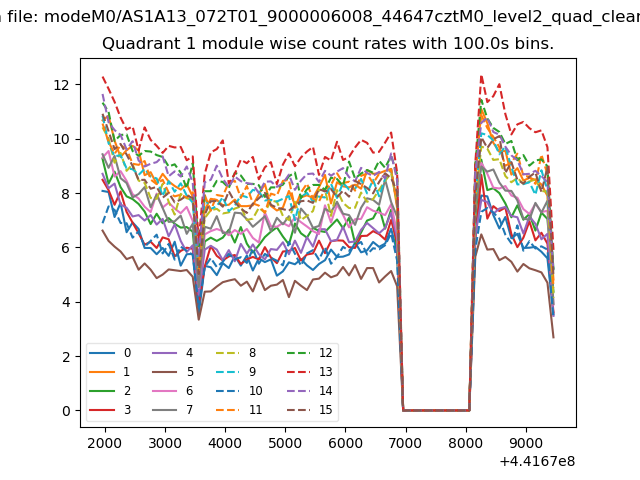
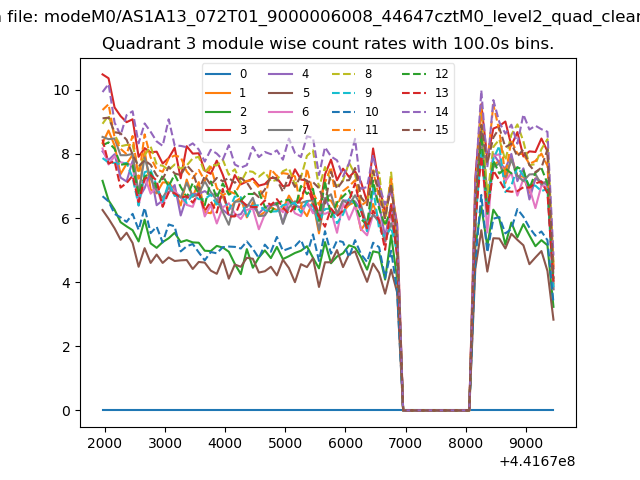
| Module-wise count rates for Quadrant A Data is divided into 100 sec bins |
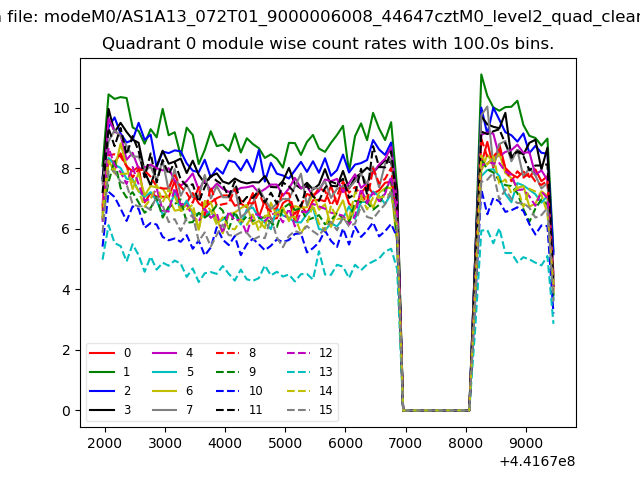 |
 |
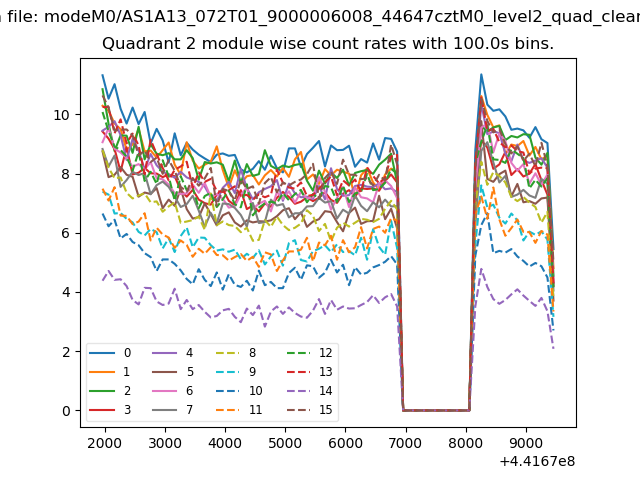
| Module-wise count rates for Quadrant B Data is divided into 100 sec bins |
 |
 |
| Module-wise count rates for Quadrant C Data is divided into 100 sec bins |
 |
 |
| Module-wise count rates for Quadrant D Data is divided into 100 sec bins |
 |
 |
| Parameter | Plot |
|---|---|
| CZT HV Monitor | 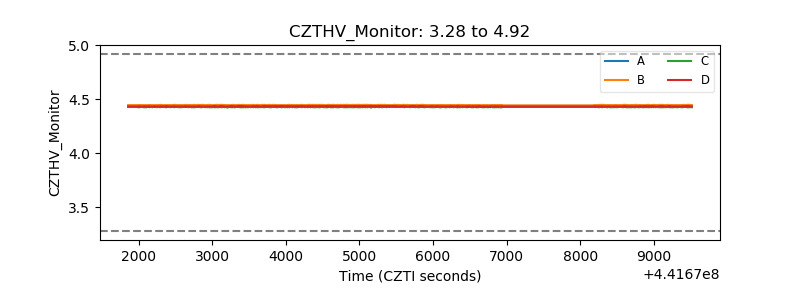 |
| D_VDD | 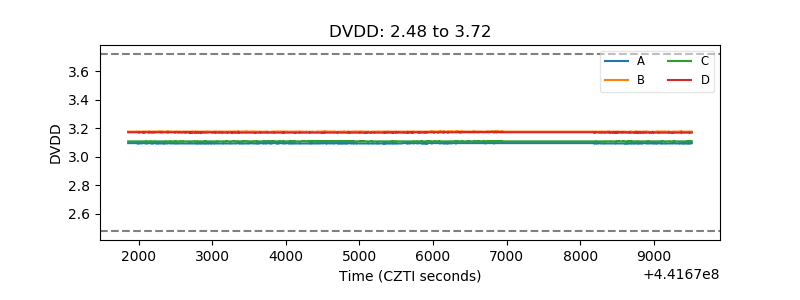 |
| Temperature 1 | 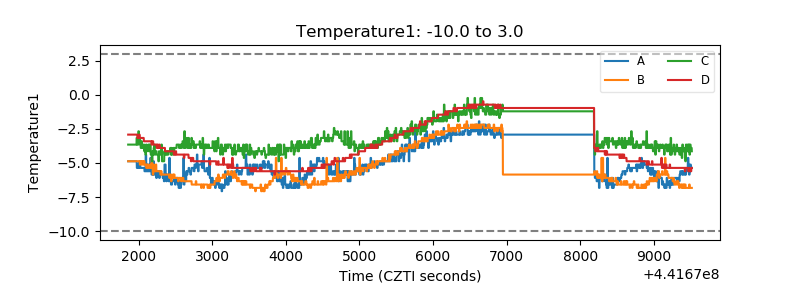 |
| Veto HV Monitor | 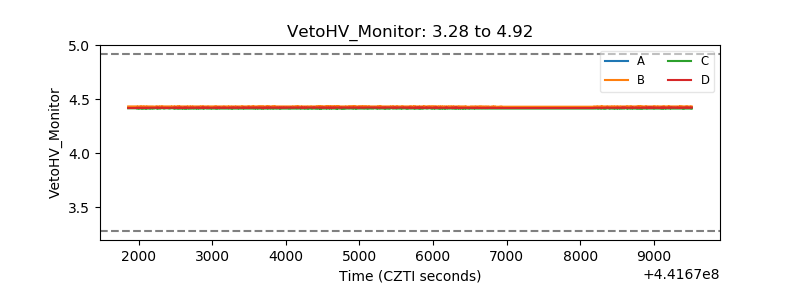 |
| Veto LLD | 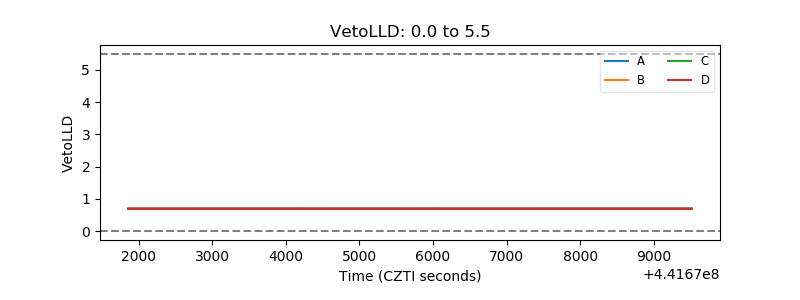 |
| Alpha Counter | 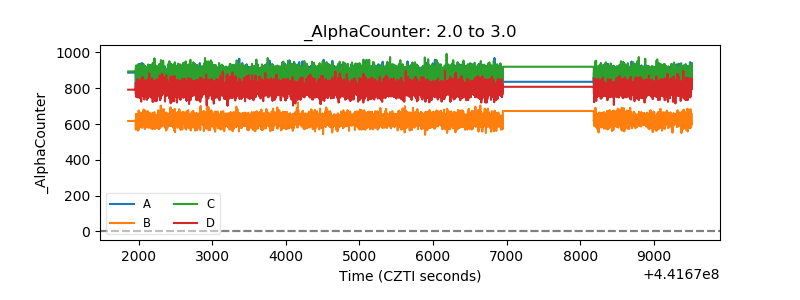 |
| _CPM_Rate | 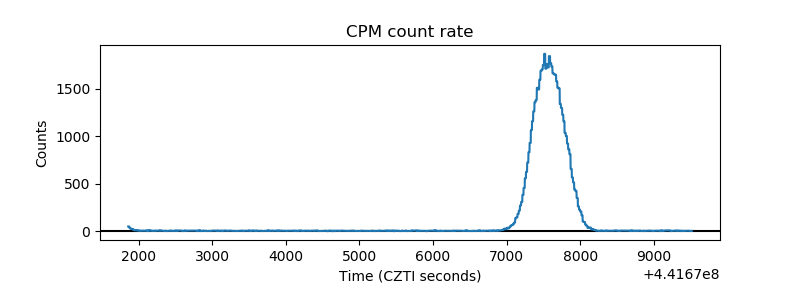 |
| CZT Counter | 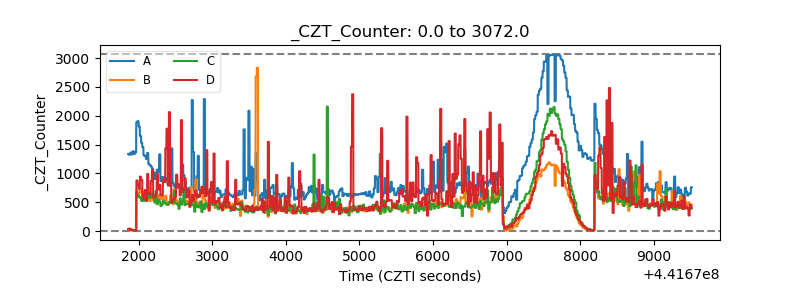 |
| +2.5 Volts monitor | 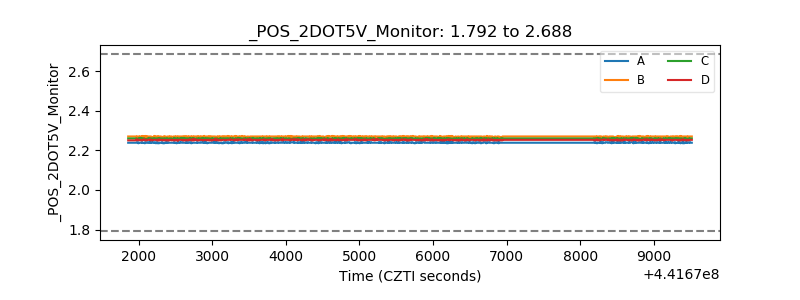 |
| +5 Volts monitor | 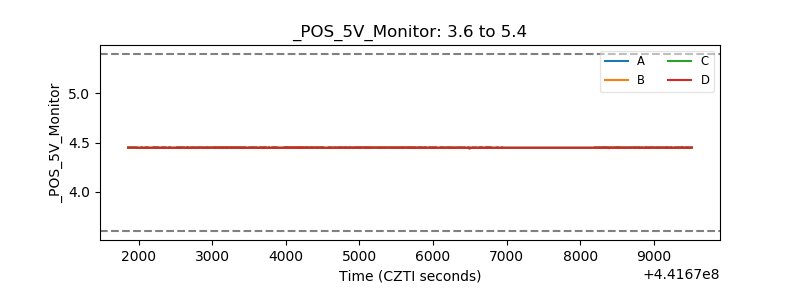 |
| _ROLL_ROT |  |
| _Roll_DEC | 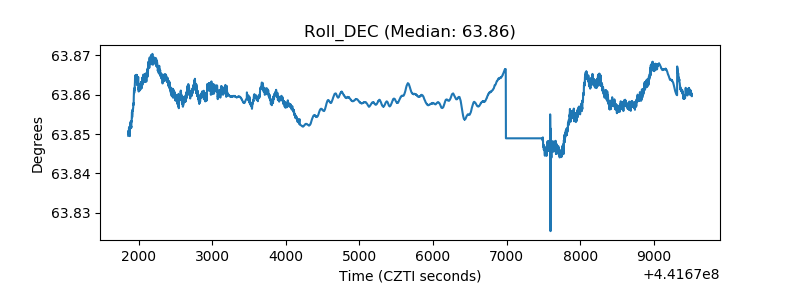 |
| _Roll_RA | 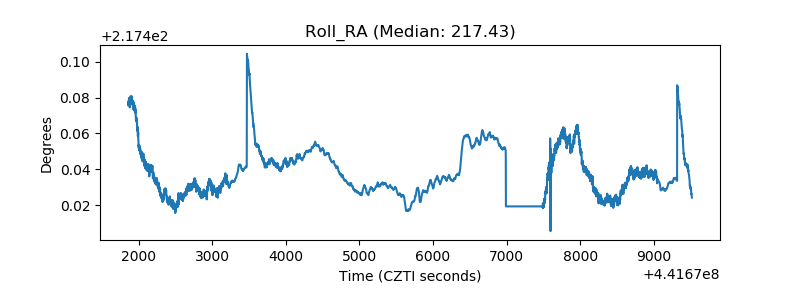 |
| Veto Counter | 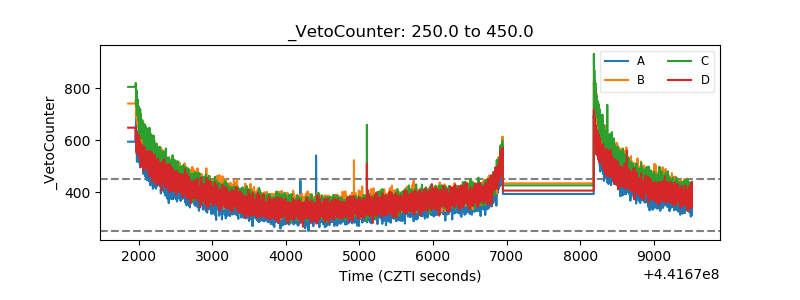 |