| Param | Original file | Final file |
|---|---|---|
| Filename | modeM0/AS1A13_072T01_9000006008_44649cztM0_level2.fits | modeM0/AS1A13_072T01_9000006008_44649cztM0_level2_quad_clean.evt |
| Size (bytes) | 462,548,160 | 108,109,440 |
| Size | 441.1 MB | 103.1 MB |
| Events in quadrant A | 4,960,925 | 734,064 |
| Events in quadrant B | 3,000,067 | 770,190 |
| Events in quadrant C | 3,198,463 | 719,603 |
| Events in quadrant D | 5,461,444 | 599,696 |
| Mode M0 | |||
|---|---|---|---|
| Quadrant | BADHDUFLAG | Total packets | Discarded packets |
| A | 0 | 20042 | 2 |
| B | 0 | 13480 | 2 |
| C | 0 | 14415 | 2 |
| D | 0 | 20826 | 3 |
| Mode SS | |||
|---|---|---|---|
| Quadrant | BADHDUFLAG | Total packets | Discarded packets |
| A | 0 | 132 | 0 |
| B | 0 | 132 | 0 |
| C | 0 | 132 | 0 |
| D | 0 | 132 | 0 |
| Mode M9 | |||
|---|---|---|---|
| Quadrant | BADHDUFLAG | Total packets | Discarded packets |
| A | 0 | 12 | 0 |
| B | 0 | 12 | 0 |
| C | 0 | 12 | 0 |
| D | 0 | 12 | 0 |
| Quadrant | Total seconds | Saturated seconds | Saturation percentage |
|---|---|---|---|
| A | 6450 | 142 | 2.201550% |
| B | 6450 | 43 | 0.666667% |
| C | 6450 | 72 | 1.116279% |
| D | 6450 | 707 | 10.961240% |
Noise dominated data is calculated using 1-second bins in cleaned event files. If a bin has >2000 counts, and if more than 50% of those come from <1% of pixels, then it is considered to be noise-dominated and hence unusable.
| Quadrant | # 1 sec bins | Bins with >0 counts | Bins with >2000 counts | High rate bins dominated by noise | Noise dominated (total time) | Noise dominated (detector-on time) | Marked lightcurve |
|---|---|---|---|---|---|---|---|
| A | 7615 | 6451 | 20 | 20 | 0.26% | 0.31% | 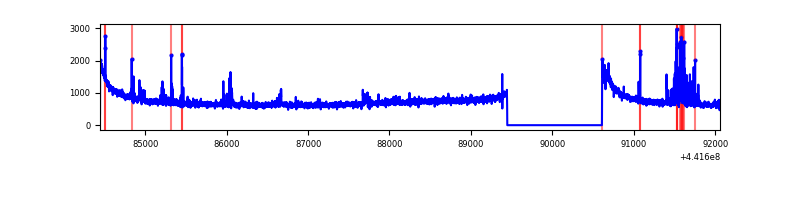 |
| B | 7615 | 6451 | 5 | 5 | 0.07% | 0.08% | 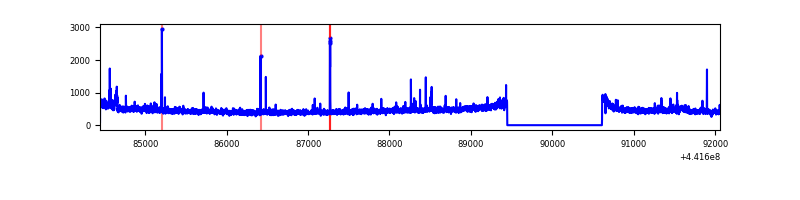 |
| C | 7615 | 6451 | 70 | 70 | 0.92% | 1.09% | 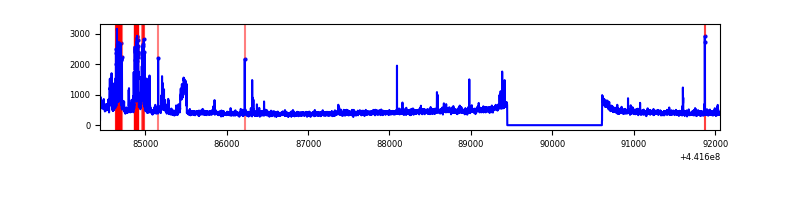 |
| D | 7615 | 6451 | 580 | 580 | 7.62% | 8.99% | 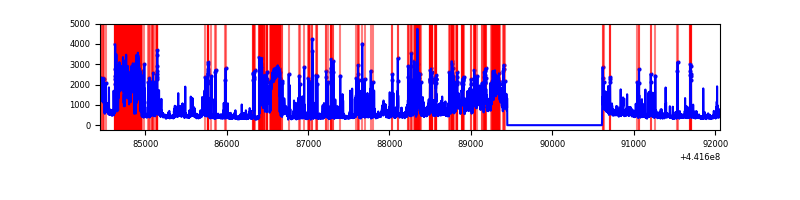 |
Top three noisy pixels from each quadrant. If the there are fewer than three noisy pixels in the level2.evt file, extra rows are filled as -1
| Pixel properties | Quadrant properties | ||||||
|---|---|---|---|---|---|---|---|
| Quadrant | DetID | PixID | Counts | Sigma | Mean | Median | Sigma |
| A | 10 | 83 | 1983735 | 13607.1 | 716 | 703 | 145.7 |
| A | 13 | 248 | 134909 | 920.89 | 716 | 703 | 145.7 |
| A | 10 | 248 | 38725 | 260.9 | 716 | 703 | 145.7 |
| B | 0 | 183 | 62348 | 444.86 | 721 | 701 | 138.6 |
| B | 0 | 219 | 24490 | 171.67 | 721 | 701 | 138.6 |
| B | 5 | 172 | 17662 | 122.4 | 721 | 701 | 138.6 |
| C | 15 | 252 | 374592 | 2321.9 | 697 | 702 | 161.0 |
| C | 2 | 14 | 51289 | 314.15 | 697 | 702 | 161.0 |
| C | 14 | 254 | 26972 | 163.14 | 697 | 702 | 161.0 |
| D | 1 | 52 | 1234273 | 7413.32 | 666 | 644 | 166.4 |
| D | 13 | 249 | 846932 | 5085.65 | 666 | 644 | 166.4 |
| D | 13 | 153 | 246736 | 1478.85 | 666 | 644 | 166.4 |
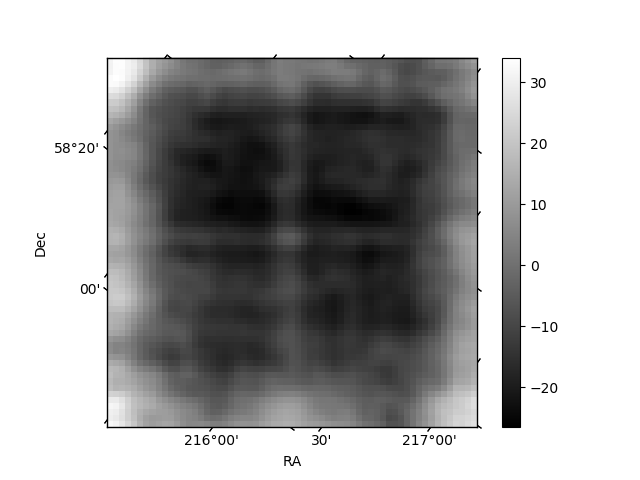
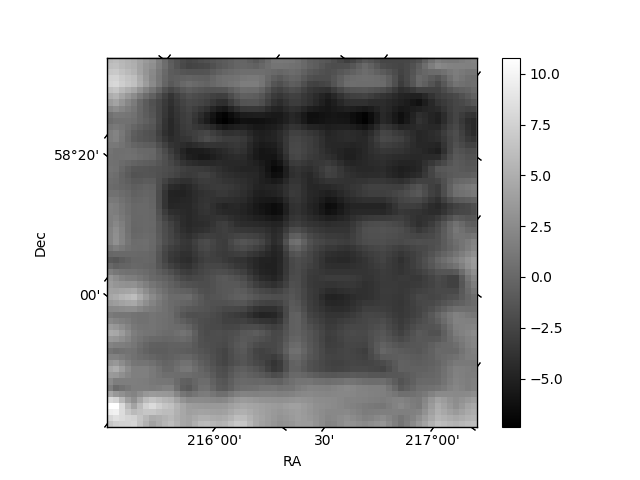
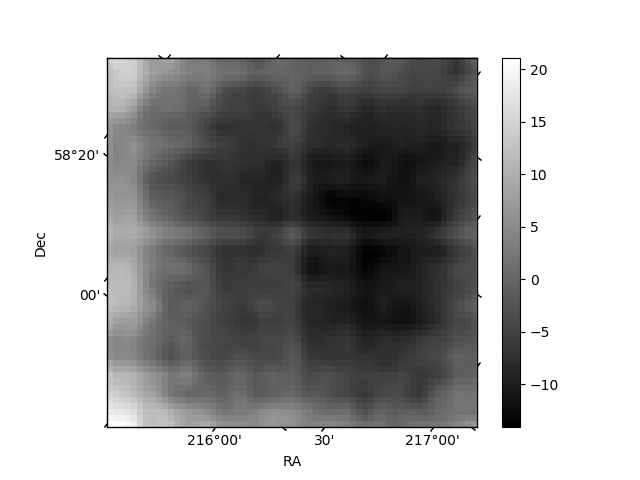
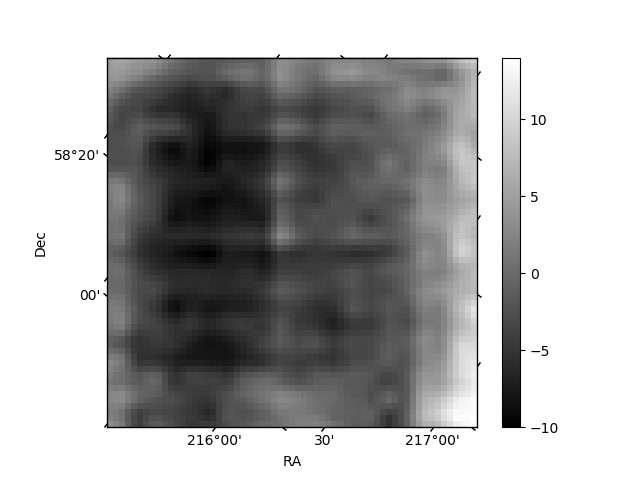
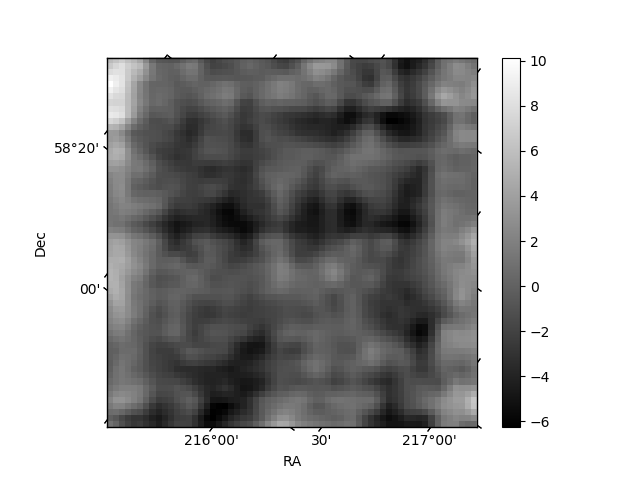
Histogram calculated using DETX and DETY for each event in the final _common_clean file
| Quadrant A | 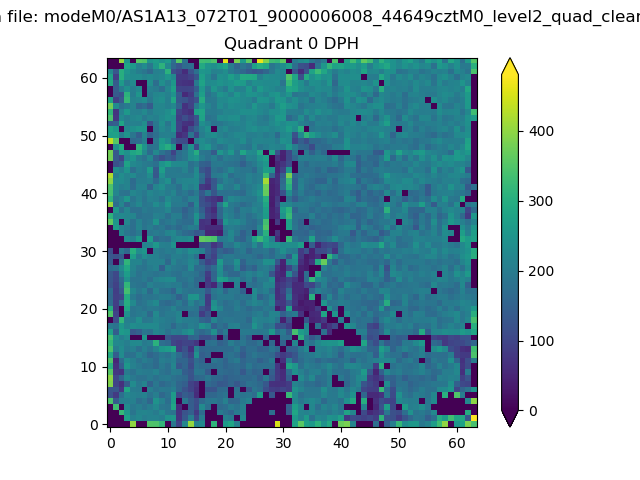 |
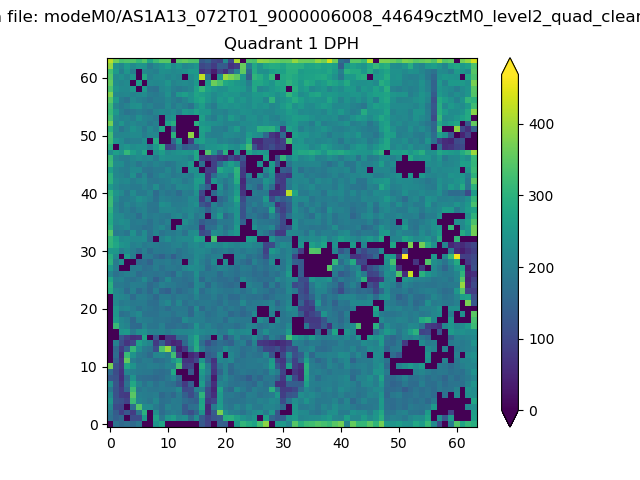 |
Quadrant B |
|---|---|---|---|
| Quadrant D | 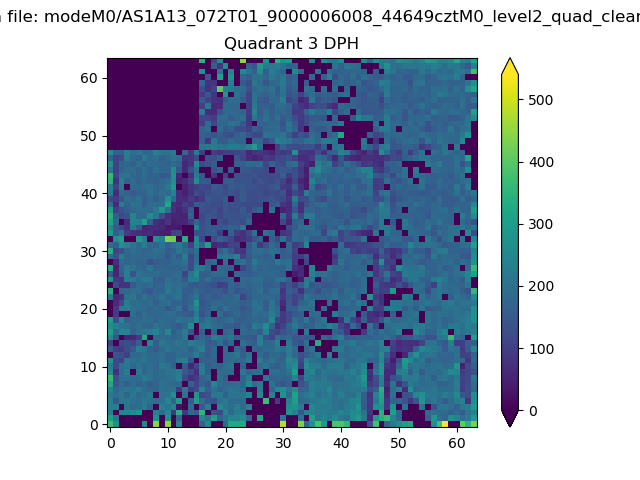 |
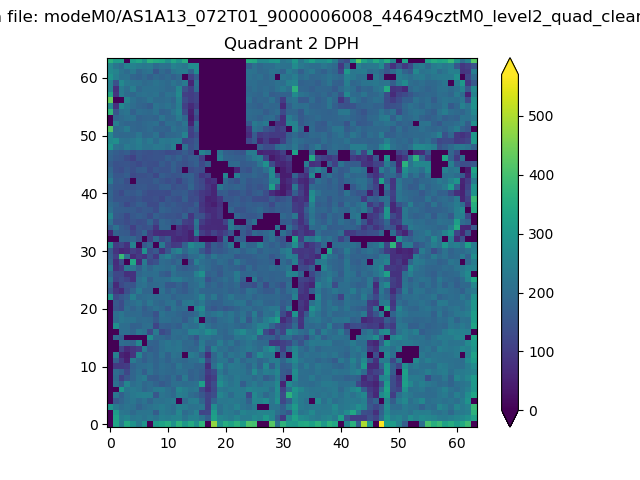 |
Quadrant C |
| Plot type | Count rate plots | Images |
|---|---|---|
| Comparison with Poisson distribution Blue bars denote a histogram of data divided into 1 sec bins. Red curve is a Poisson curve with rate = median count rate of data. |
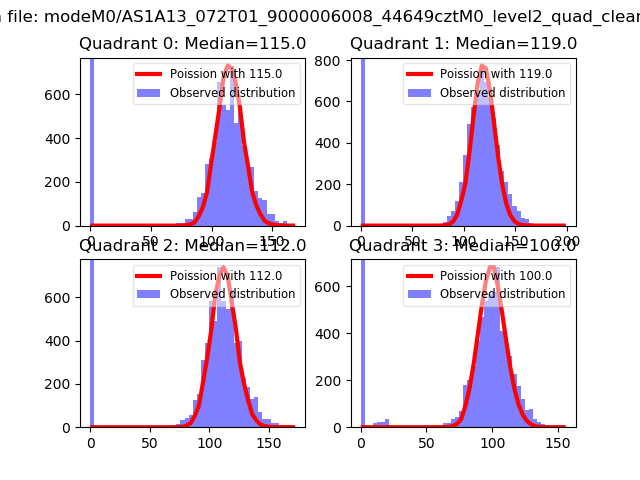 |
 |
| Quadrant-wise count rates Data is divided into 100 sec bins |
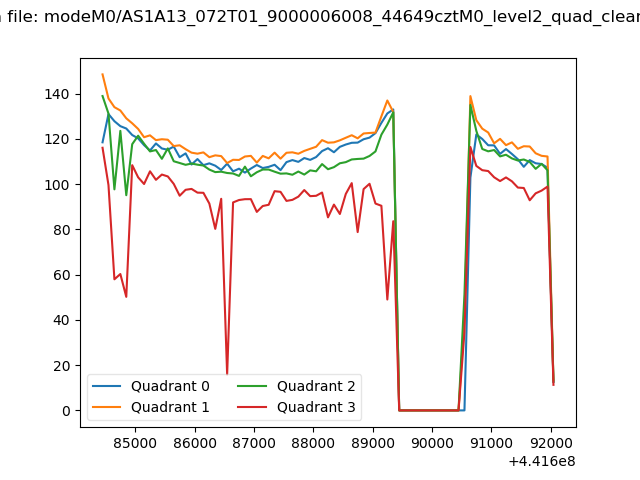 |
|
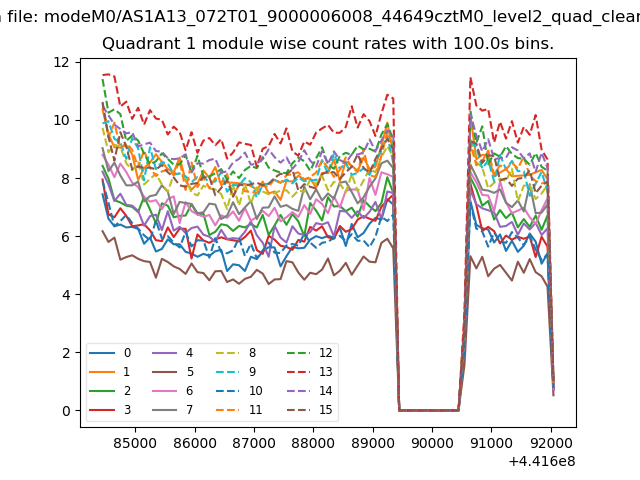
| Module-wise count rates for Quadrant A Data is divided into 100 sec bins |
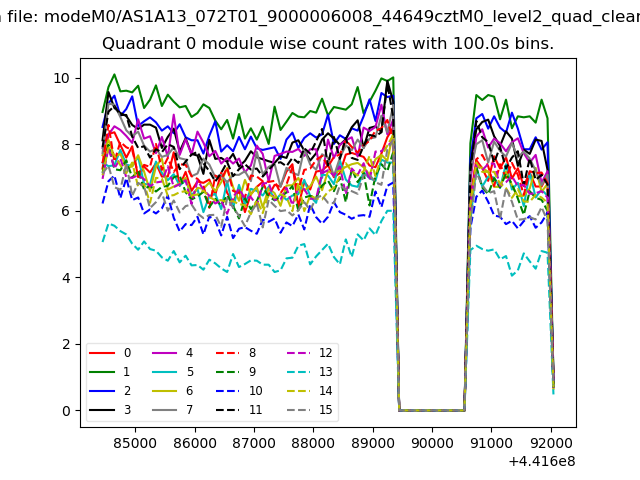 |
 |
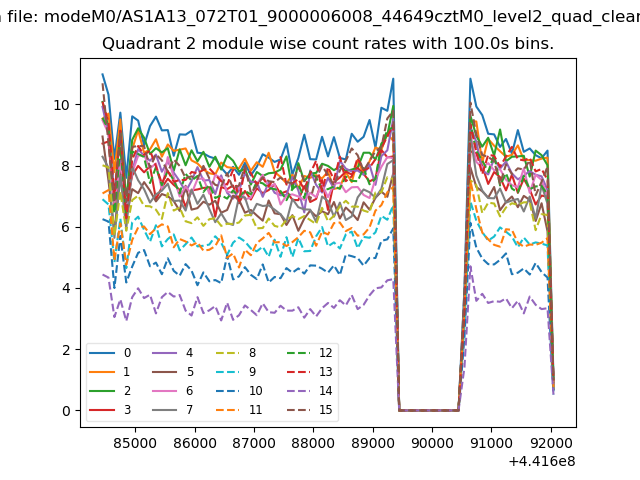
| Module-wise count rates for Quadrant B Data is divided into 100 sec bins |
 |
 |
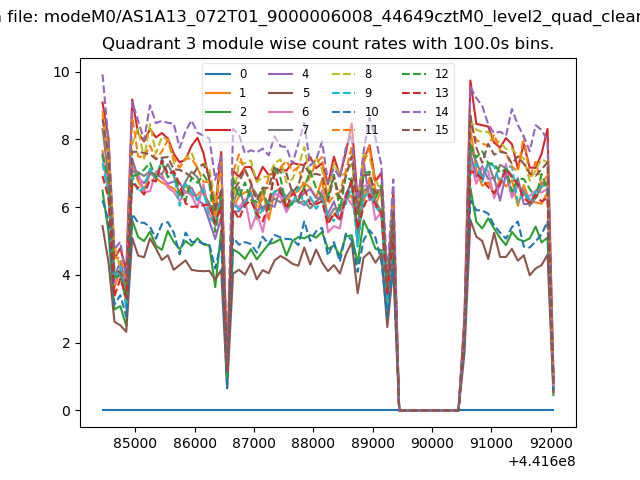
| Module-wise count rates for Quadrant C Data is divided into 100 sec bins |
 |
 |
| Module-wise count rates for Quadrant D Data is divided into 100 sec bins |
 |
 |
| Parameter | Plot |
|---|---|
| CZT HV Monitor | 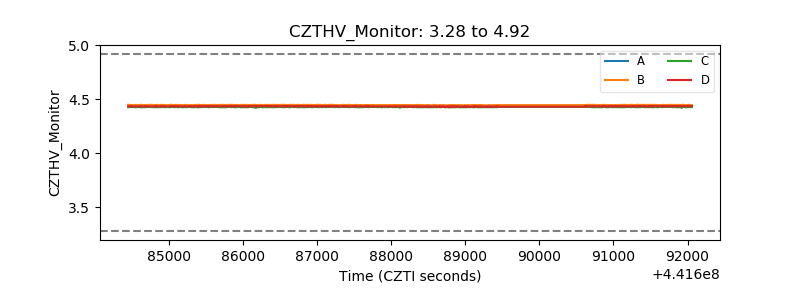 |
| D_VDD | 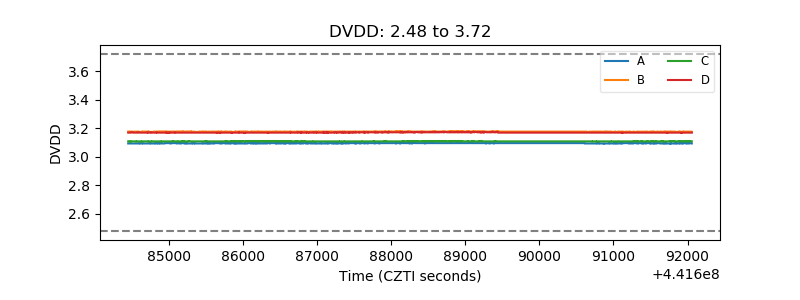 |
| Temperature 1 | 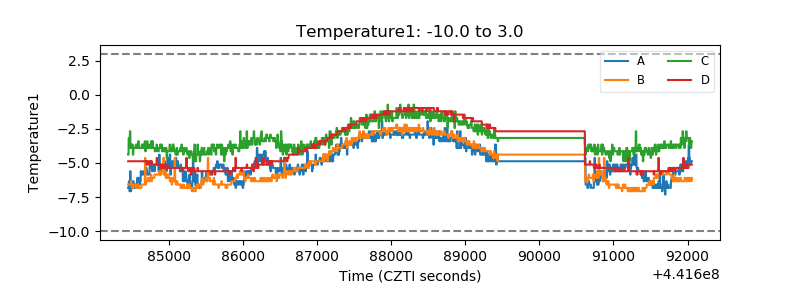 |
| Veto HV Monitor | 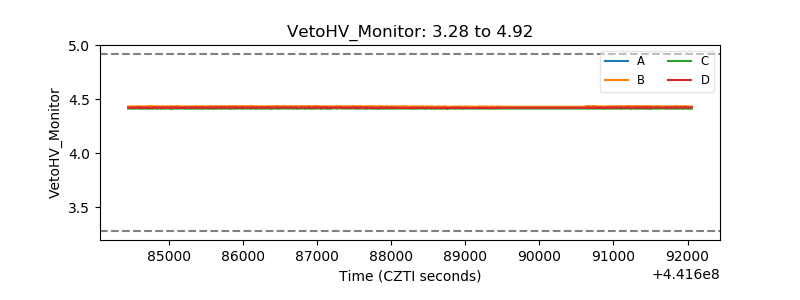 |
| Veto LLD | 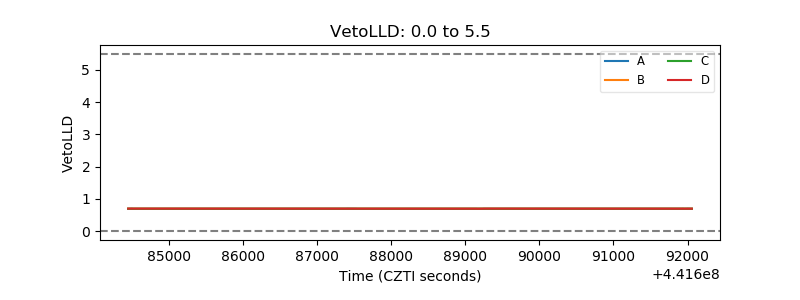 |
| Alpha Counter | 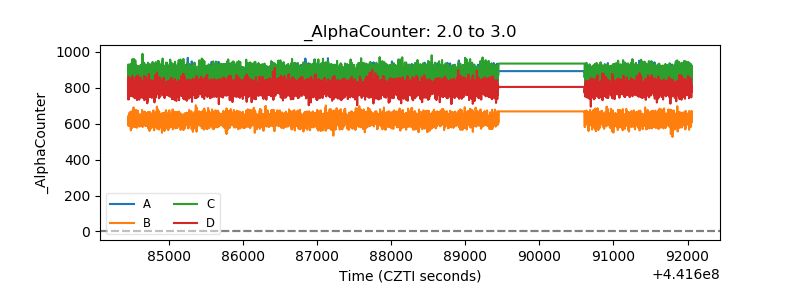 |
| _CPM_Rate | 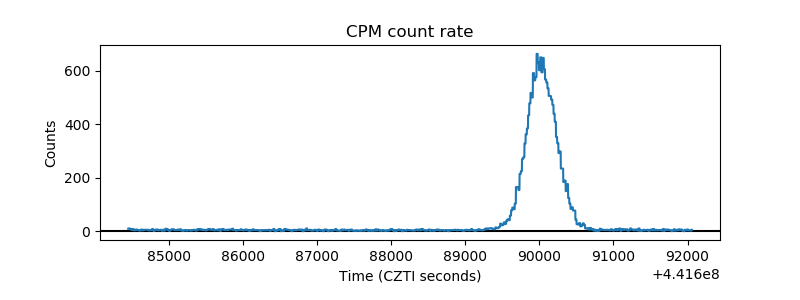 |
| CZT Counter | 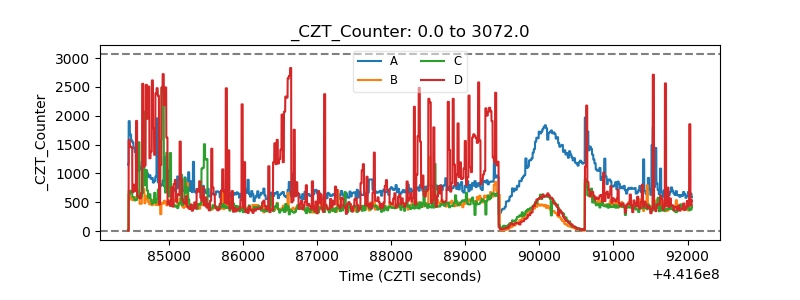 |
| +2.5 Volts monitor | 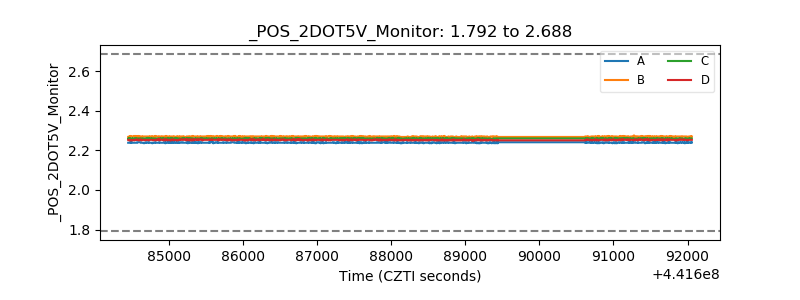 |
| +5 Volts monitor | 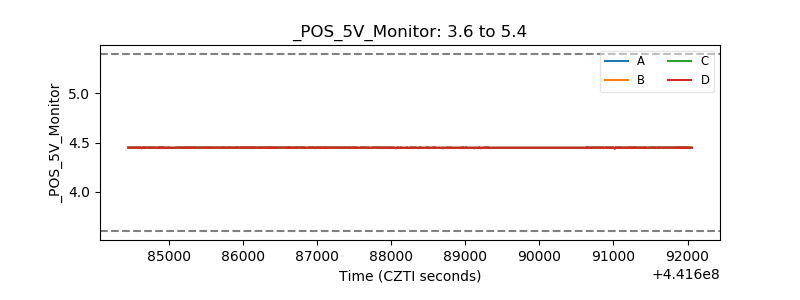 |
| _ROLL_ROT | 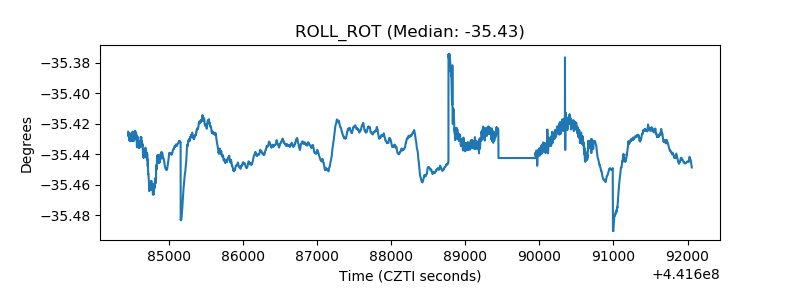 |
| _Roll_DEC | 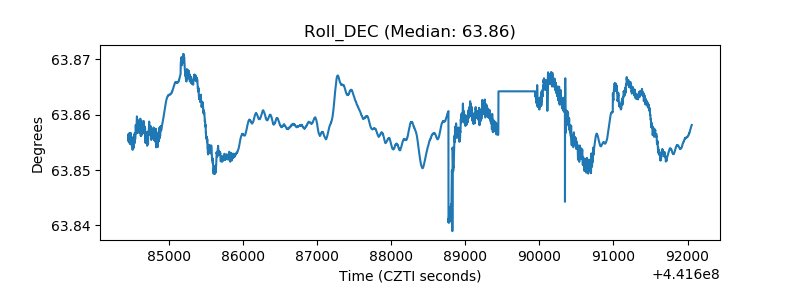 |
| _Roll_RA | 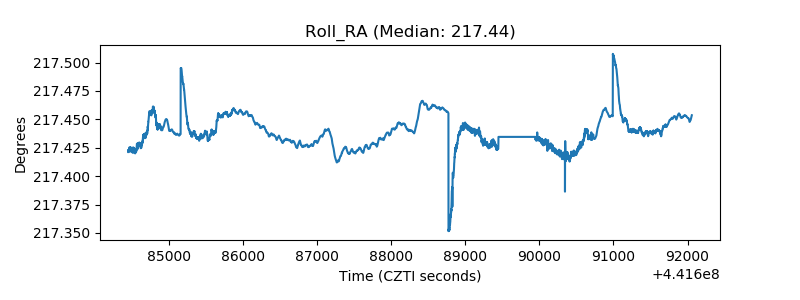 |
| Veto Counter | 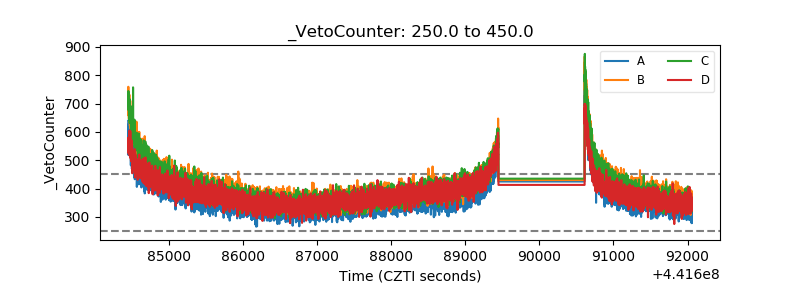 |