| Param | Original file | Final file |
|---|---|---|
| Filename | modeM0/AS1A13_072T01_9000006008_44650cztM0_level2.fits | modeM0/AS1A13_072T01_9000006008_44650cztM0_level2_quad_clean.evt |
| Size (bytes) | 483,485,760 | 110,007,360 |
| Size | 461.1 MB | 104.9 MB |
| Events in quadrant A | 5,558,006 | 734,597 |
| Events in quadrant B | 3,195,253 | 774,398 |
| Events in quadrant C | 3,031,016 | 731,469 |
| Events in quadrant D | 5,586,236 | 617,751 |
| Mode M0 | |||
|---|---|---|---|
| Quadrant | BADHDUFLAG | Total packets | Discarded packets |
| A | 0 | 21953 | 19 |
| B | 0 | 14332 | 3 |
| C | 0 | 14200 | 3 |
| D | 0 | 21395 | 12 |
| Mode SS | |||
|---|---|---|---|
| Quadrant | BADHDUFLAG | Total packets | Discarded packets |
| A | 0 | 138 | 0 |
| B | 0 | 138 | 0 |
| C | 0 | 138 | 0 |
| D | 0 | 138 | 0 |
| Mode M9 | |||
|---|---|---|---|
| Quadrant | BADHDUFLAG | Total packets | Discarded packets |
| A | 0 | 16 | 0 |
| B | 0 | 17 | 0 |
| C | 0 | 17 | 0 |
| D | 0 | 17 | 0 |
| Quadrant | Total seconds | Saturated seconds | Saturation percentage |
|---|---|---|---|
| A | 6777 | 257 | 3.792238% |
| B | 6781 | 84 | 1.238755% |
| C | 6780 | 23 | 0.339233% |
| D | 6780 | 670 | 9.882006% |
Noise dominated data is calculated using 1-second bins in cleaned event files. If a bin has >2000 counts, and if more than 50% of those come from <1% of pixels, then it is considered to be noise-dominated and hence unusable.
| Quadrant | # 1 sec bins | Bins with >0 counts | Bins with >2000 counts | High rate bins dominated by noise | Noise dominated (total time) | Noise dominated (detector-on time) | Marked lightcurve |
|---|---|---|---|---|---|---|---|
| A | 7777 | 6782 | 61 | 61 | 0.78% | 0.90% | 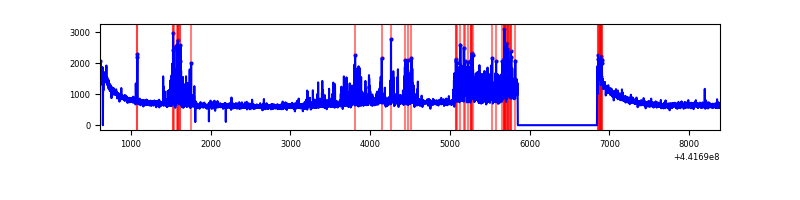 |
| B | 7777 | 6783 | 26 | 26 | 0.33% | 0.38% | 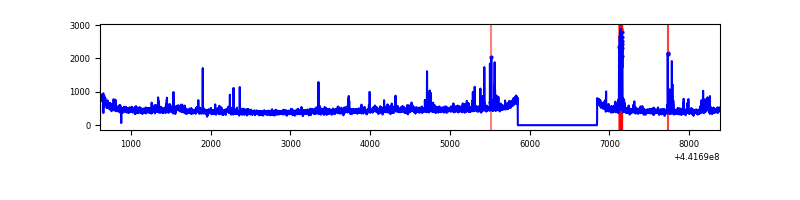 |
| C | 7777 | 6783 | 10 | 10 | 0.13% | 0.15% | 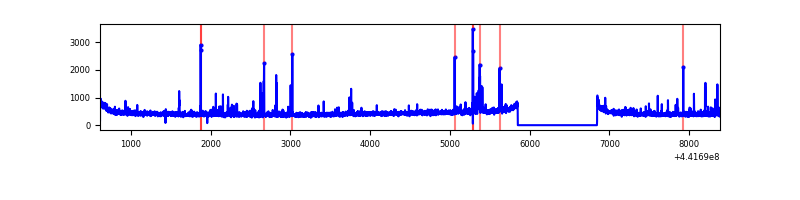 |
| D | 7777 | 6783 | 532 | 532 | 6.84% | 7.84% | 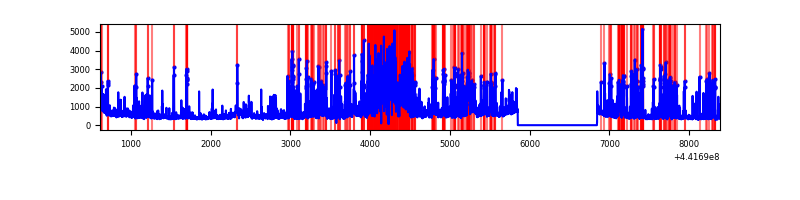 |
Top three noisy pixels from each quadrant. If the there are fewer than three noisy pixels in the level2.evt file, extra rows are filled as -1
| Pixel properties | Quadrant properties | ||||||
|---|---|---|---|---|---|---|---|
| Quadrant | DetID | PixID | Counts | Sigma | Mean | Median | Sigma |
| A | 10 | 83 | 2024682 | 13312.57 | 738 | 722 | 152.0 |
| A | 15 | 223 | 543472 | 3569.93 | 738 | 722 | 152.0 |
| A | 13 | 248 | 100649 | 657.27 | 738 | 722 | 152.0 |
| B | 0 | 219 | 91864 | 623.29 | 745 | 722 | 146.2 |
| B | 0 | 183 | 45941 | 309.24 | 745 | 722 | 146.2 |
| B | 0 | 189 | 37453 | 251.19 | 745 | 722 | 146.2 |
| C | 2 | 14 | 105907 | 621.47 | 725 | 729 | 169.2 |
| C | 14 | 254 | 54371 | 316.96 | 725 | 729 | 169.2 |
| C | 3 | 233 | 30244 | 174.4 | 725 | 729 | 169.2 |
| D | 1 | 52 | 1215857 | 7099.05 | 687 | 665 | 171.2 |
| D | 13 | 249 | 616445 | 3597.33 | 687 | 665 | 171.2 |
| D | 13 | 153 | 290262 | 1691.8 | 687 | 665 | 171.2 |
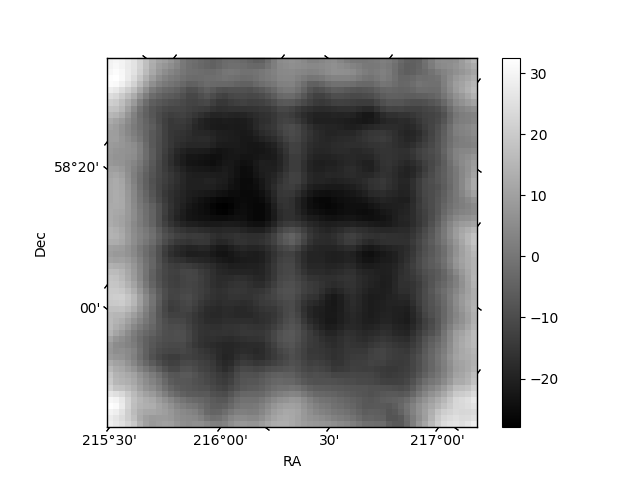
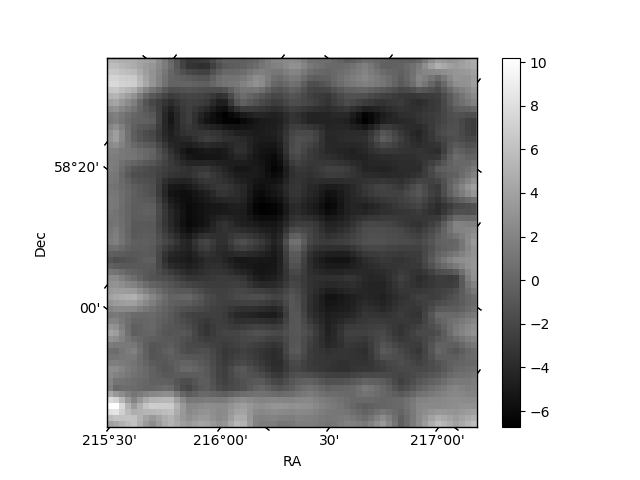
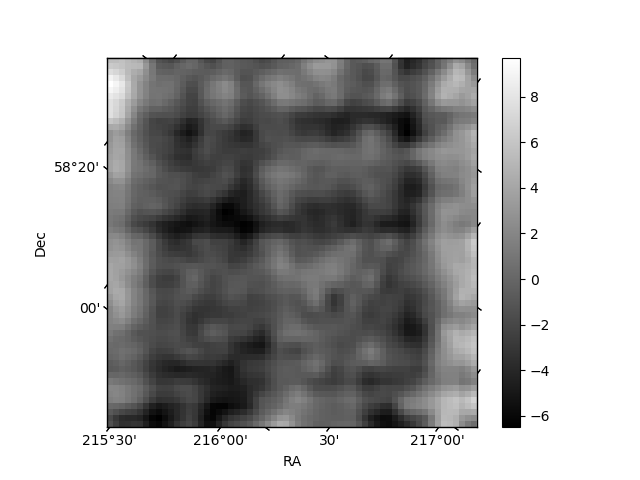
Histogram calculated using DETX and DETY for each event in the final _common_clean file
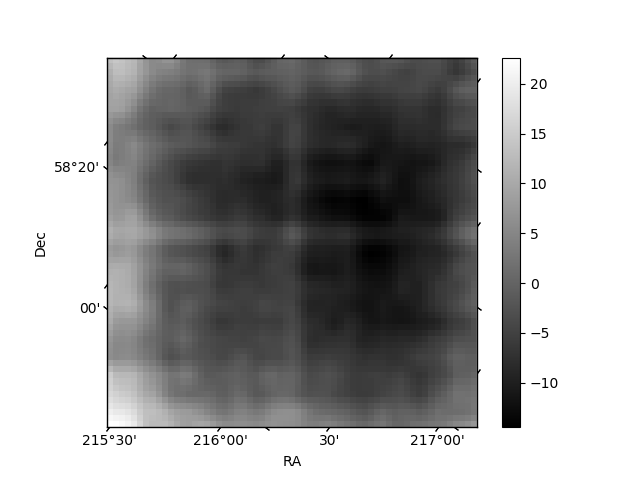
| Quadrant A | 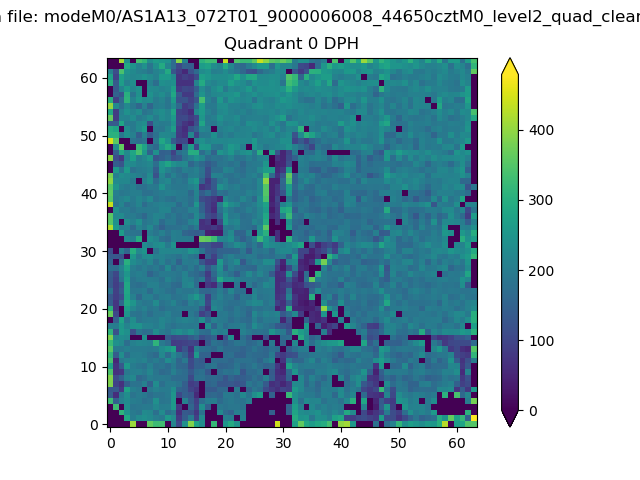 |
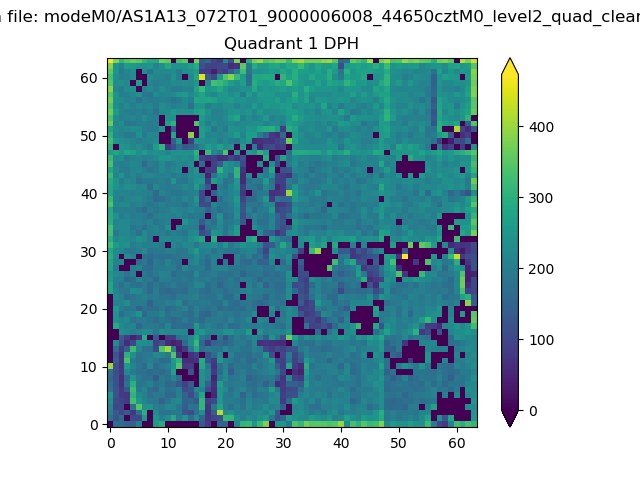 |
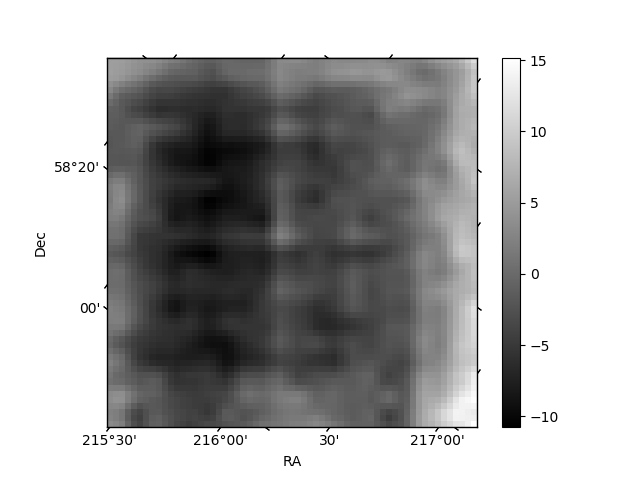
Quadrant B |
|---|---|---|---|
| Quadrant D | 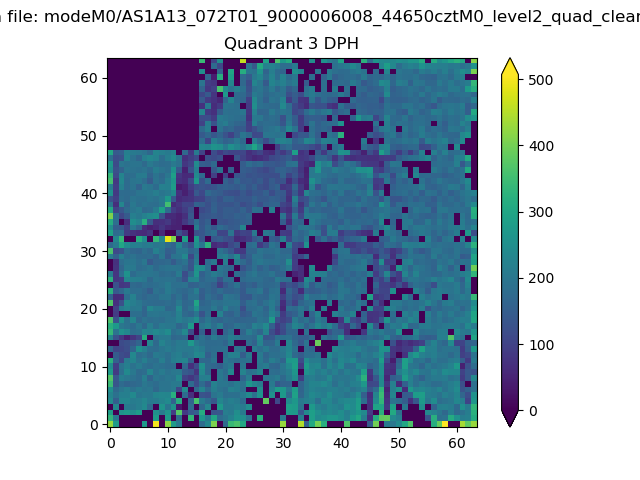 |
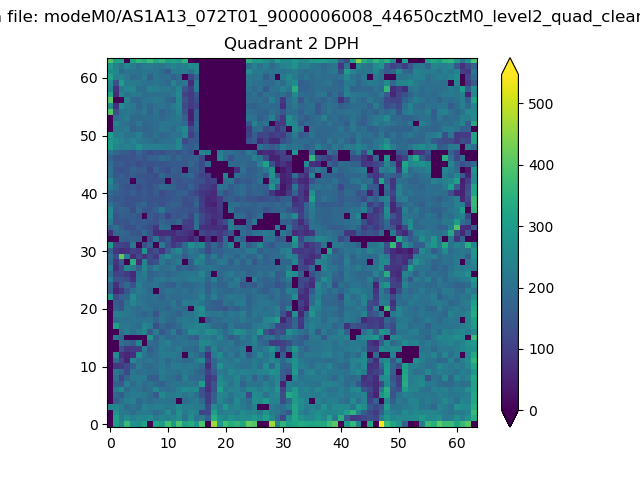 |
Quadrant C |
| Plot type | Count rate plots | Images |
|---|---|---|
| Comparison with Poisson distribution Blue bars denote a histogram of data divided into 1 sec bins. Red curve is a Poisson curve with rate = median count rate of data. |
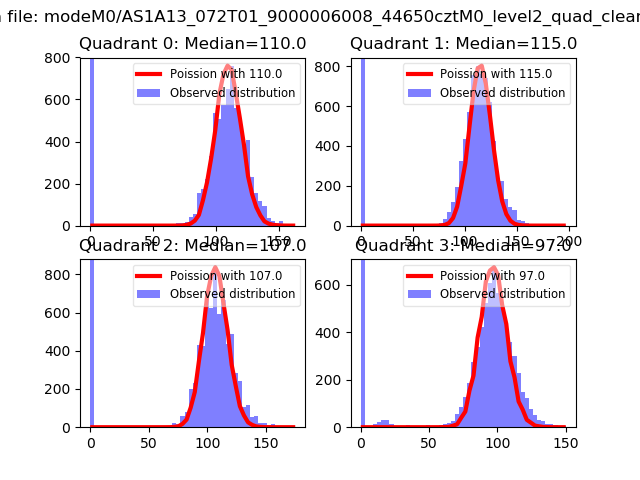 |
 |
| Quadrant-wise count rates Data is divided into 100 sec bins |
 |
|
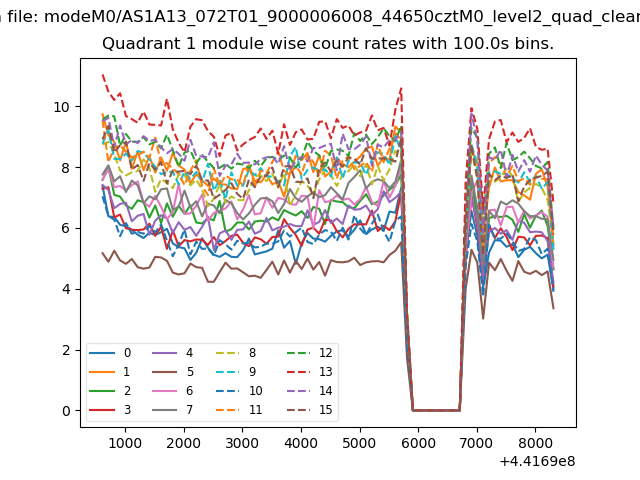
| Module-wise count rates for Quadrant A Data is divided into 100 sec bins |
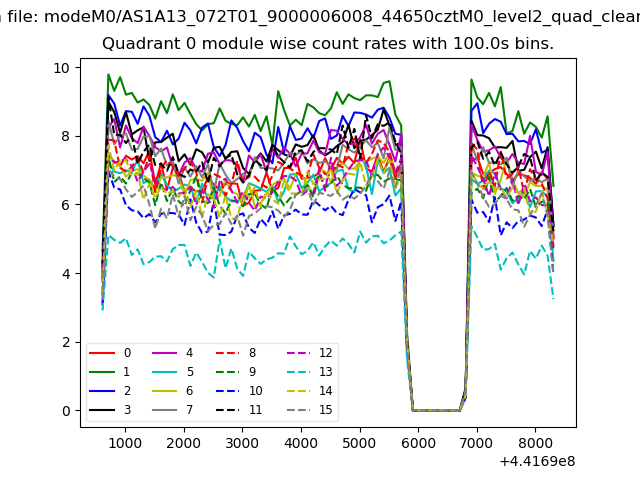 |
 |
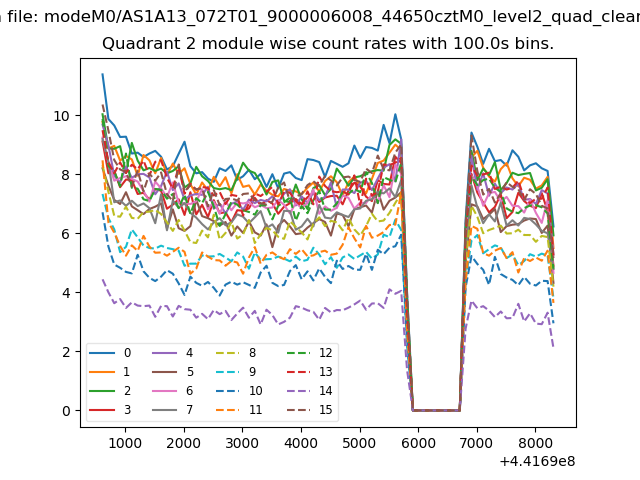
| Module-wise count rates for Quadrant B Data is divided into 100 sec bins |
 |
 |
| Module-wise count rates for Quadrant C Data is divided into 100 sec bins |
 |
 |
| Module-wise count rates for Quadrant D Data is divided into 100 sec bins |
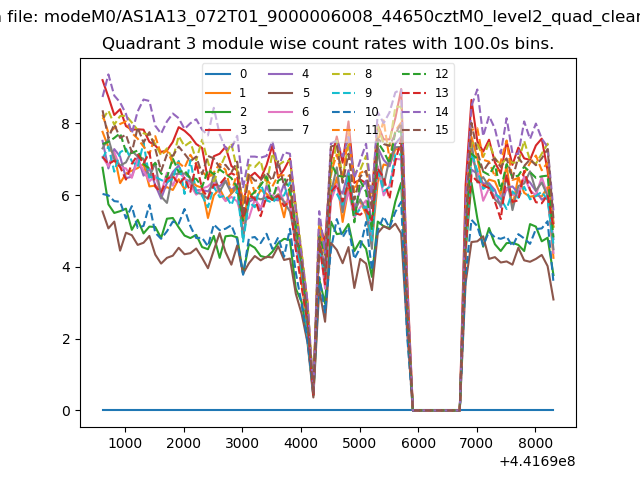 |
 |
| Parameter | Plot |
|---|---|
| CZT HV Monitor | 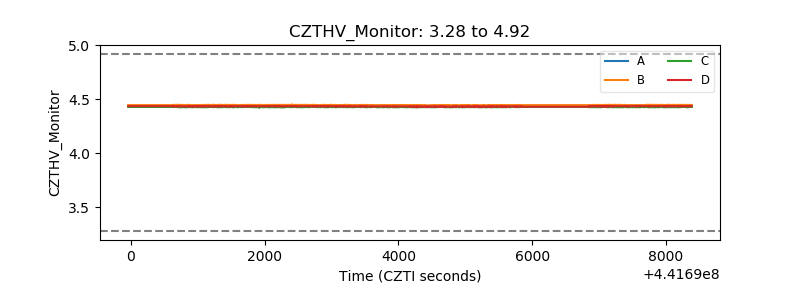 |
| D_VDD | 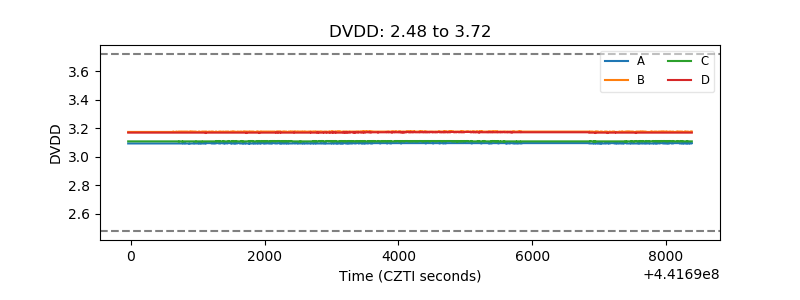 |
| Temperature 1 | 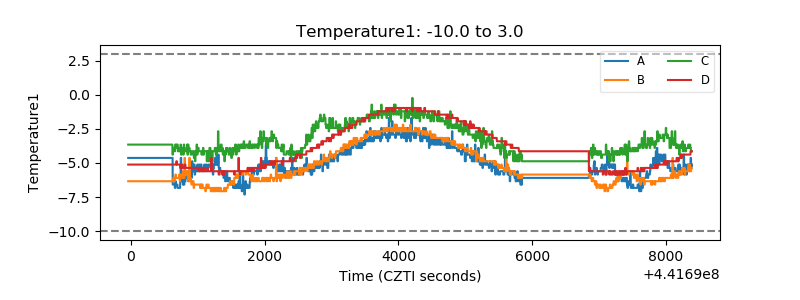 |
| Veto HV Monitor | 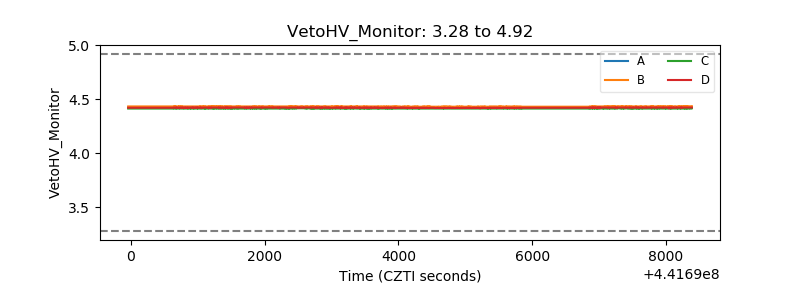 |
| Veto LLD | 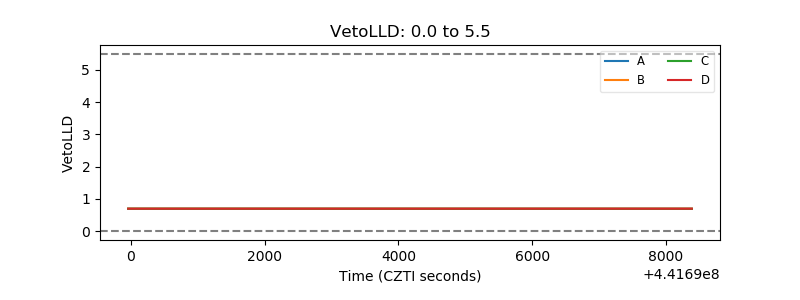 |
| Alpha Counter | 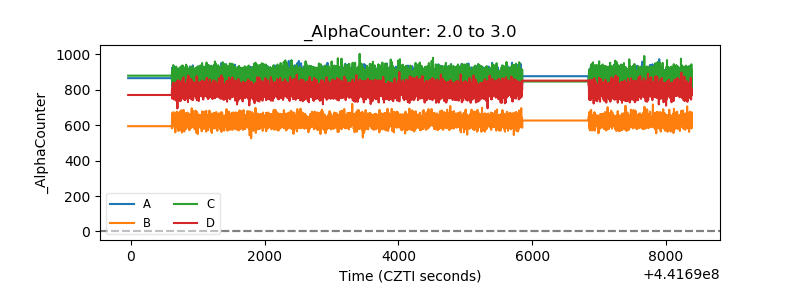 |
| _CPM_Rate | 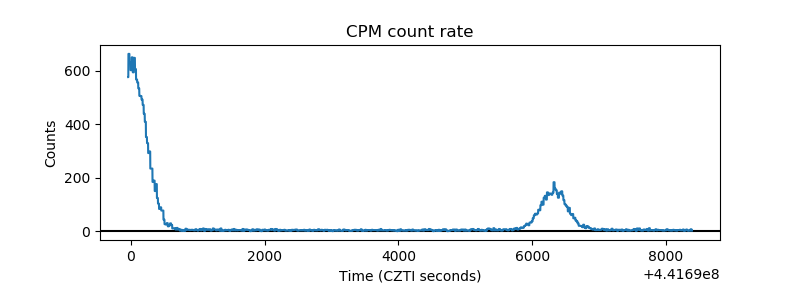 |
| CZT Counter | 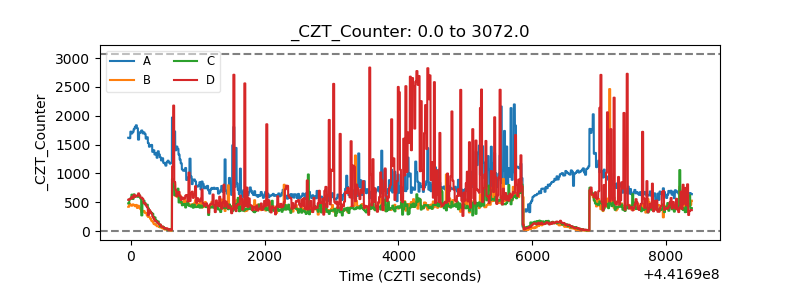 |
| +2.5 Volts monitor | 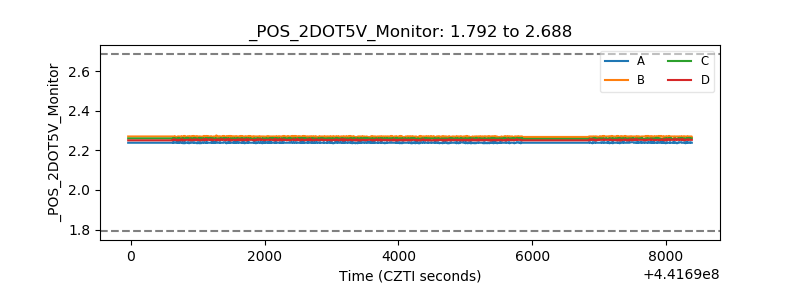 |
| +5 Volts monitor | 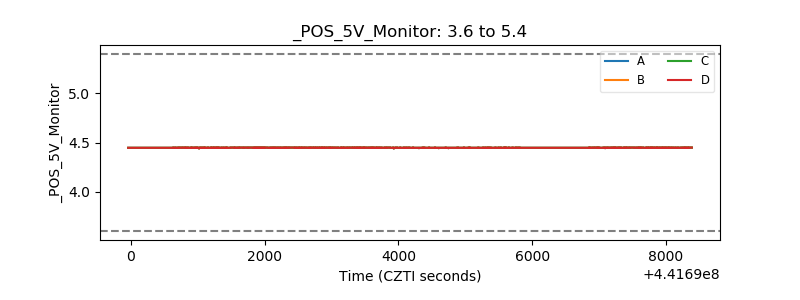 |
| _ROLL_ROT | 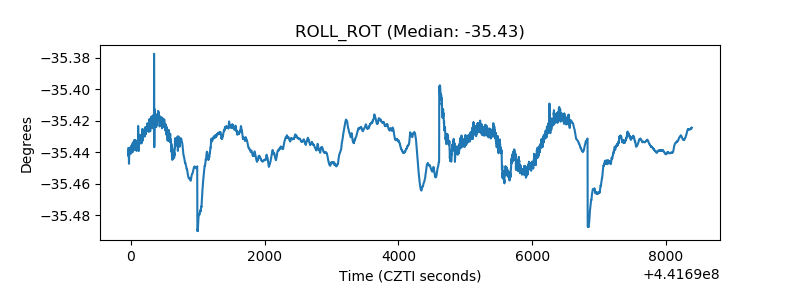 |
| _Roll_DEC | 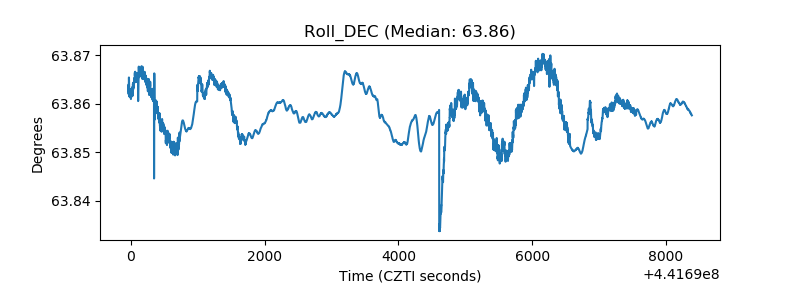 |
| _Roll_RA | 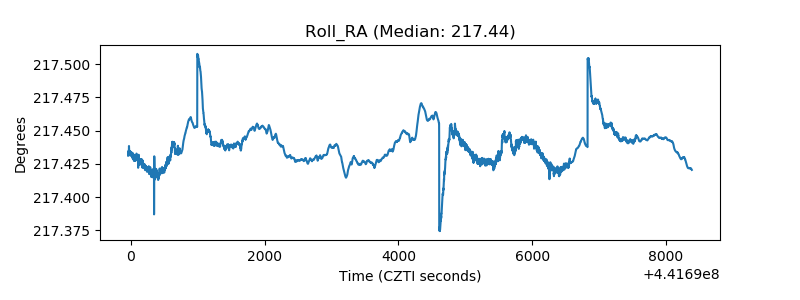 |
| Veto Counter | 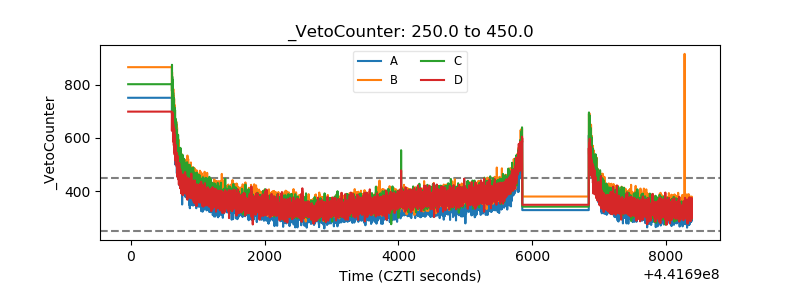 |