| Param | Original file | Final file |
|---|---|---|
| Filename | modeM0/AS1A13_072T01_9000006008_44651cztM0_level2.fits | modeM0/AS1A13_072T01_9000006008_44651cztM0_level2_quad_clean.evt |
| Size (bytes) | 435,130,560 | 107,441,280 |
| Size | 415.0 MB | 102.5 MB |
| Events in quadrant A | 4,916,292 | 712,170 |
| Events in quadrant B | 3,104,986 | 745,843 |
| Events in quadrant C | 3,081,350 | 703,288 |
| Events in quadrant D | 4,479,602 | 621,207 |
| Mode M0 | |||
|---|---|---|---|
| Quadrant | BADHDUFLAG | Total packets | Discarded packets |
| A | 0 | 20230 | 1 |
| B | 0 | 14172 | 1 |
| C | 0 | 14359 | 1 |
| D | 0 | 18211 | 1 |
| Mode SS | |||
|---|---|---|---|
| Quadrant | BADHDUFLAG | Total packets | Discarded packets |
| A | 0 | 138 | 0 |
| B | 0 | 138 | 0 |
| C | 0 | 138 | 0 |
| D | 0 | 138 | 0 |
| Mode M9 | |||
|---|---|---|---|
| Quadrant | BADHDUFLAG | Total packets | Discarded packets |
| A | 0 | 5 | 0 |
| B | 0 | 5 | 0 |
| C | 0 | 5 | 0 |
| D | 0 | 5 | 0 |
| Quadrant | Total seconds | Saturated seconds | Saturation percentage |
|---|---|---|---|
| A | 6750 | 161 | 2.385185% |
| B | 6751 | 97 | 1.436824% |
| C | 6751 | 26 | 0.385128% |
| D | 6751 | 365 | 5.406606% |
Noise dominated data is calculated using 1-second bins in cleaned event files. If a bin has >2000 counts, and if more than 50% of those come from <1% of pixels, then it is considered to be noise-dominated and hence unusable.
| Quadrant | # 1 sec bins | Bins with >0 counts | Bins with >2000 counts | High rate bins dominated by noise | Noise dominated (total time) | Noise dominated (detector-on time) | Marked lightcurve |
|---|---|---|---|---|---|---|---|
| A | 7305 | 6751 | 1 | 1 | 0.01% | 0.01% | 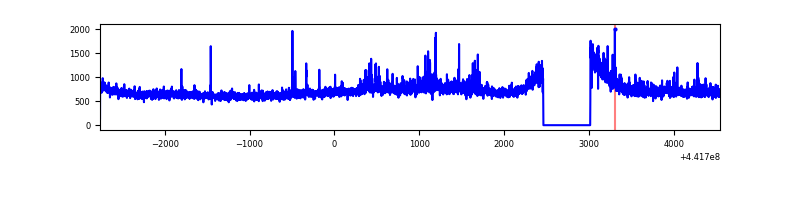 |
| B | 7306 | 6752 | 16 | 16 | 0.22% | 0.24% | 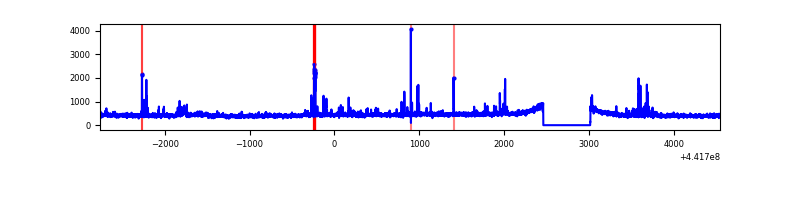 |
| C | 7306 | 6752 | 11 | 11 | 0.15% | 0.16% | 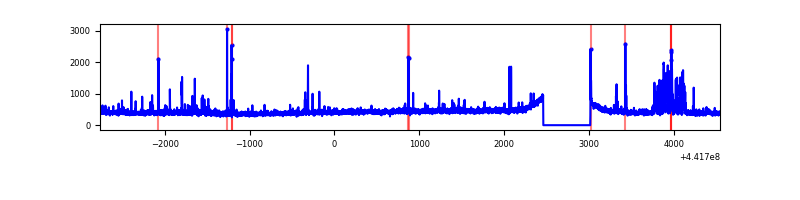 |
| D | 7306 | 6752 | 291 | 291 | 3.98% | 4.31% | 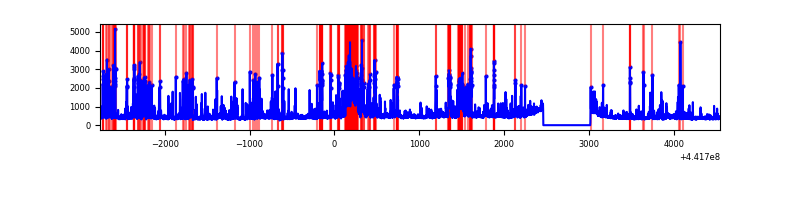 |
Top three noisy pixels from each quadrant. If the there are fewer than three noisy pixels in the level2.evt file, extra rows are filled as -1
| Pixel properties | Quadrant properties | ||||||
|---|---|---|---|---|---|---|---|
| Quadrant | DetID | PixID | Counts | Sigma | Mean | Median | Sigma |
| A | 10 | 83 | 1785808 | 11694.54 | 732 | 715 | 152.6 |
| A | 15 | 223 | 235825 | 1540.26 | 732 | 715 | 152.6 |
| A | 10 | 248 | 32717 | 209.65 | 732 | 715 | 152.6 |
| B | 0 | 189 | 83342 | 573.26 | 732 | 710 | 144.1 |
| B | 0 | 246 | 31699 | 214.99 | 732 | 710 | 144.1 |
| B | 5 | 172 | 24150 | 162.62 | 732 | 710 | 144.1 |
| C | 12 | 2 | 162430 | 962.33 | 714 | 718 | 168.0 |
| C | 14 | 254 | 70138 | 413.11 | 714 | 718 | 168.0 |
| C | 2 | 14 | 54760 | 321.6 | 714 | 718 | 168.0 |
| D | 13 | 249 | 596626 | 3402.27 | 698 | 676 | 175.2 |
| D | 2 | 249 | 312730 | 1781.51 | 698 | 676 | 175.2 |
| D | 1 | 52 | 191035 | 1086.76 | 698 | 676 | 175.2 |
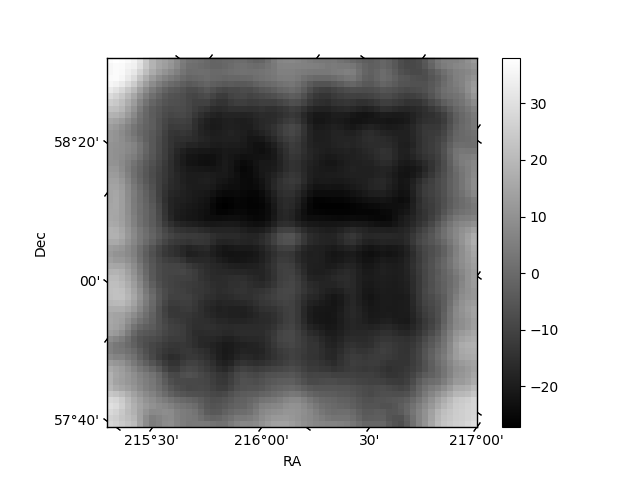
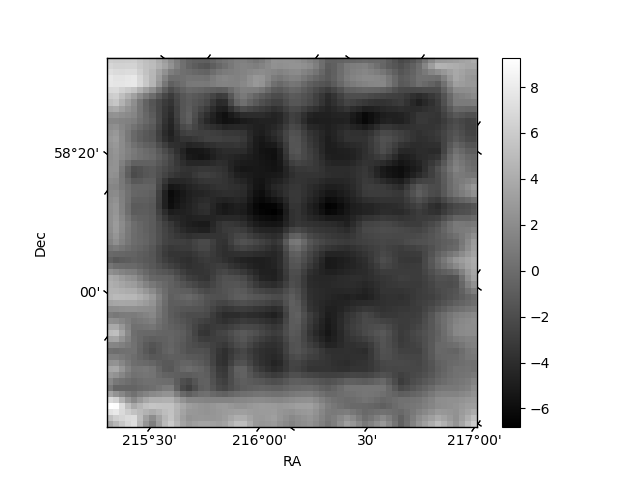
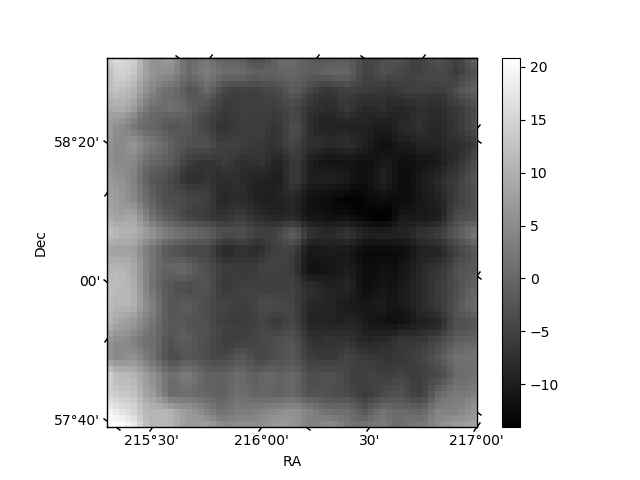
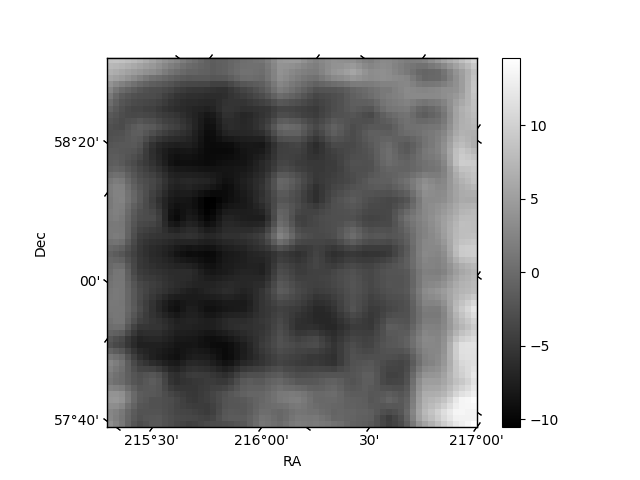
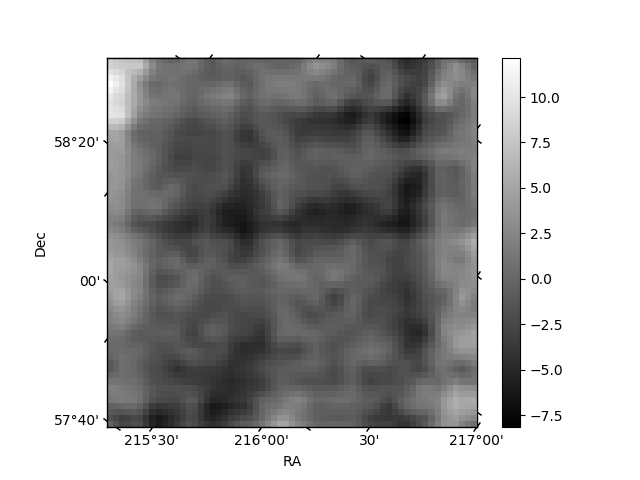
Histogram calculated using DETX and DETY for each event in the final _common_clean file
| Quadrant A | 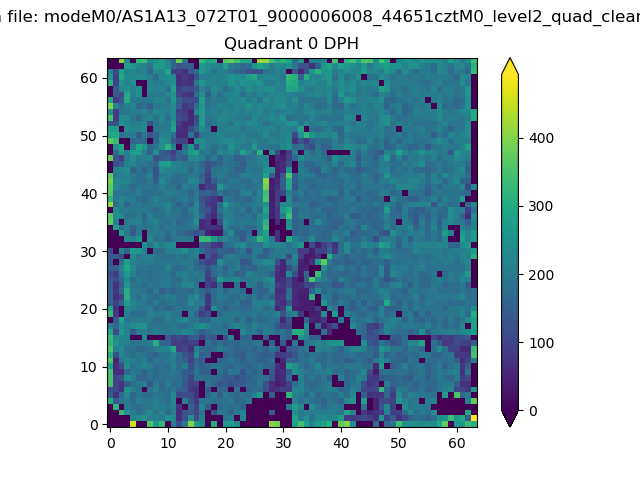 |
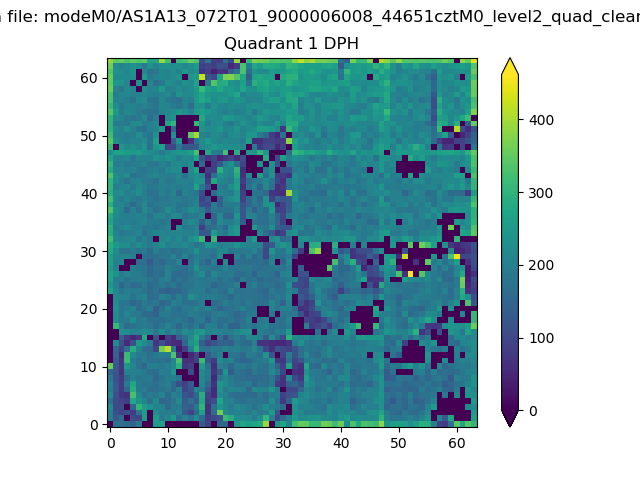 |
Quadrant B |
|---|---|---|---|
| Quadrant D | 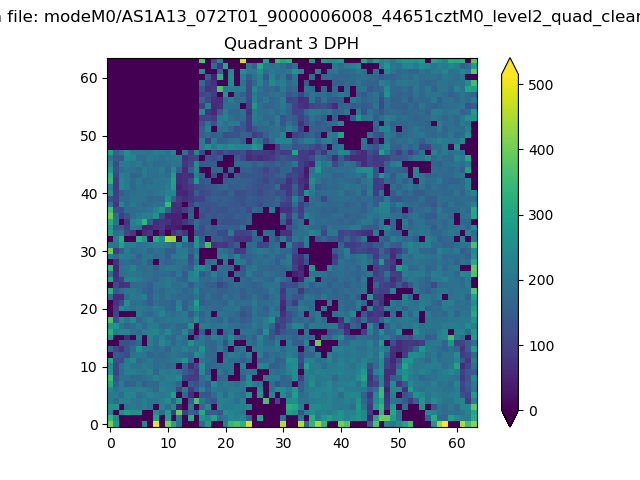 |
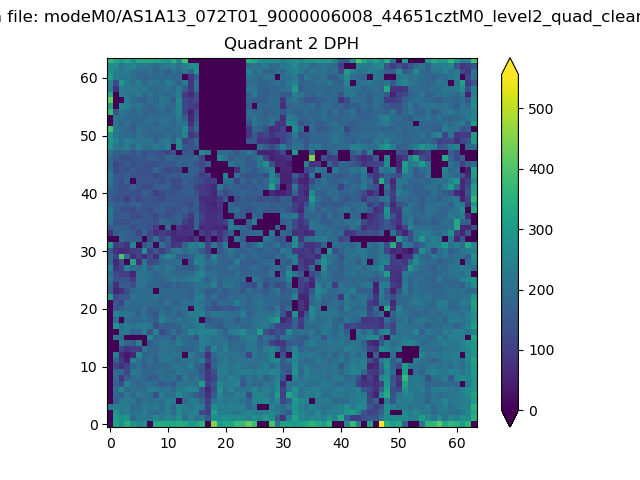 |
Quadrant C |
| Plot type | Count rate plots | Images |
|---|---|---|
| Comparison with Poisson distribution Blue bars denote a histogram of data divided into 1 sec bins. Red curve is a Poisson curve with rate = median count rate of data. |
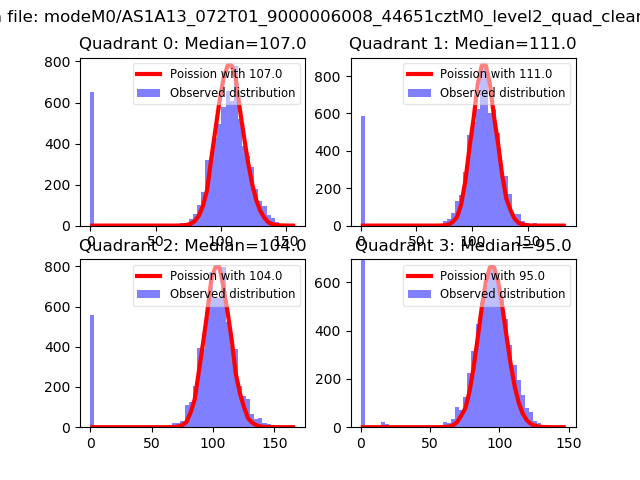 |
 |
| Quadrant-wise count rates Data is divided into 100 sec bins |
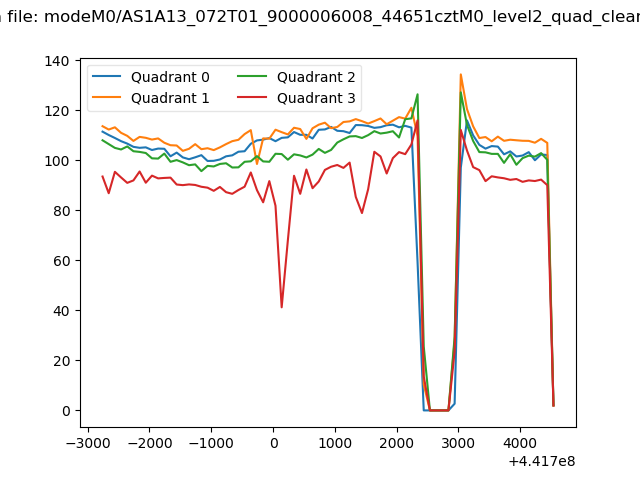 |
|
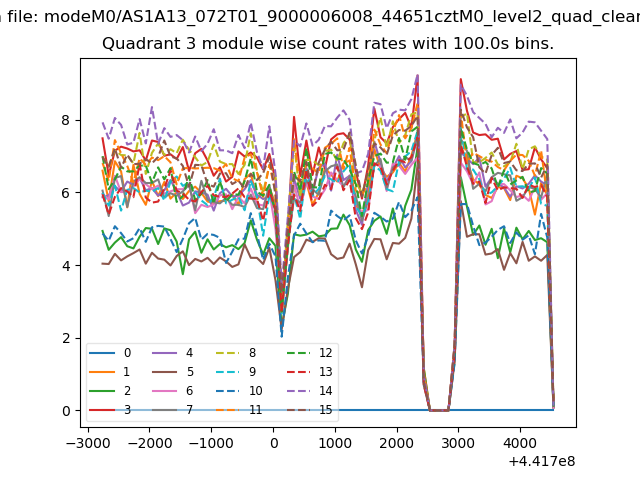
| Module-wise count rates for Quadrant A Data is divided into 100 sec bins |
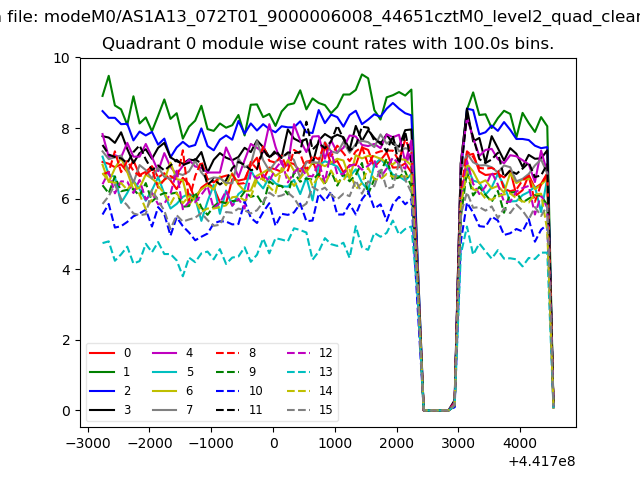 |
 |
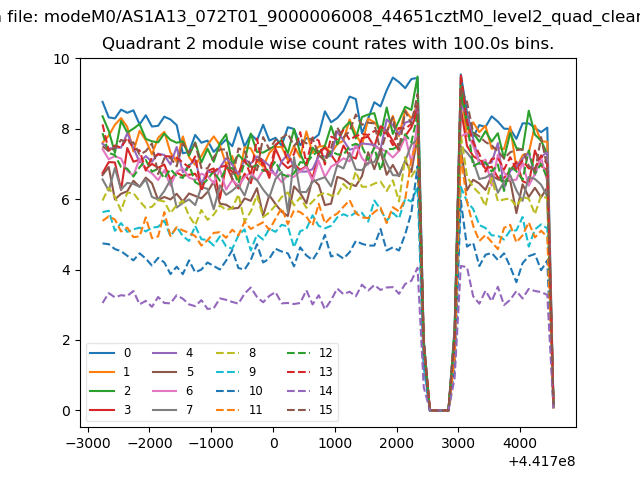
| Module-wise count rates for Quadrant B Data is divided into 100 sec bins |
 |
 |
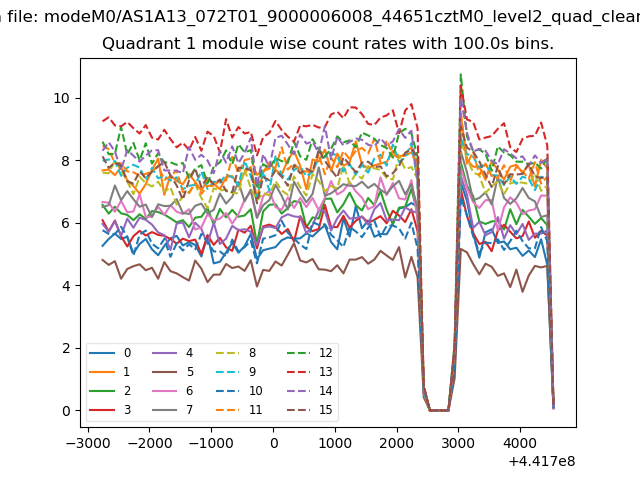
| Module-wise count rates for Quadrant C Data is divided into 100 sec bins |
 |
 |
| Module-wise count rates for Quadrant D Data is divided into 100 sec bins |
 |
 |
| Parameter | Plot |
|---|---|
| CZT HV Monitor | 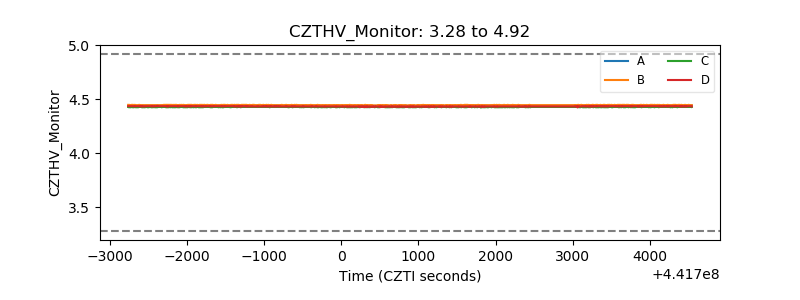 |
| D_VDD | 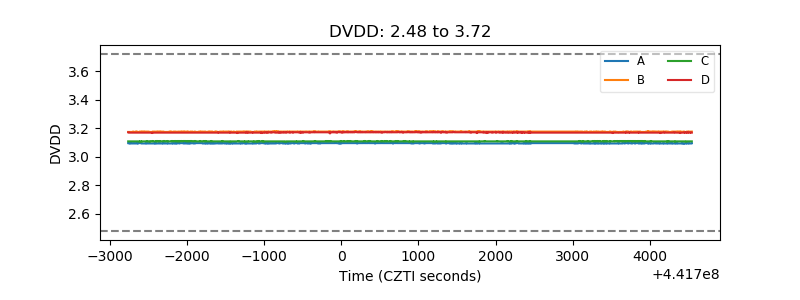 |
| Temperature 1 | 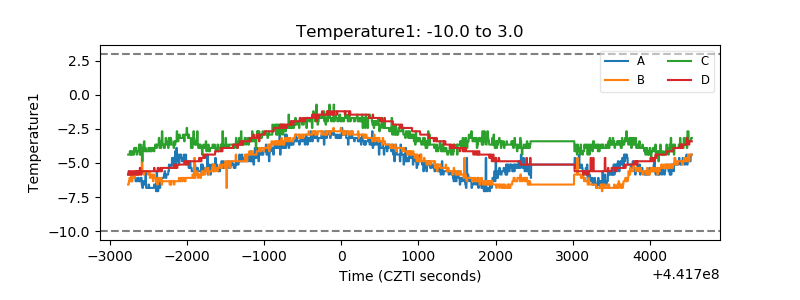 |
| Veto HV Monitor | 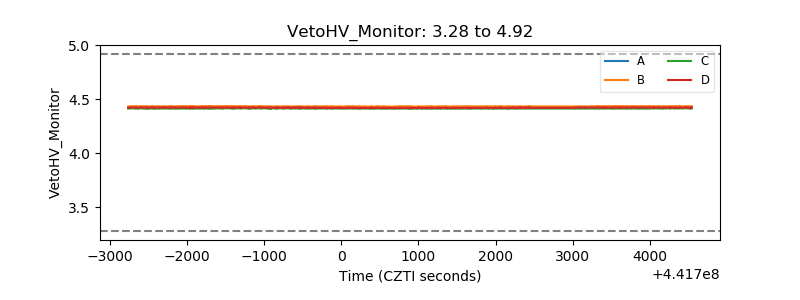 |
| Veto LLD | 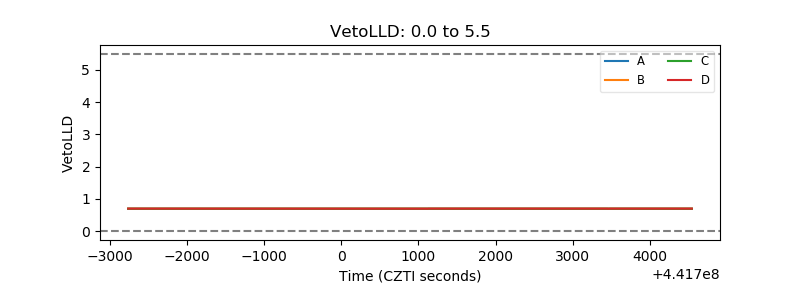 |
| Alpha Counter | 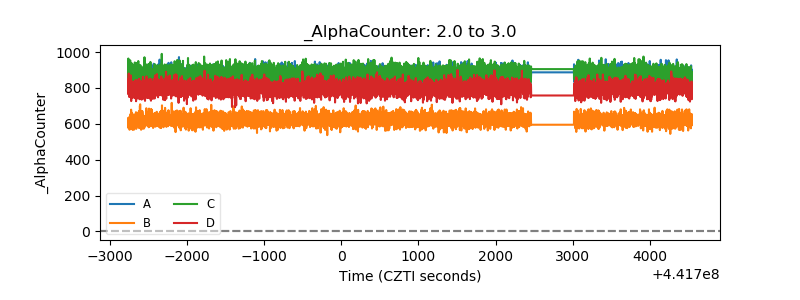 |
| _CPM_Rate | 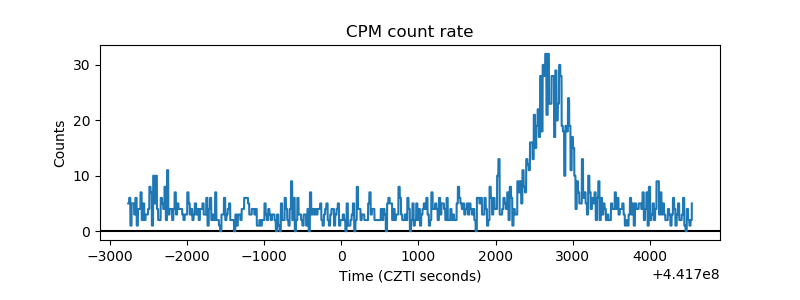 |
| CZT Counter | 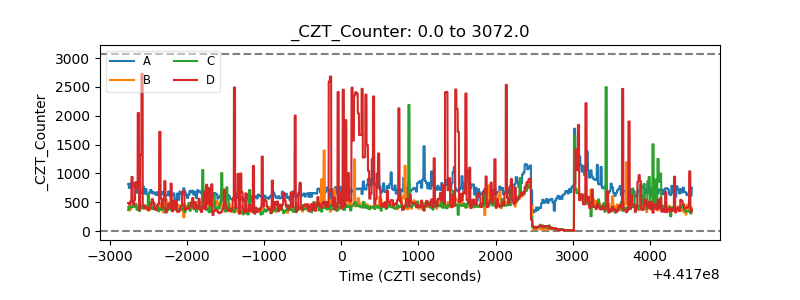 |
| +2.5 Volts monitor | 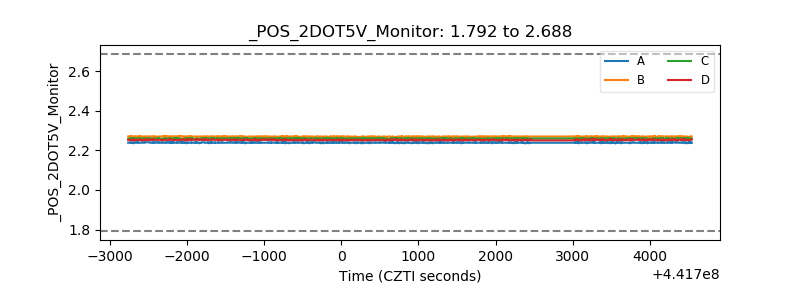 |
| +5 Volts monitor | 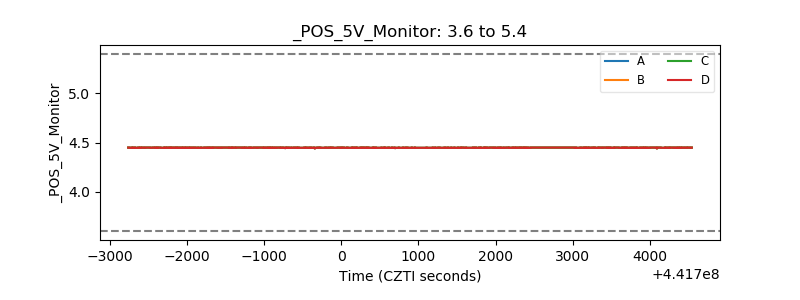 |
| _ROLL_ROT | 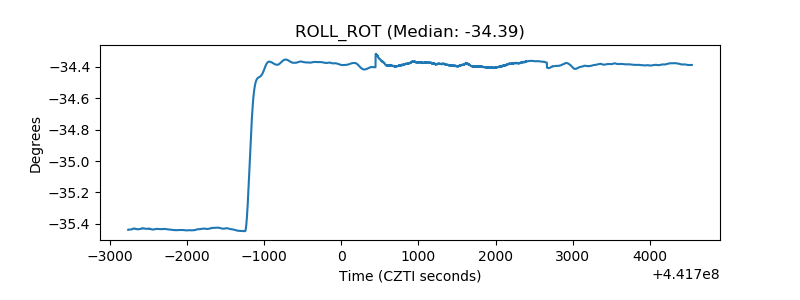 |
| _Roll_DEC | 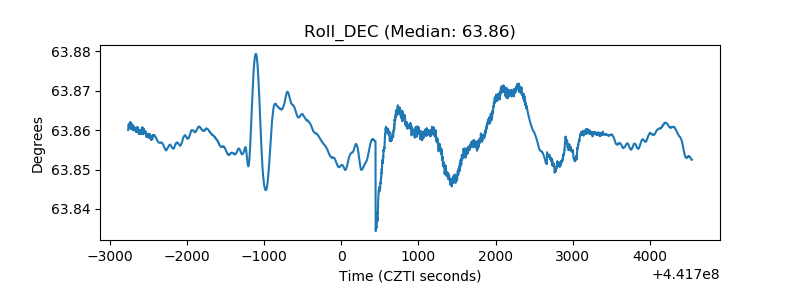 |
| _Roll_RA | 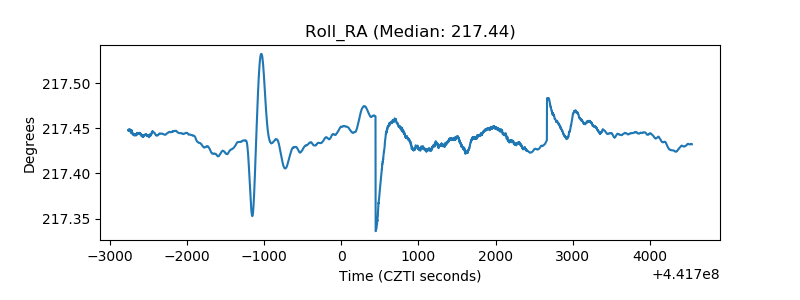 |
| Veto Counter | 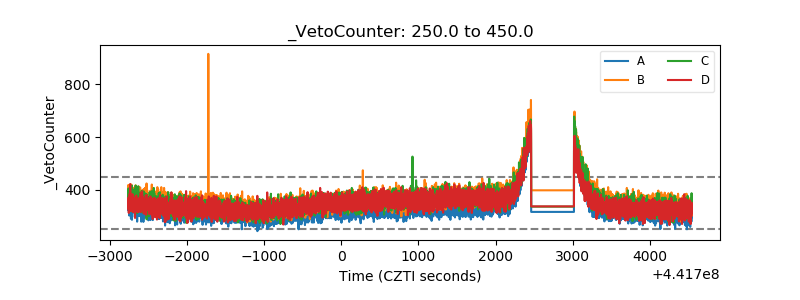 |