| Param | Original file | Final file |
|---|---|---|
| Filename | modeM0/AS1A13_072T01_9000006008_44652cztM0_level2.fits | modeM0/AS1A13_072T01_9000006008_44652cztM0_level2_quad_clean.evt |
| Size (bytes) | 513,259,200 | 123,157,440 |
| Size | 489.5 MB | 117.5 MB |
| Events in quadrant A | 6,224,878 | 820,164 |
| Events in quadrant B | 3,493,553 | 854,815 |
| Events in quadrant C | 3,569,068 | 804,743 |
| Events in quadrant D | 5,109,480 | 710,183 |
| Mode M0 | |||
|---|---|---|---|
| Quadrant | BADHDUFLAG | Total packets | Discarded packets |
| A | 0 | 24792 | 0 |
| B | 0 | 16132 | 0 |
| C | 0 | 16469 | 0 |
| D | 0 | 20833 | 0 |
| Mode SS | |||
|---|---|---|---|
| Quadrant | BADHDUFLAG | Total packets | Discarded packets |
| A | 0 | 154 | 0 |
| B | 0 | 154 | 0 |
| C | 0 | 154 | 0 |
| D | 0 | 154 | 0 |
| Quadrant | Total seconds | Saturated seconds | Saturation percentage |
|---|---|---|---|
| A | 7756 | 173 | 2.230531% |
| B | 7756 | 42 | 0.541516% |
| C | 7756 | 13 | 0.167612% |
| D | 7756 | 381 | 4.912326% |
Noise dominated data is calculated using 1-second bins in cleaned event files. If a bin has >2000 counts, and if more than 50% of those come from <1% of pixels, then it is considered to be noise-dominated and hence unusable.
| Quadrant | # 1 sec bins | Bins with >0 counts | Bins with >2000 counts | High rate bins dominated by noise | Noise dominated (total time) | Noise dominated (detector-on time) | Marked lightcurve |
|---|---|---|---|---|---|---|---|
| A | 7756 | 7756 | 69 | 69 | 0.89% | 0.89% | 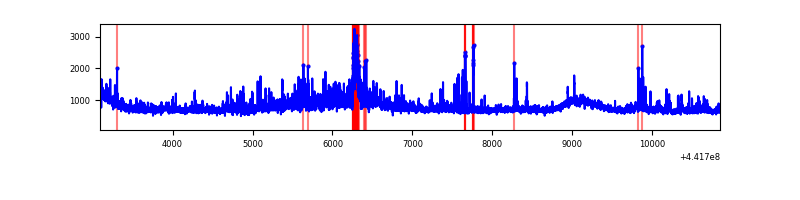 |
| B | 7756 | 7756 | 1 | 1 | 0.01% | 0.01% | 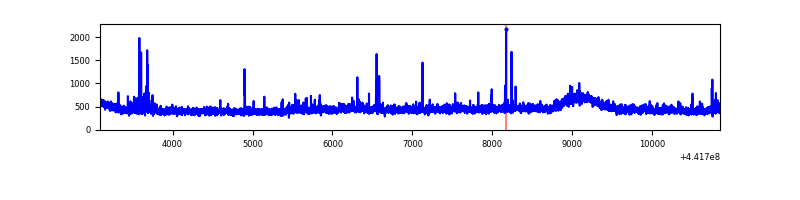 |
| C | 7756 | 7756 | 4 | 4 | 0.05% | 0.05% | 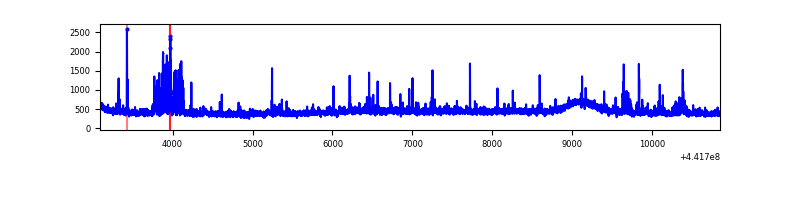 |
| D | 7756 | 7756 | 319 | 319 | 4.11% | 4.11% | 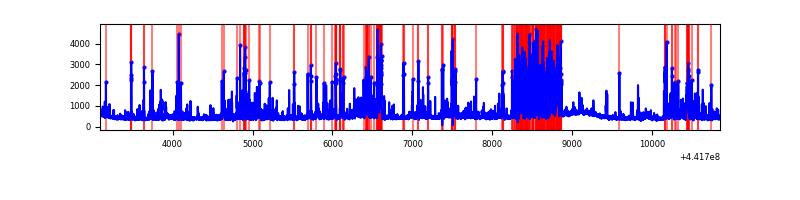 |
Top three noisy pixels from each quadrant. If the there are fewer than three noisy pixels in the level2.evt file, extra rows are filled as -1
| Pixel properties | Quadrant properties | ||||||
|---|---|---|---|---|---|---|---|
| Quadrant | DetID | PixID | Counts | Sigma | Mean | Median | Sigma |
| A | 10 | 83 | 1985732 | 11246.95 | 850 | 831 | 176.5 |
| A | 15 | 223 | 707654 | 4005.04 | 850 | 831 | 176.5 |
| A | 13 | 248 | 151958 | 856.32 | 850 | 831 | 176.5 |
| B | 0 | 183 | 58116 | 346.31 | 846 | 819 | 165.5 |
| B | 0 | 219 | 32697 | 192.67 | 846 | 819 | 165.5 |
| B | 12 | 111 | 21912 | 127.49 | 846 | 819 | 165.5 |
| C | 12 | 2 | 223867 | 1155.04 | 825 | 829 | 193.1 |
| C | 14 | 254 | 49282 | 250.92 | 825 | 829 | 193.1 |
| C | 2 | 14 | 34971 | 176.81 | 825 | 829 | 193.1 |
| D | 13 | 249 | 1283462 | 6336.24 | 807 | 780 | 202.4 |
| D | 2 | 249 | 285252 | 1405.25 | 807 | 780 | 202.4 |
| D | 1 | 52 | 157411 | 773.73 | 807 | 780 | 202.4 |
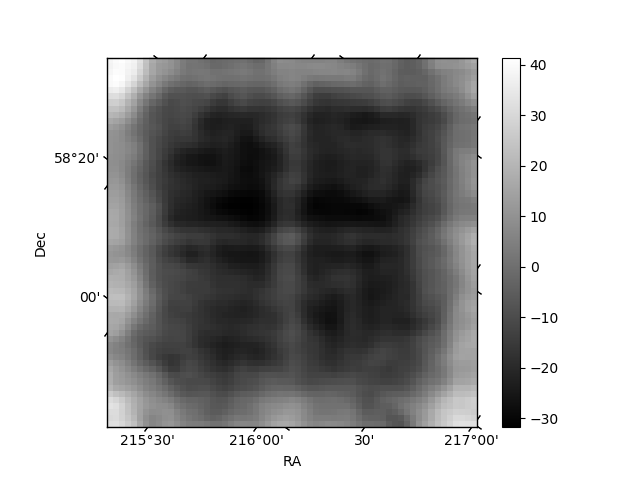
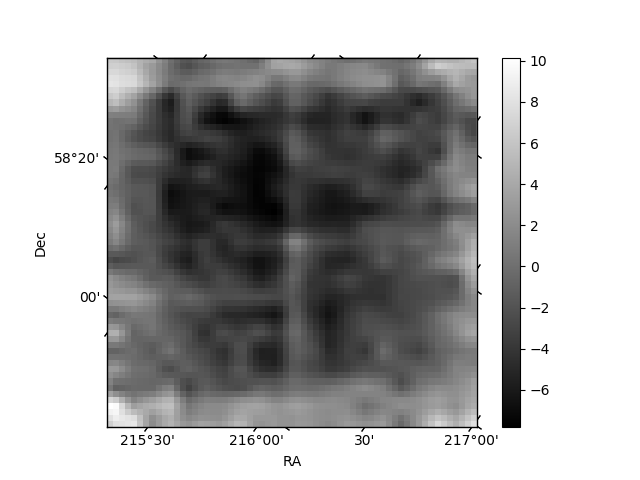
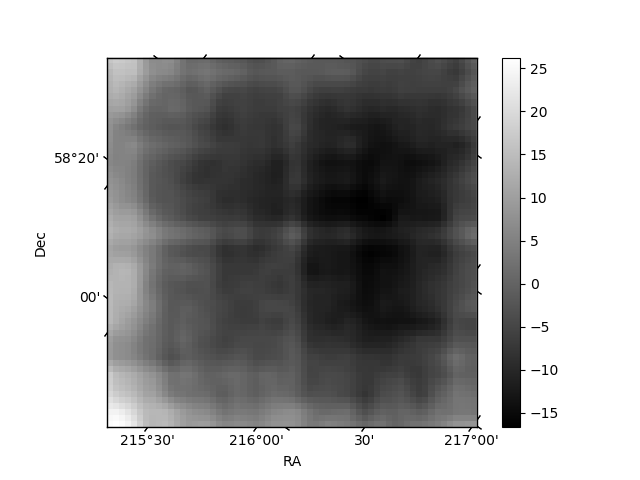
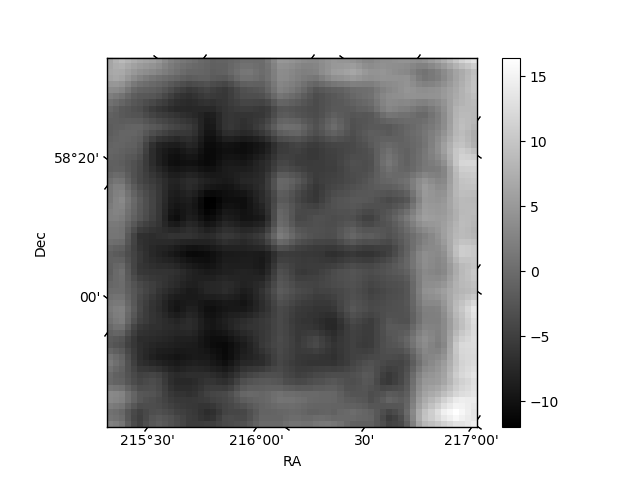
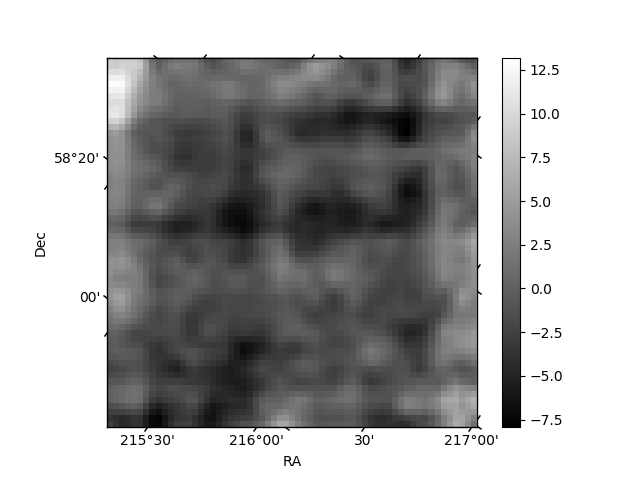
Histogram calculated using DETX and DETY for each event in the final _common_clean file
| Quadrant A | 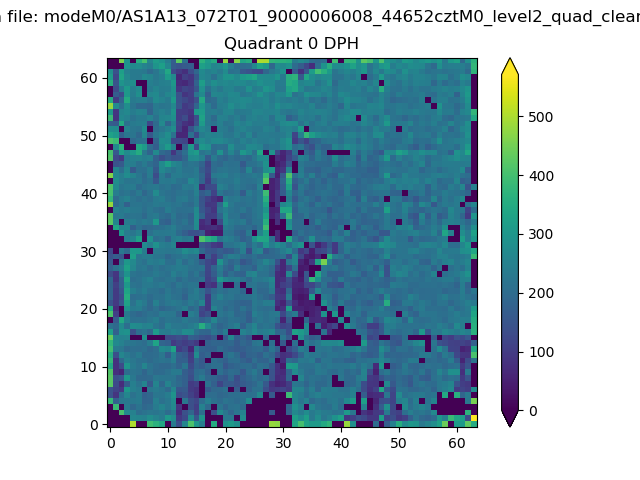 |
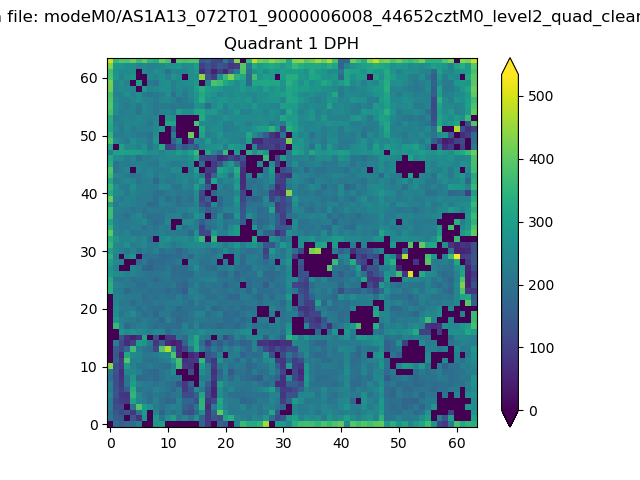 |
Quadrant B |
|---|---|---|---|
| Quadrant D | 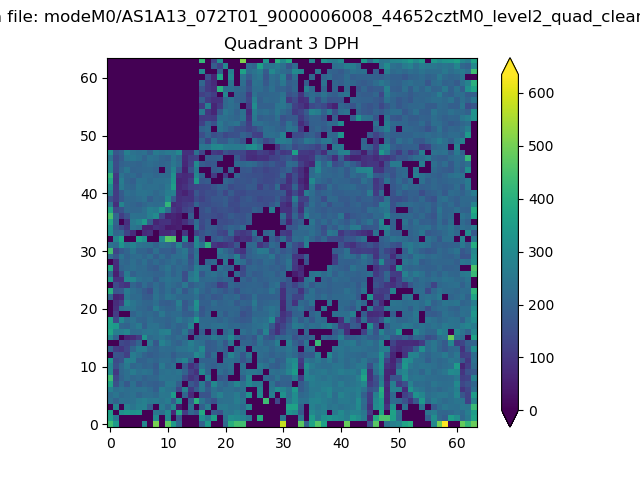 |
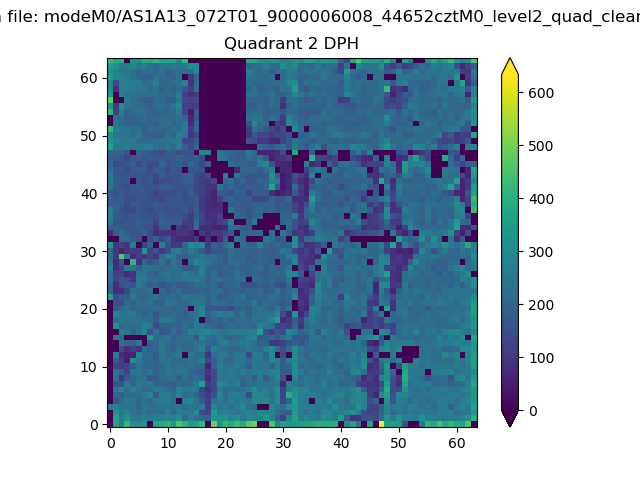 |
Quadrant C |
| Plot type | Count rate plots | Images |
|---|---|---|
| Comparison with Poisson distribution Blue bars denote a histogram of data divided into 1 sec bins. Red curve is a Poisson curve with rate = median count rate of data. |
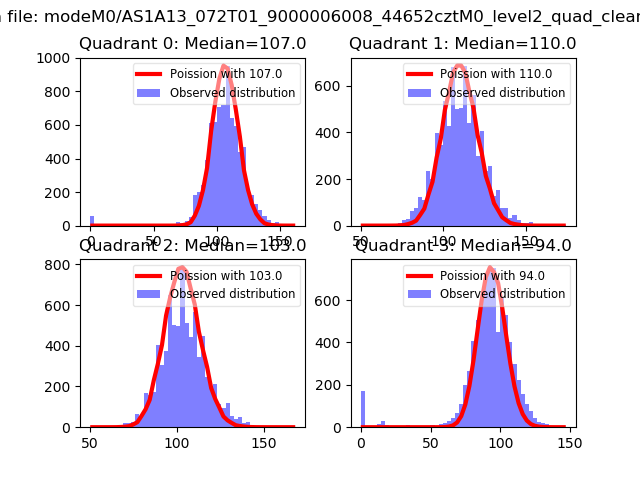 |
 |
| Quadrant-wise count rates Data is divided into 100 sec bins |
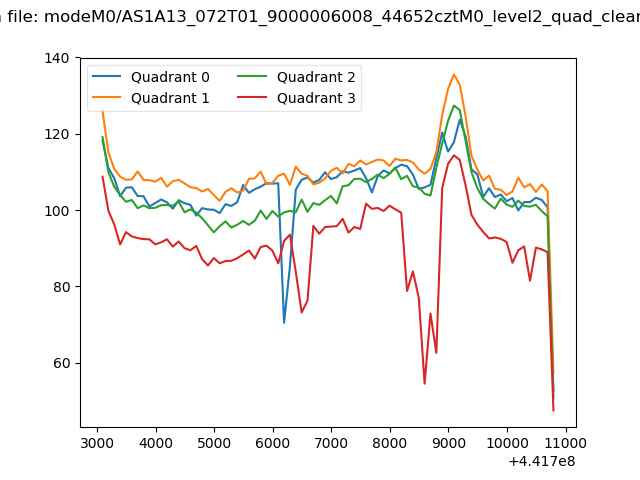 |
|
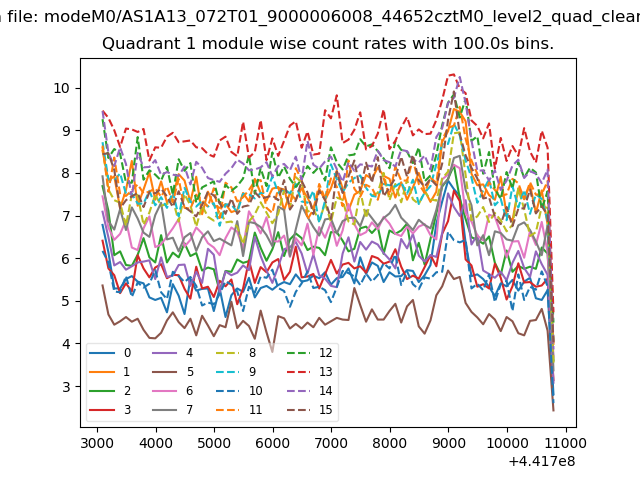
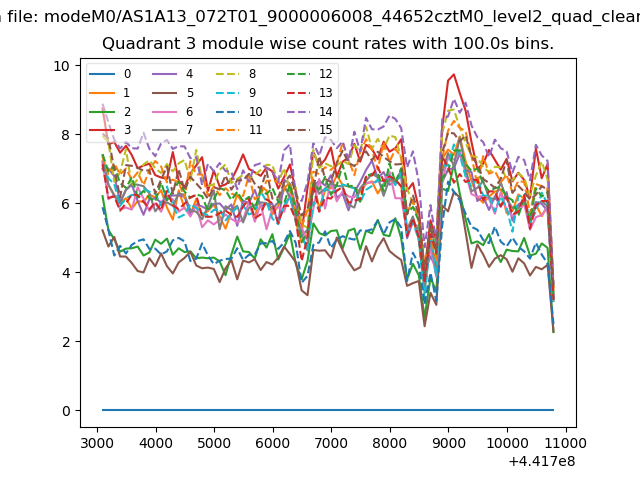
| Module-wise count rates for Quadrant A Data is divided into 100 sec bins |
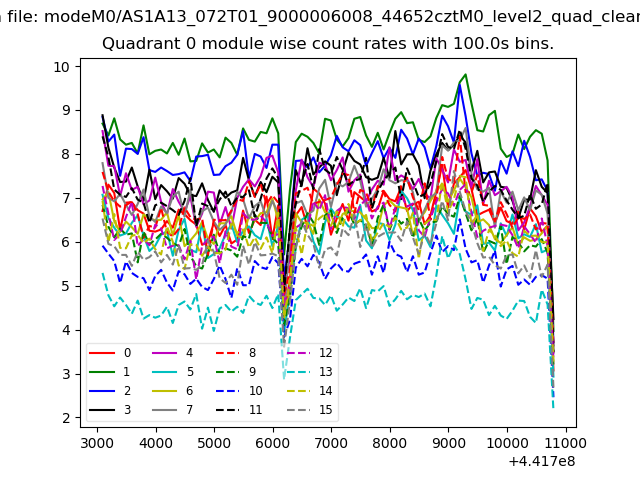 |
 |
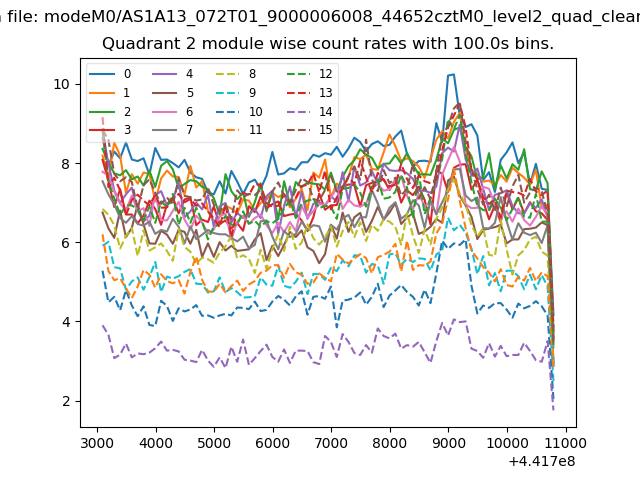
| Module-wise count rates for Quadrant B Data is divided into 100 sec bins |
 |
 |
| Module-wise count rates for Quadrant C Data is divided into 100 sec bins |
 |
 |
| Module-wise count rates for Quadrant D Data is divided into 100 sec bins |
 |
 |
| Parameter | Plot |
|---|---|
| CZT HV Monitor |  |
| D_VDD | 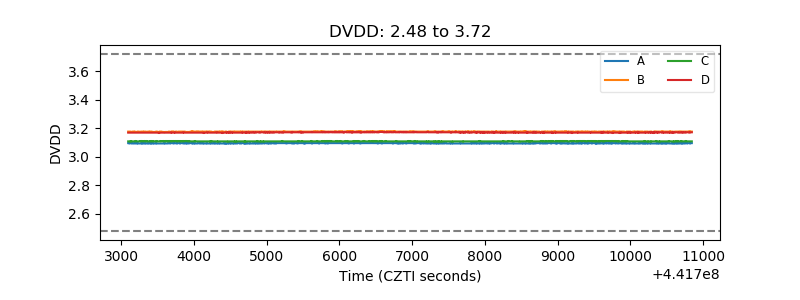 |
| Temperature 1 | 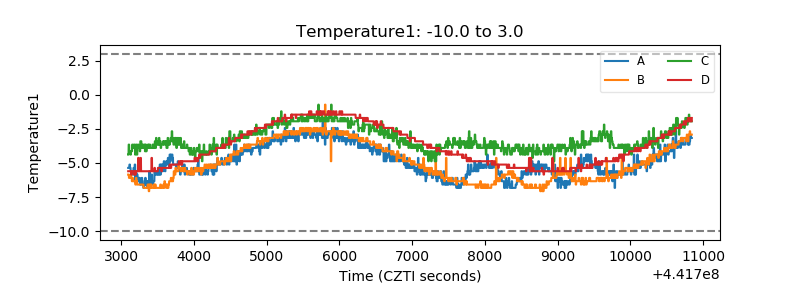 |
| Veto HV Monitor | 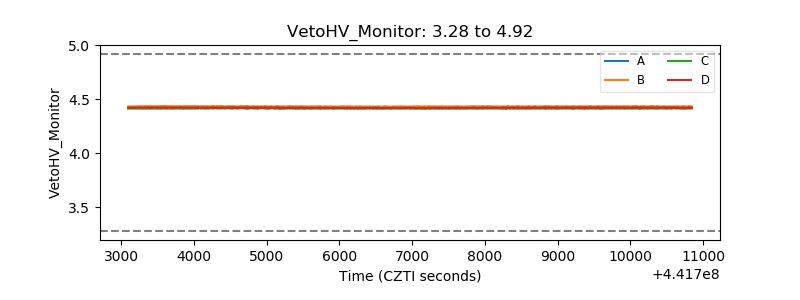 |
| Veto LLD | 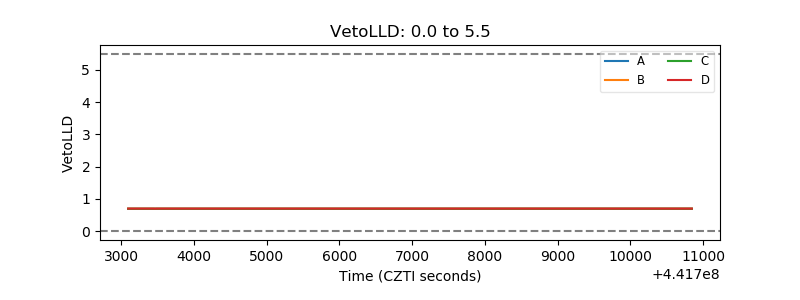 |
| Alpha Counter | 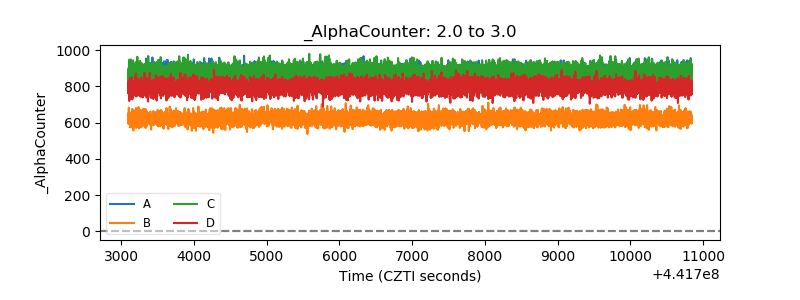 |
| _CPM_Rate | 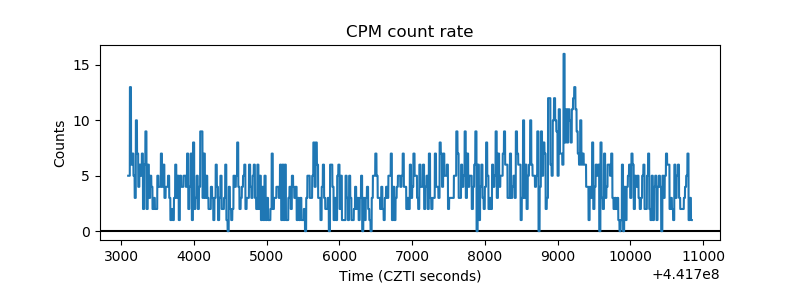 |
| CZT Counter | 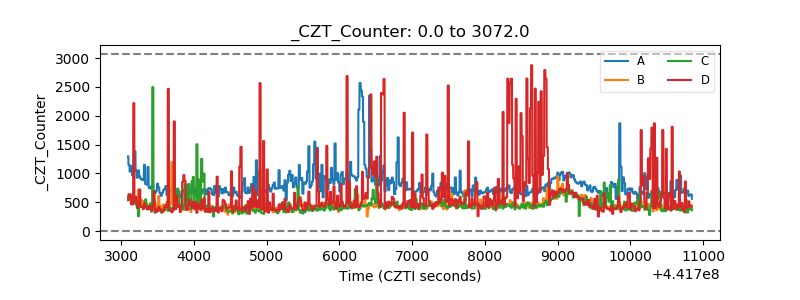 |
| +2.5 Volts monitor | 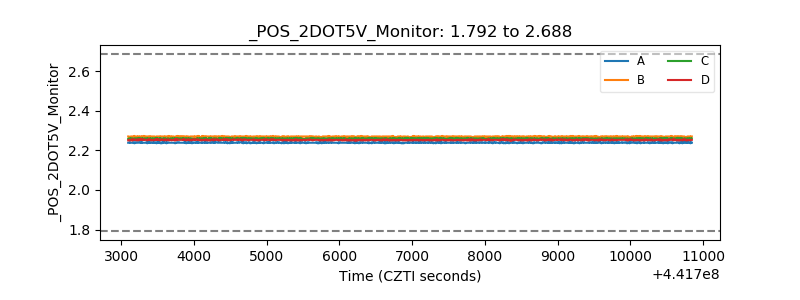 |
| +5 Volts monitor | 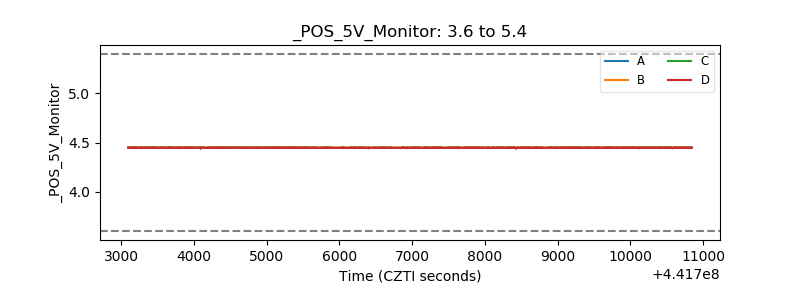 |
| _ROLL_ROT | 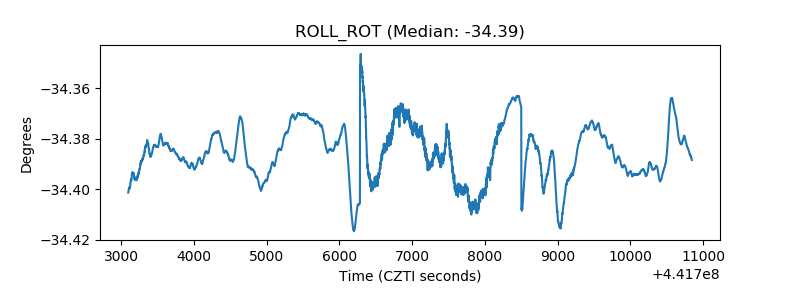 |
| _Roll_DEC | 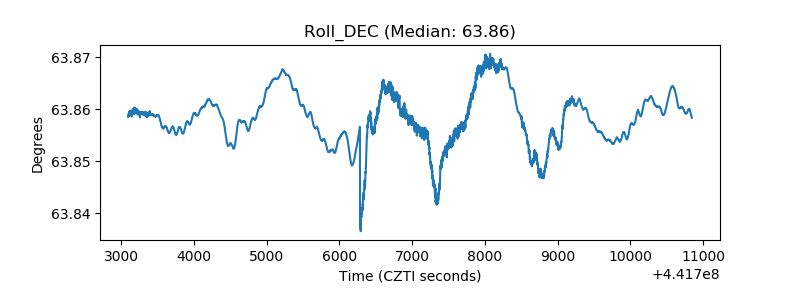 |
| _Roll_RA | 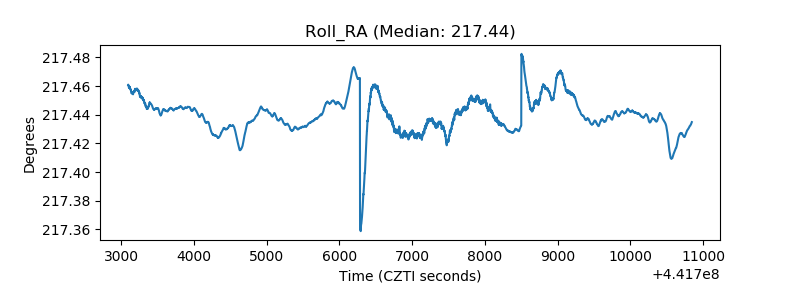 |
| Veto Counter | 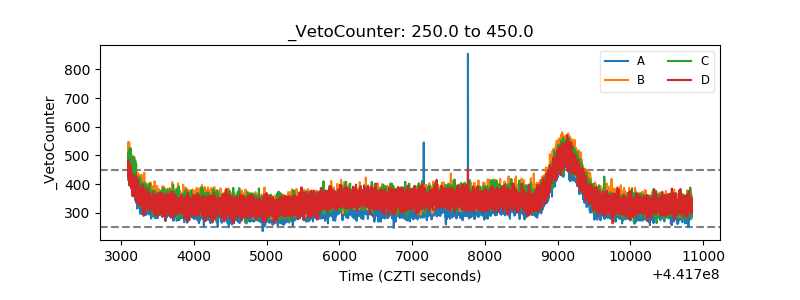 |