| Param | Original file | Final file |
|---|---|---|
| Filename | modeM0/AS1A13_072T01_9000006008_44653cztM0_level2.fits | modeM0/AS1A13_072T01_9000006008_44653cztM0_level2_quad_clean.evt |
| Size (bytes) | 512,686,080 | 119,635,200 |
| Size | 488.9 MB | 114.1 MB |
| Events in quadrant A | 6,141,804 | 802,114 |
| Events in quadrant B | 3,472,118 | 829,790 |
| Events in quadrant C | 3,372,082 | 780,334 |
| Events in quadrant D | 5,399,952 | 679,636 |
| Mode M0 | |||
|---|---|---|---|
| Quadrant | BADHDUFLAG | Total packets | Discarded packets |
| A | 0 | 24598 | 0 |
| B | 0 | 15809 | 0 |
| C | 0 | 15768 | 0 |
| D | 0 | 21524 | 0 |
| Mode SS | |||
|---|---|---|---|
| Quadrant | BADHDUFLAG | Total packets | Discarded packets |
| A | 0 | 152 | 0 |
| B | 0 | 152 | 0 |
| C | 0 | 152 | 0 |
| D | 0 | 152 | 0 |
| Quadrant | Total seconds | Saturated seconds | Saturation percentage |
|---|---|---|---|
| A | 7626 | 102 | 1.337530% |
| B | 7627 | 41 | 0.537564% |
| C | 7627 | 19 | 0.249115% |
| D | 7627 | 479 | 6.280320% |
Noise dominated data is calculated using 1-second bins in cleaned event files. If a bin has >2000 counts, and if more than 50% of those come from <1% of pixels, then it is considered to be noise-dominated and hence unusable.
| Quadrant | # 1 sec bins | Bins with >0 counts | Bins with >2000 counts | High rate bins dominated by noise | Noise dominated (total time) | Noise dominated (detector-on time) | Marked lightcurve |
|---|---|---|---|---|---|---|---|
| A | 7626 | 7626 | 35 | 35 | 0.46% | 0.46% | 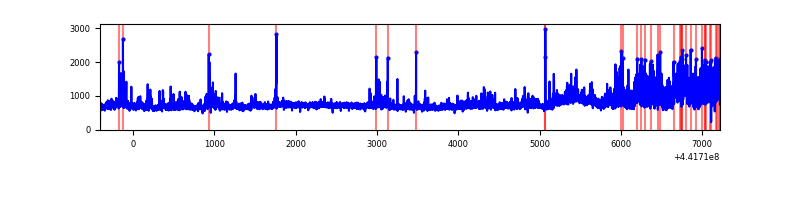 |
| B | 7627 | 7627 | 7 | 7 | 0.09% | 0.09% | 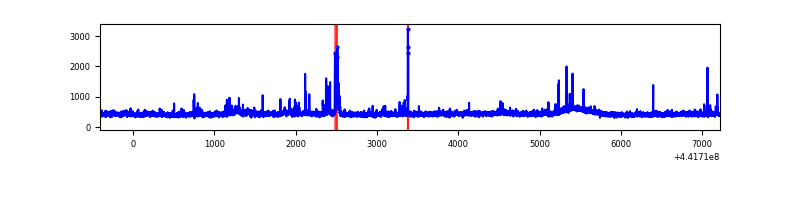 |
| C | 7627 | 7627 | 11 | 11 | 0.14% | 0.14% |  |
| D | 7627 | 7627 | 407 | 407 | 5.34% | 5.34% | 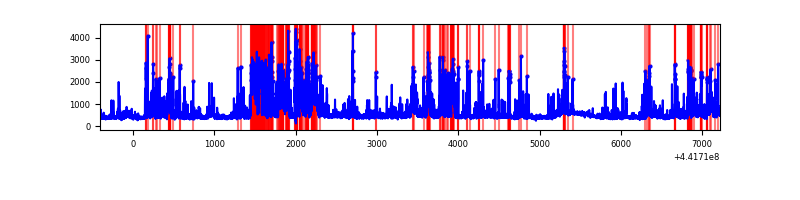 |
Top three noisy pixels from each quadrant. If the there are fewer than three noisy pixels in the level2.evt file, extra rows are filled as -1
| Pixel properties | Quadrant properties | ||||||
|---|---|---|---|---|---|---|---|
| Quadrant | DetID | PixID | Counts | Sigma | Mean | Median | Sigma |
| A | 10 | 83 | 1940992 | 11335.7 | 821 | 803 | 171.2 |
| A | 15 | 223 | 890959 | 5200.8 | 821 | 803 | 171.2 |
| A | 10 | 248 | 66538 | 384.06 | 821 | 803 | 171.2 |
| B | 0 | 186 | 83474 | 513.33 | 819 | 794 | 161.1 |
| B | 0 | 183 | 50381 | 307.86 | 819 | 794 | 161.1 |
| B | 0 | 189 | 39561 | 240.69 | 819 | 794 | 161.1 |
| C | 14 | 254 | 112163 | 598.77 | 797 | 803 | 186.0 |
| C | 12 | 2 | 54261 | 287.44 | 797 | 803 | 186.0 |
| C | 0 | 207 | 49761 | 263.24 | 797 | 803 | 186.0 |
| D | 13 | 249 | 962821 | 4954.77 | 778 | 753 | 194.2 |
| D | 4 | 221 | 566349 | 2912.89 | 778 | 753 | 194.2 |
| D | 1 | 52 | 351059 | 1804.12 | 778 | 753 | 194.2 |
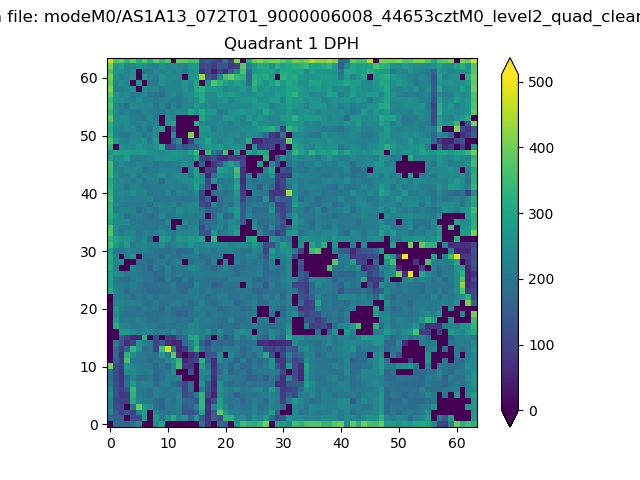
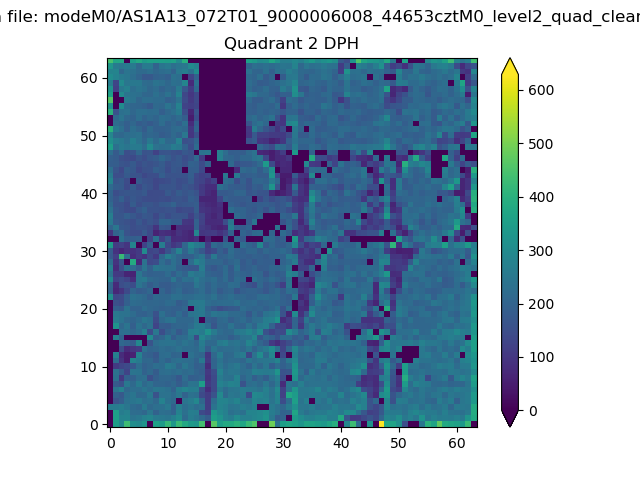
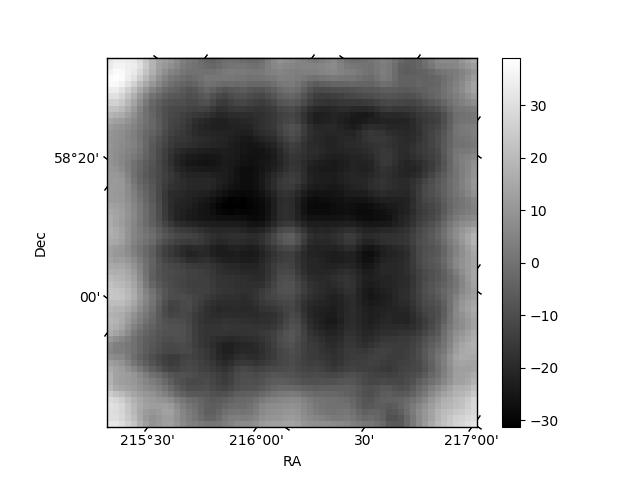
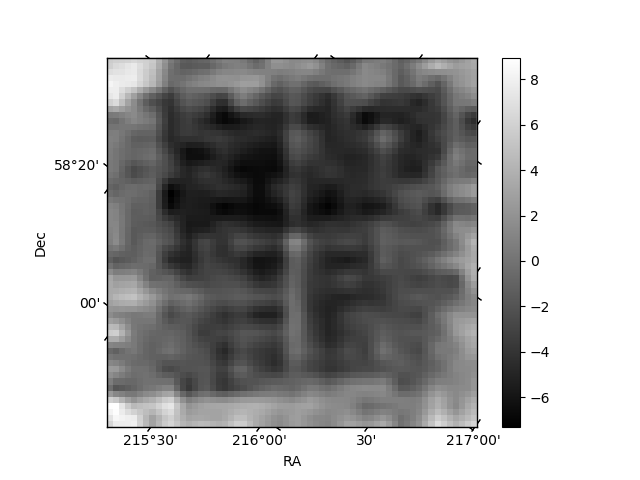
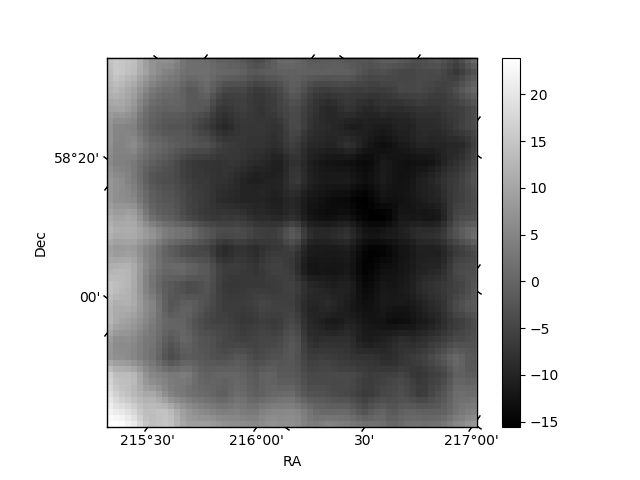
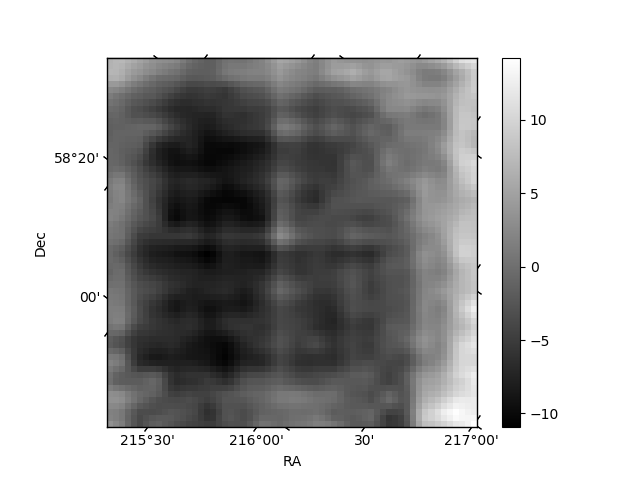
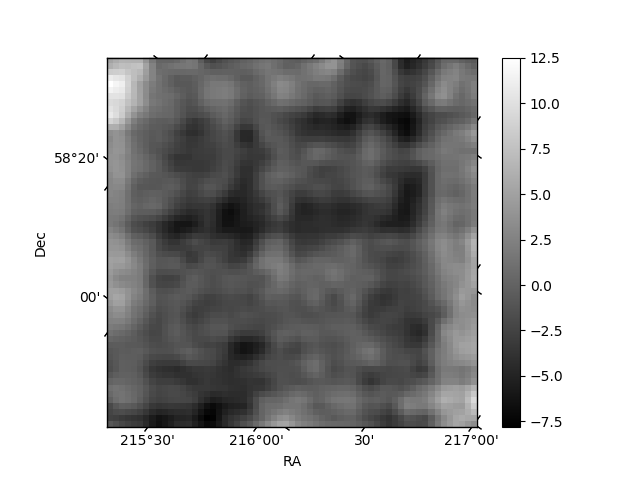
Histogram calculated using DETX and DETY for each event in the final _common_clean file
| Quadrant A | 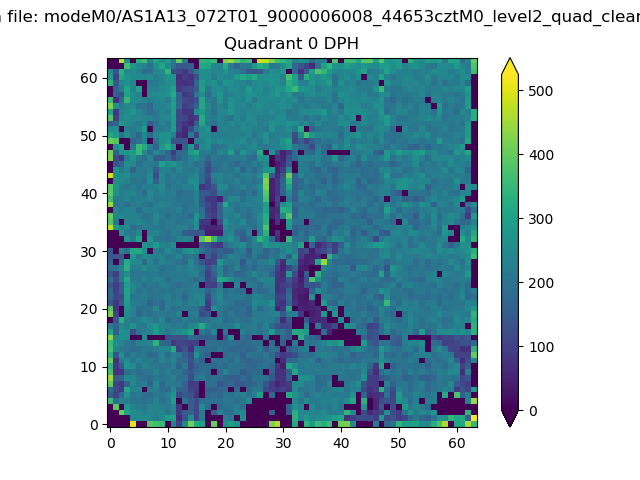 |
 |
Quadrant B |
|---|---|---|---|
| Quadrant D | 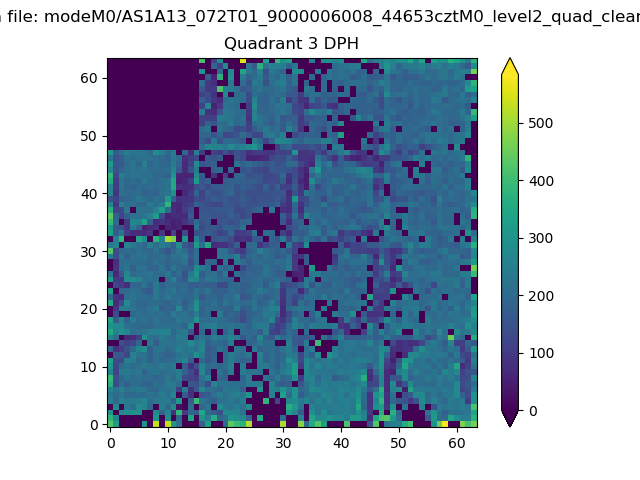 |
 |
Quadrant C |
| Plot type | Count rate plots | Images |
|---|---|---|
| Comparison with Poisson distribution Blue bars denote a histogram of data divided into 1 sec bins. Red curve is a Poisson curve with rate = median count rate of data. |
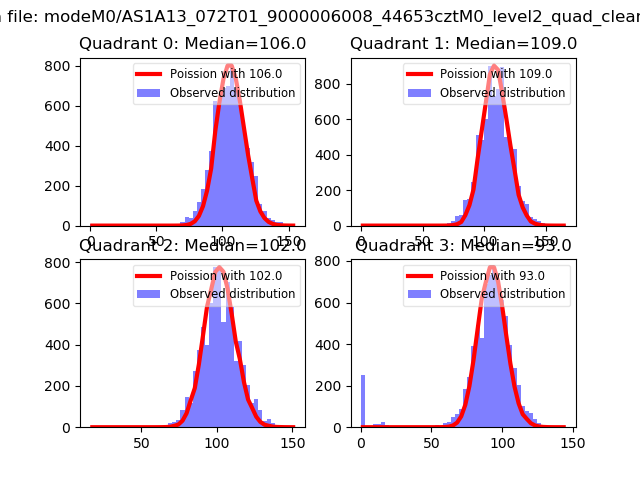 |
 |
| Quadrant-wise count rates Data is divided into 100 sec bins |
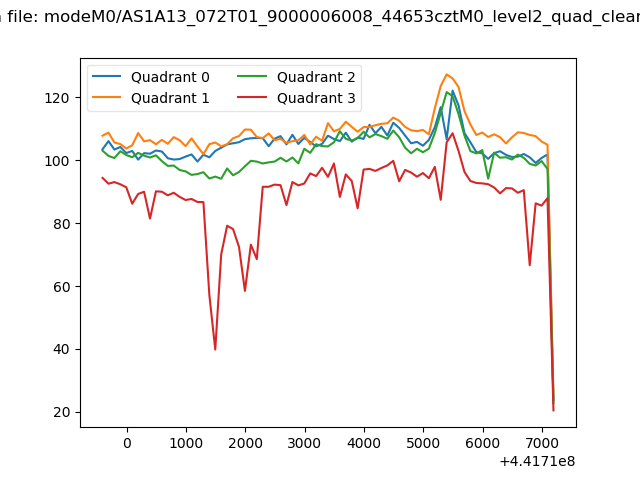 |
|
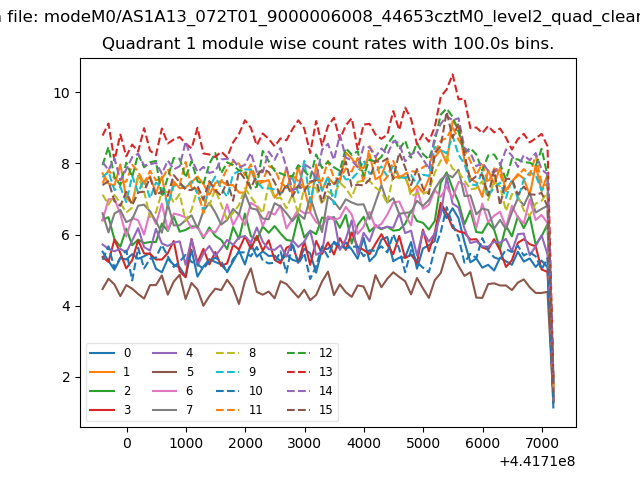
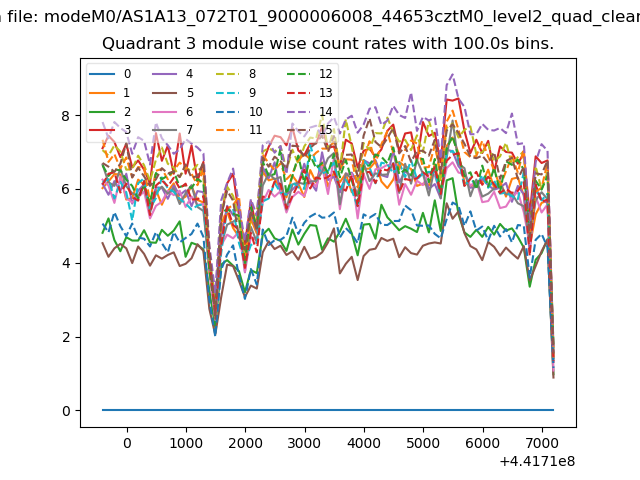
| Module-wise count rates for Quadrant A Data is divided into 100 sec bins |
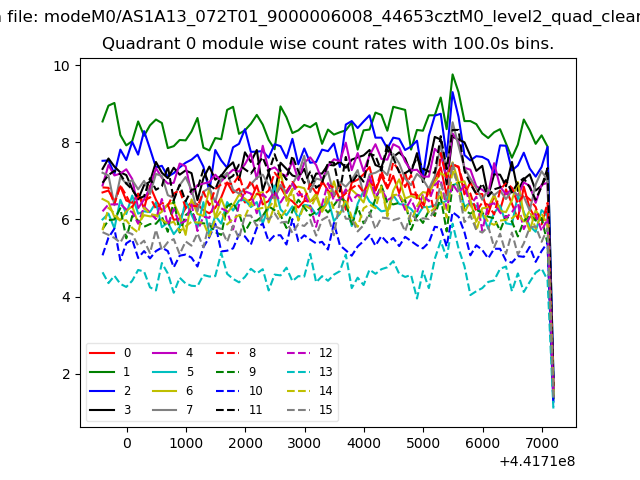 |
 |
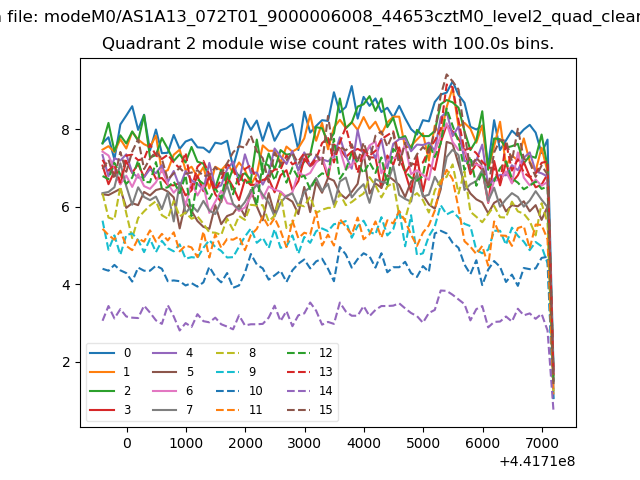
| Module-wise count rates for Quadrant B Data is divided into 100 sec bins |
 |
 |
| Module-wise count rates for Quadrant C Data is divided into 100 sec bins |
 |
 |
| Module-wise count rates for Quadrant D Data is divided into 100 sec bins |
 |
 |
| Parameter | Plot |
|---|---|
| CZT HV Monitor | 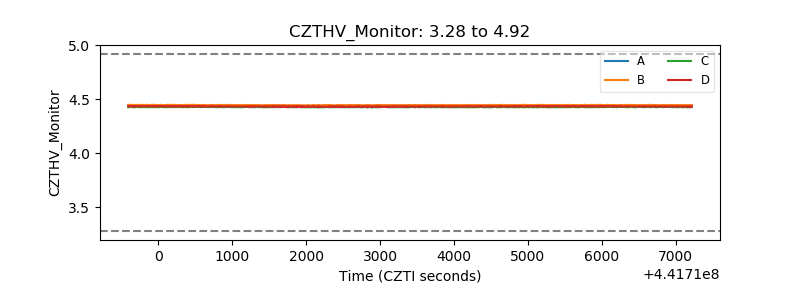 |
| D_VDD | 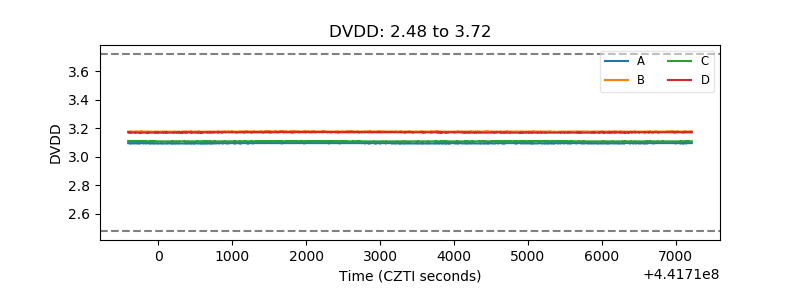 |
| Temperature 1 | 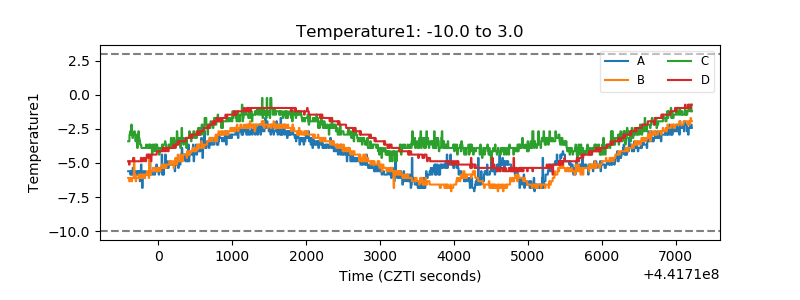 |
| Veto HV Monitor | 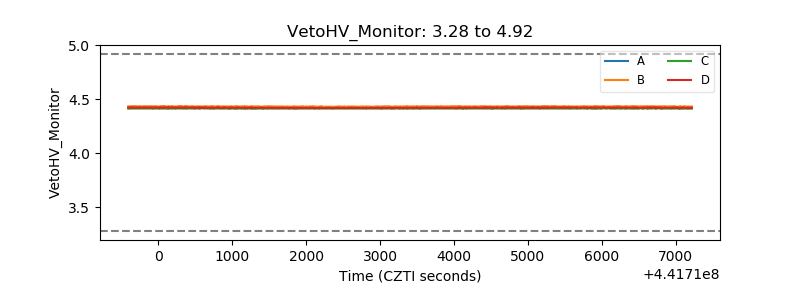 |
| Veto LLD | 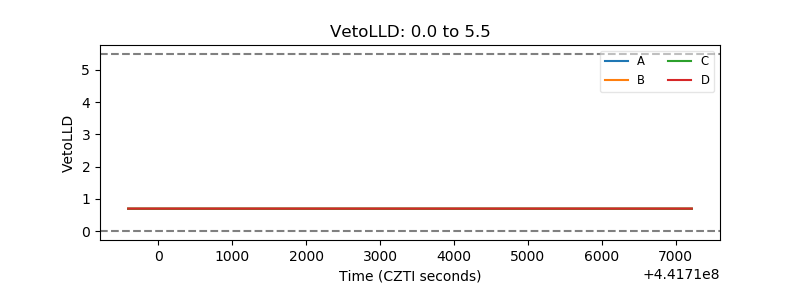 |
| Alpha Counter | 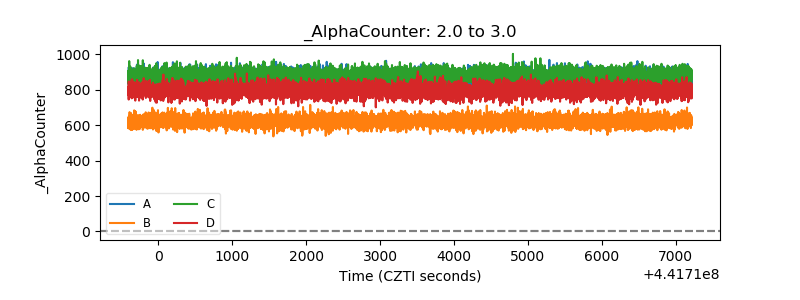 |
| _CPM_Rate |  |
| CZT Counter | 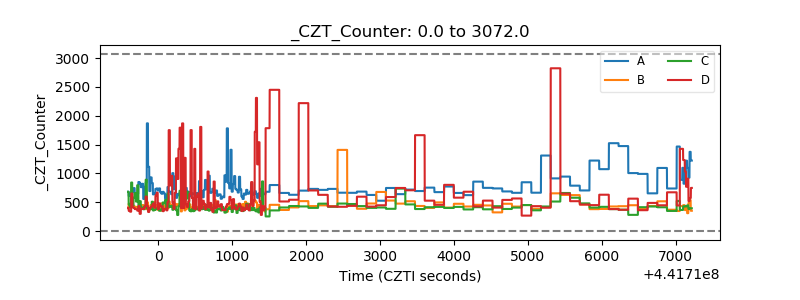 |
| +2.5 Volts monitor | 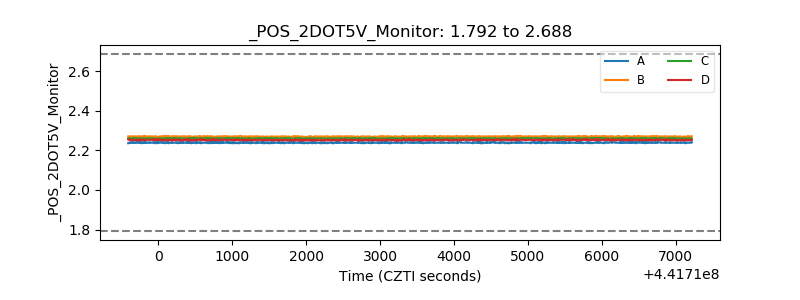 |
| +5 Volts monitor | 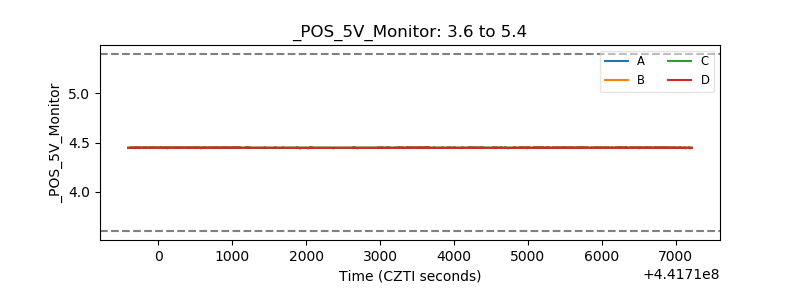 |
| _ROLL_ROT | 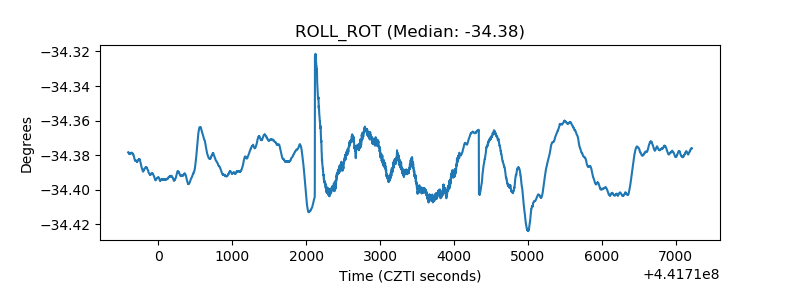 |
| _Roll_DEC | 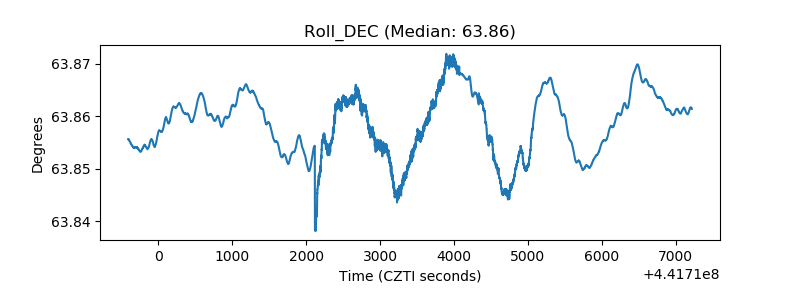 |
| _Roll_RA | 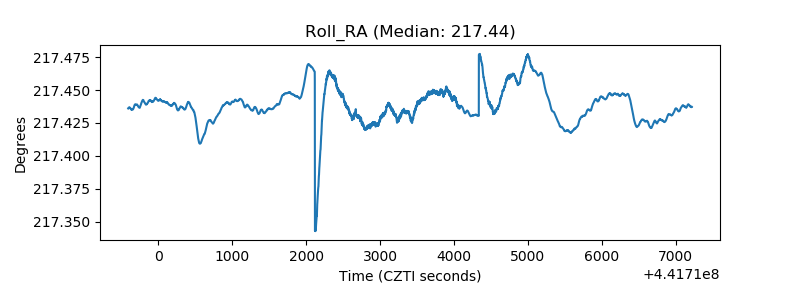 |
| Veto Counter | 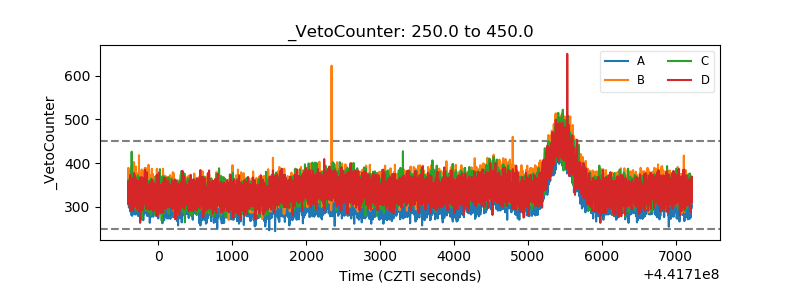 |