| Param | Original file | Final file |
|---|---|---|
| Filename | modeM0/AS1A13_072T01_9000006008_44657cztM0_level2.fits | modeM0/AS1A13_072T01_9000006008_44657cztM0_level2_quad_clean.evt |
| Size (bytes) | 915,592,320 | 158,731,200 |
| Size | 873.2 MB | 151.4 MB |
| Events in quadrant A | 9,143,662 | 1,055,867 |
| Events in quadrant B | 4,915,047 | 1,146,310 |
| Events in quadrant C | 5,636,625 | 1,073,128 |
| Events in quadrant D | 13,369,304 | 790,328 |
| Mode M0 | |||
|---|---|---|---|
| Quadrant | BADHDUFLAG | Total packets | Discarded packets |
| A | 0 | 36106 | 2 |
| B | 0 | 22236 | 2 |
| C | 0 | 24624 | 2 |
| D | 0 | 47140 | 4 |
| Mode SS | |||
|---|---|---|---|
| Quadrant | BADHDUFLAG | Total packets | Discarded packets |
| A | 0 | 216 | 0 |
| B | 0 | 216 | 0 |
| C | 0 | 216 | 0 |
| D | 0 | 216 | 0 |
| Mode M9 | |||
|---|---|---|---|
| Quadrant | BADHDUFLAG | Total packets | Discarded packets |
| A | 0 | 16 | 0 |
| B | 0 | 16 | 0 |
| C | 0 | 16 | 0 |
| D | 0 | 16 | 0 |
| Quadrant | Total seconds | Saturated seconds | Saturation percentage |
|---|---|---|---|
| A | 10693 | 802 | 7.500234% |
| B | 10694 | 67 | 0.626520% |
| C | 10694 | 271 | 2.534131% |
| D | 10693 | 2585 | 24.174694% |
Noise dominated data is calculated using 1-second bins in cleaned event files. If a bin has >2000 counts, and if more than 50% of those come from <1% of pixels, then it is considered to be noise-dominated and hence unusable.
| Quadrant | # 1 sec bins | Bins with >0 counts | Bins with >2000 counts | High rate bins dominated by noise | Noise dominated (total time) | Noise dominated (detector-on time) | Marked lightcurve |
|---|---|---|---|---|---|---|---|
| A | 12173 | 10695 | 451 | 451 | 3.70% | 4.22% | 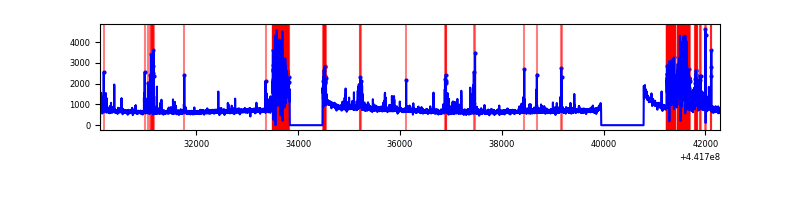 |
| B | 12174 | 10696 | 6 | 6 | 0.05% | 0.06% | 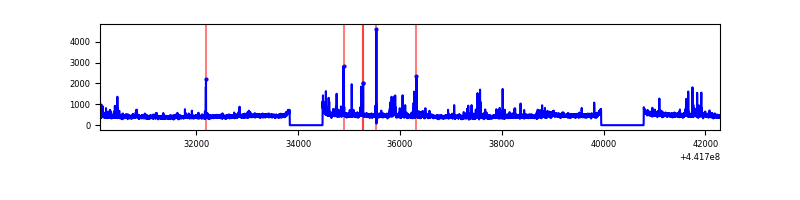 |
| C | 12174 | 10696 | 178 | 178 | 1.46% | 1.66% | 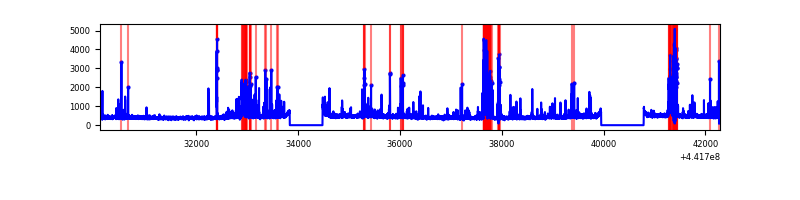 |
| D | 12173 | 10695 | 2458 | 2458 | 20.19% | 22.98% | 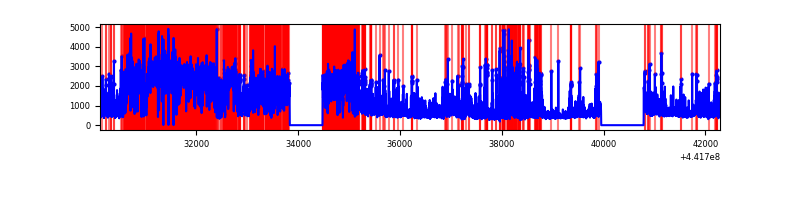 |
Top three noisy pixels from each quadrant. If the there are fewer than three noisy pixels in the level2.evt file, extra rows are filled as -1
| Pixel properties | Quadrant properties | ||||||
|---|---|---|---|---|---|---|---|
| Quadrant | DetID | PixID | Counts | Sigma | Mean | Median | Sigma |
| A | 10 | 83 | 2913393 | 12638.65 | 1116 | 1094 | 230.4 |
| A | 15 | 223 | 1153379 | 5000.63 | 1116 | 1094 | 230.4 |
| A | 13 | 248 | 625997 | 2711.92 | 1116 | 1094 | 230.4 |
| B | 0 | 189 | 169650 | 740.12 | 1160 | 1124 | 227.7 |
| B | 0 | 186 | 57669 | 248.33 | 1160 | 1124 | 227.7 |
| B | 0 | 219 | 31013 | 131.26 | 1160 | 1124 | 227.7 |
| C | 12 | 2 | 549689 | 2090.62 | 1125 | 1131 | 262.4 |
| C | 14 | 254 | 321595 | 1221.33 | 1125 | 1131 | 262.4 |
| C | 0 | 207 | 249006 | 944.68 | 1125 | 1131 | 262.4 |
| D | 1 | 52 | 5876744 | 22600.01 | 1029 | 998 | 260.0 |
| D | 13 | 153 | 2169940 | 8342.45 | 1029 | 998 | 260.0 |
| D | 13 | 249 | 663205 | 2547.06 | 1029 | 998 | 260.0 |
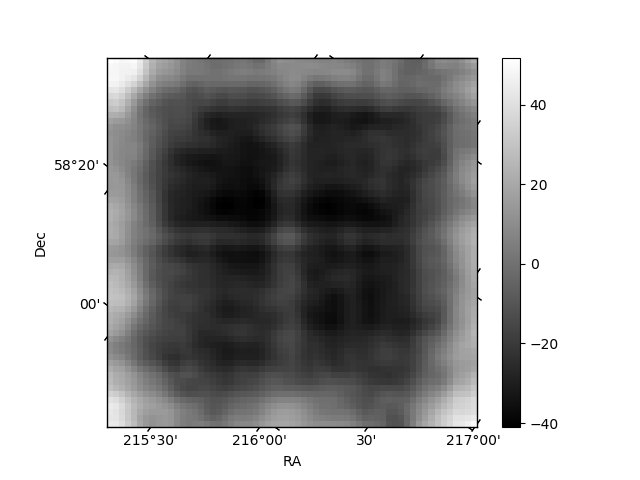
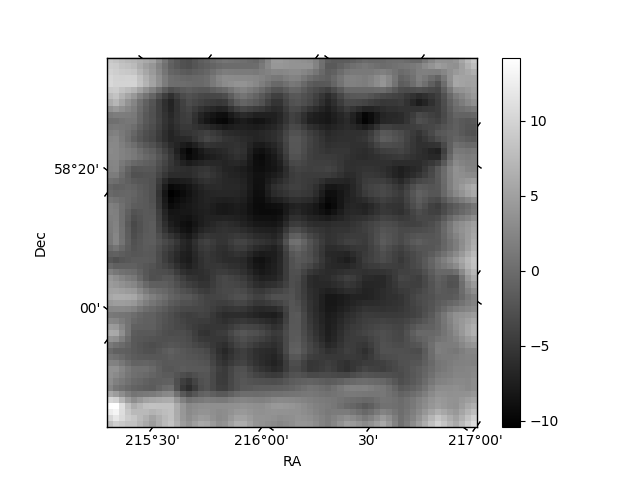
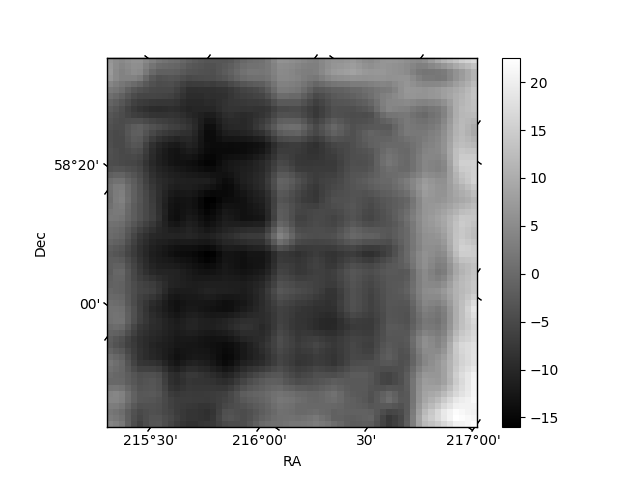
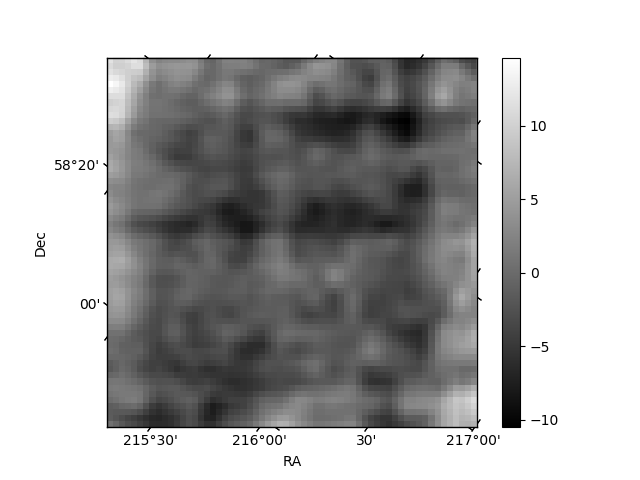
Histogram calculated using DETX and DETY for each event in the final _common_clean file
| Quadrant A | 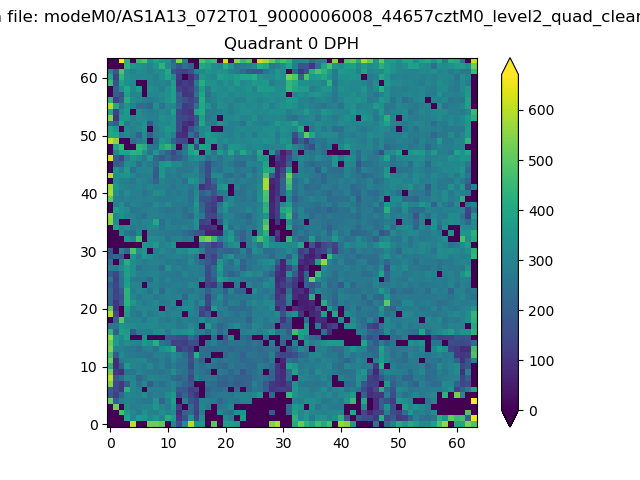 |
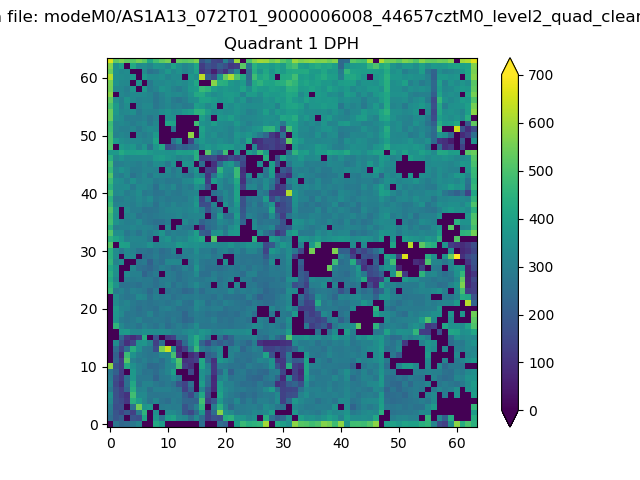 |
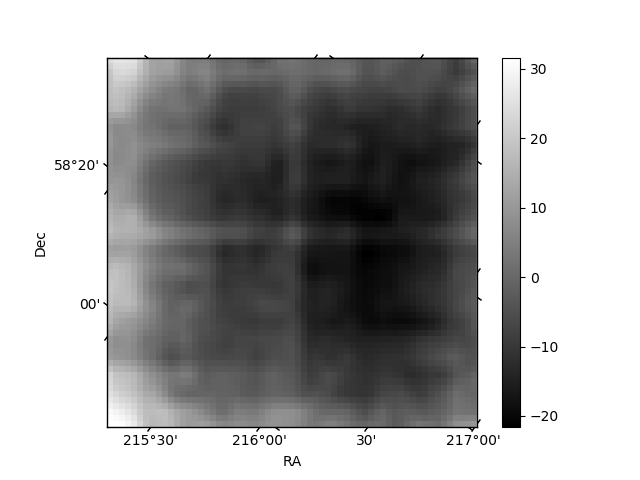
Quadrant B |
|---|---|---|---|
| Quadrant D | 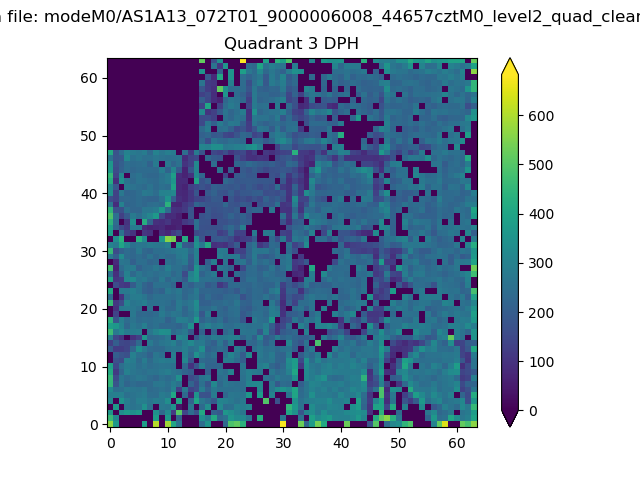 |
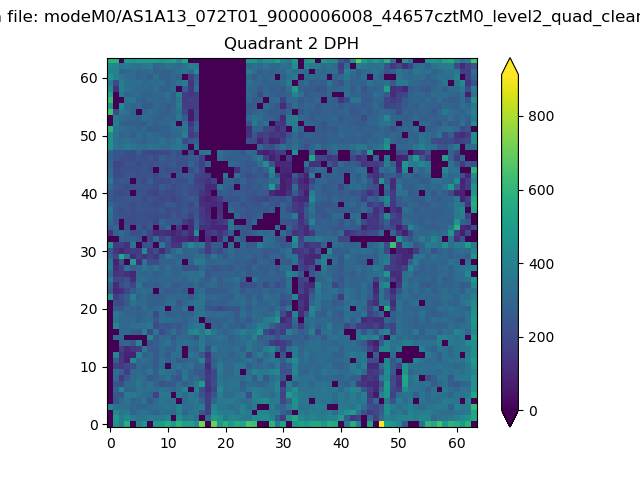 |
Quadrant C |
| Plot type | Count rate plots | Images |
|---|---|---|
| Comparison with Poisson distribution Blue bars denote a histogram of data divided into 1 sec bins. Red curve is a Poisson curve with rate = median count rate of data. |
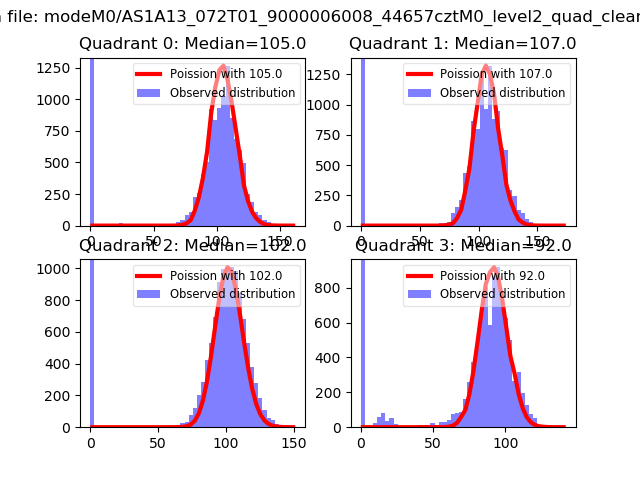 |
 |
| Quadrant-wise count rates Data is divided into 100 sec bins |
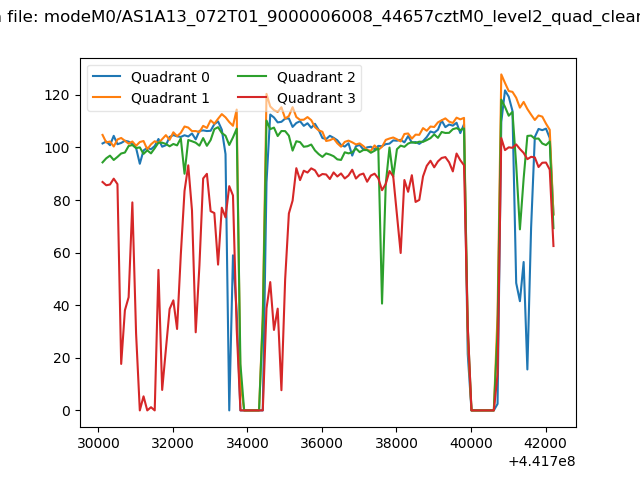 |
|
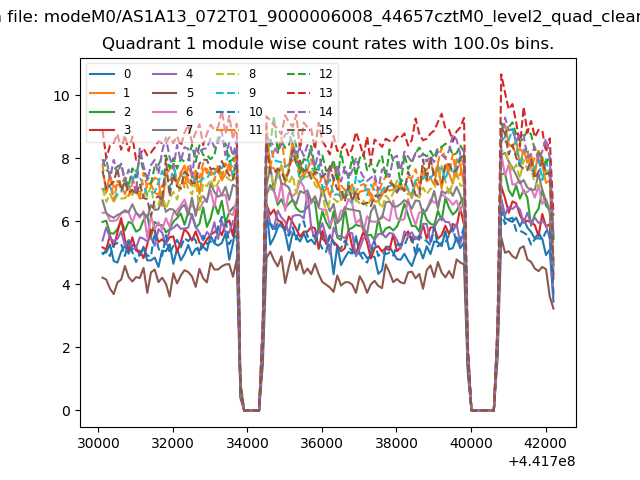
| Module-wise count rates for Quadrant A Data is divided into 100 sec bins |
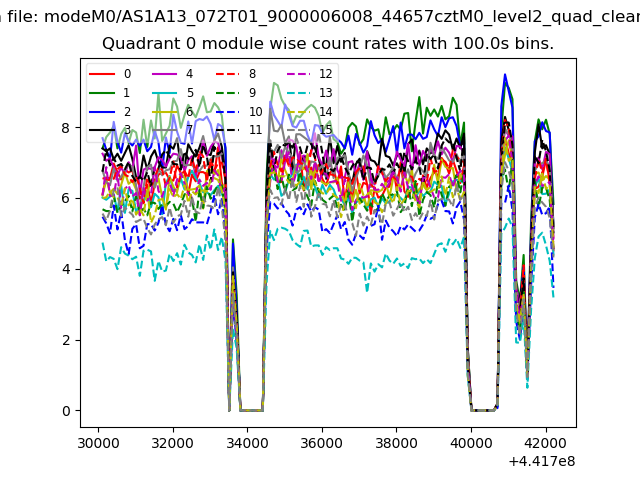 |
 |
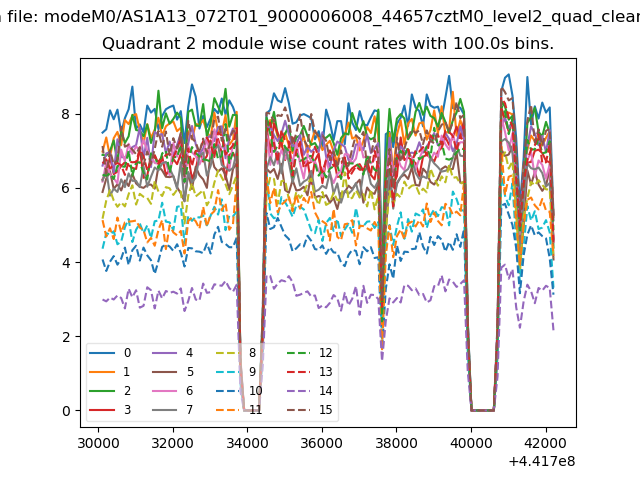
| Module-wise count rates for Quadrant B Data is divided into 100 sec bins |
 |
 |
| Module-wise count rates for Quadrant C Data is divided into 100 sec bins |
 |
 |
| Module-wise count rates for Quadrant D Data is divided into 100 sec bins |
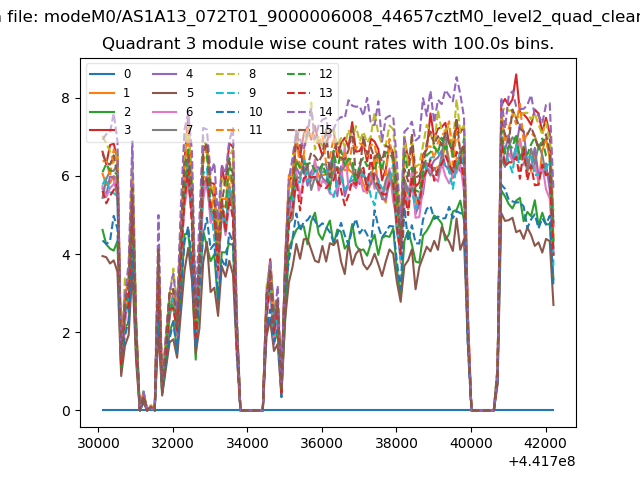 |
 |
| Parameter | Plot |
|---|---|
| CZT HV Monitor |  |
| D_VDD | 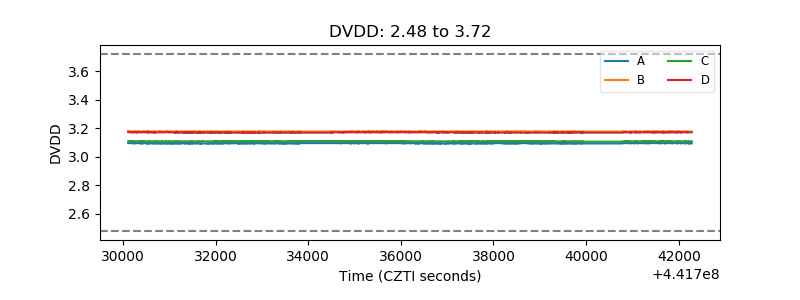 |
| Temperature 1 |  |
| Veto HV Monitor | 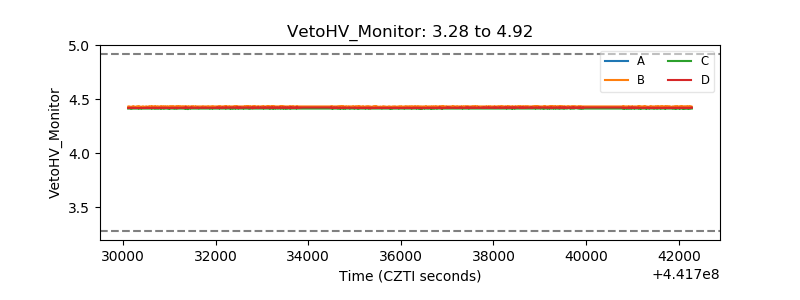 |
| Veto LLD | 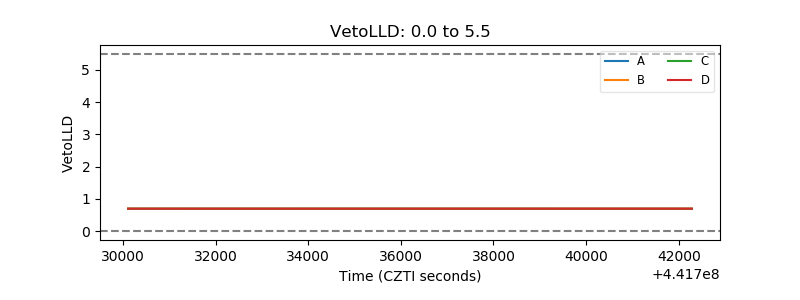 |
| Alpha Counter | 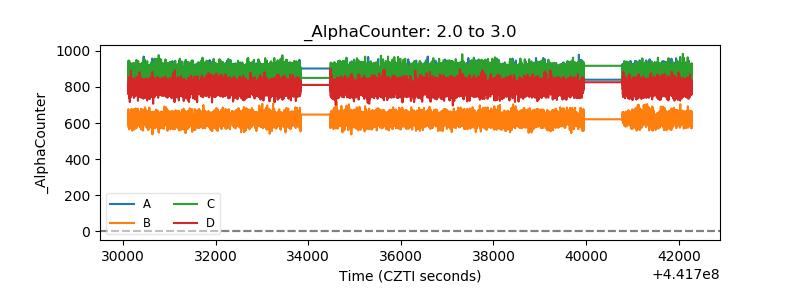 |
| _CPM_Rate | 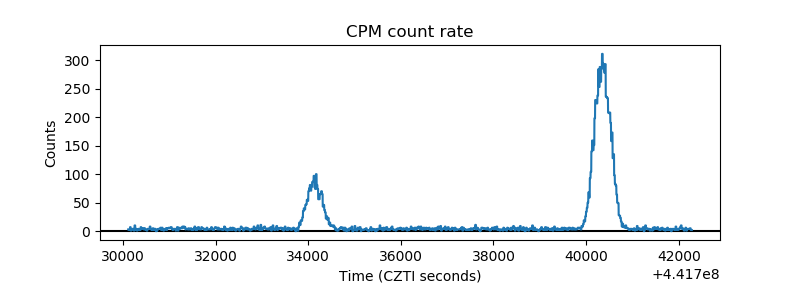 |
| CZT Counter | 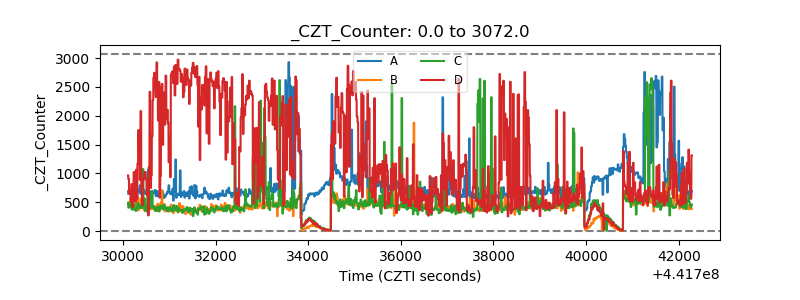 |
| +2.5 Volts monitor | 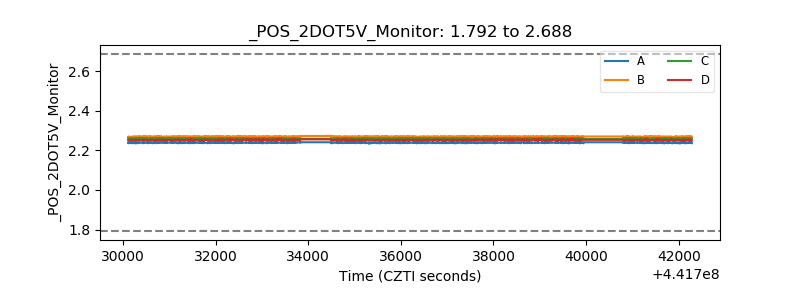 |
| +5 Volts monitor | 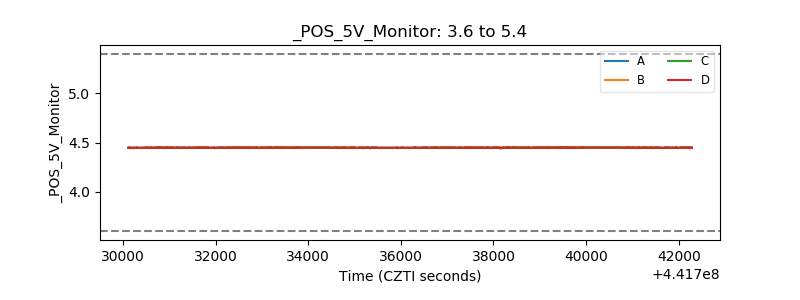 |
| _ROLL_ROT | 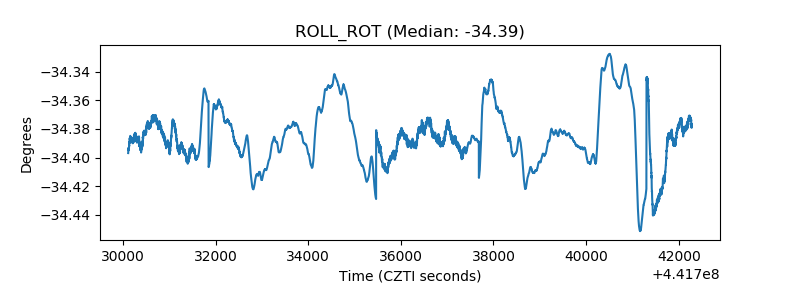 |
| _Roll_DEC | 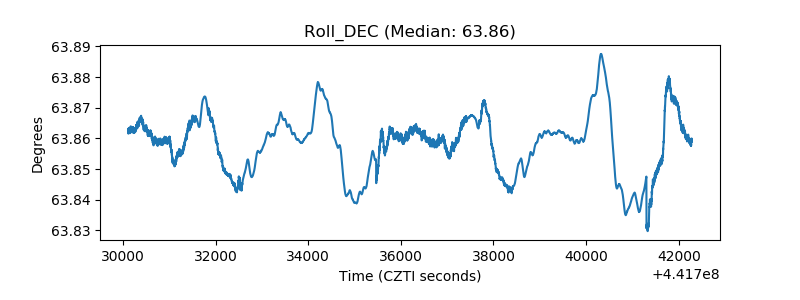 |
| _Roll_RA | 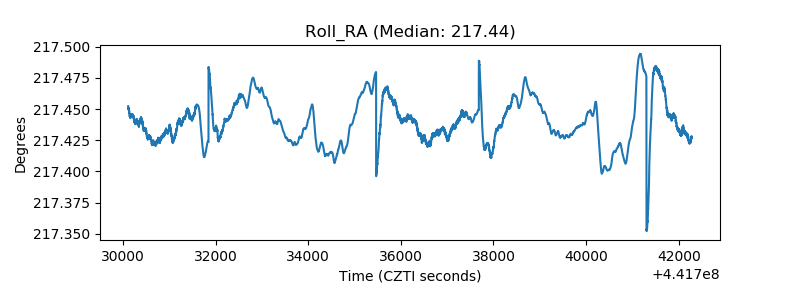 |
| Veto Counter | 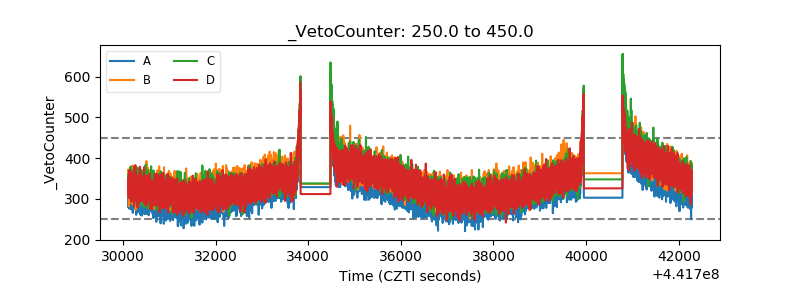 |