| Param | Original file | Final file |
|---|---|---|
| Filename | modeM0/AS1A13_072T01_9000006008_44658cztM0_level2.fits | modeM0/AS1A13_072T01_9000006008_44658cztM0_level2_quad_clean.evt |
| Size (bytes) | 418,682,880 | 96,577,920 |
| Size | 399.3 MB | 92.1 MB |
| Events in quadrant A | 5,333,988 | 618,819 |
| Events in quadrant B | 2,945,320 | 669,901 |
| Events in quadrant C | 2,898,341 | 634,757 |
| Events in quadrant D | 3,849,181 | 577,518 |
| Mode M0 | |||
|---|---|---|---|
| Quadrant | BADHDUFLAG | Total packets | Discarded packets |
| A | 0 | 20861 | 3 |
| B | 0 | 13171 | 1 |
| C | 0 | 13045 | 1 |
| D | 0 | 15837 | 1 |
| Mode SS | |||
|---|---|---|---|
| Quadrant | BADHDUFLAG | Total packets | Discarded packets |
| A | 0 | 122 | 0 |
| B | 0 | 122 | 0 |
| C | 0 | 122 | 0 |
| D | 0 | 122 | 0 |
| Mode M9 | |||
|---|---|---|---|
| Quadrant | BADHDUFLAG | Total packets | Discarded packets |
| A | 0 | 10 | 0 |
| B | 0 | 10 | 0 |
| C | 0 | 10 | 0 |
| D | 0 | 10 | 0 |
| Quadrant | Total seconds | Saturated seconds | Saturation percentage |
|---|---|---|---|
| A | 6062 | 415 | 6.845925% |
| B | 6063 | 73 | 1.204024% |
| C | 6063 | 85 | 1.401946% |
| D | 6063 | 194 | 3.199736% |
Noise dominated data is calculated using 1-second bins in cleaned event files. If a bin has >2000 counts, and if more than 50% of those come from <1% of pixels, then it is considered to be noise-dominated and hence unusable.
| Quadrant | # 1 sec bins | Bins with >0 counts | Bins with >2000 counts | High rate bins dominated by noise | Noise dominated (total time) | Noise dominated (detector-on time) | Marked lightcurve |
|---|---|---|---|---|---|---|---|
| A | 7062 | 6063 | 248 | 248 | 3.51% | 4.09% | 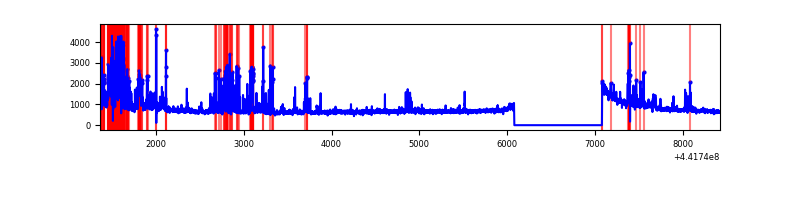 |
| B | 7063 | 6064 | 38 | 38 | 0.54% | 0.63% | 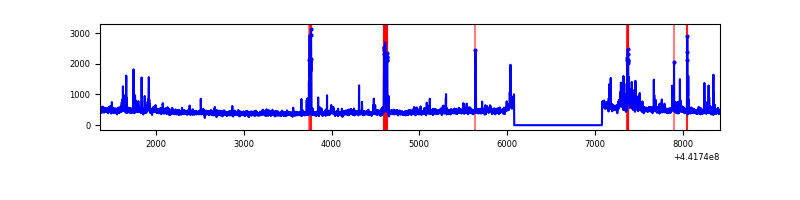 |
| C | 7063 | 6064 | 49 | 49 | 0.69% | 0.81% | 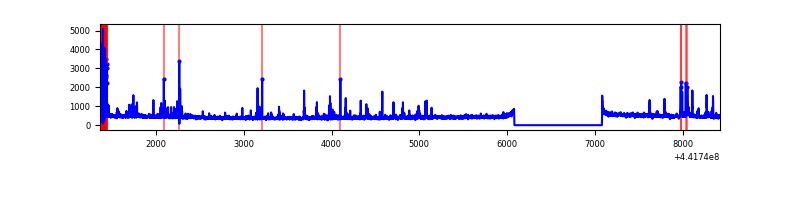 |
| D | 7063 | 6064 | 164 | 164 | 2.32% | 2.70% | 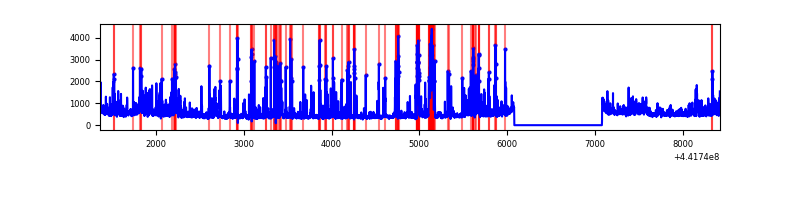 |
Top three noisy pixels from each quadrant. If the there are fewer than three noisy pixels in the level2.evt file, extra rows are filled as -1
| Pixel properties | Quadrant properties | ||||||
|---|---|---|---|---|---|---|---|
| Quadrant | DetID | PixID | Counts | Sigma | Mean | Median | Sigma |
| A | 10 | 83 | 1653054 | 12409.88 | 642 | 628 | 133.2 |
| A | 15 | 223 | 666347 | 4999.61 | 642 | 628 | 133.2 |
| A | 13 | 248 | 454374 | 3407.68 | 642 | 628 | 133.2 |
| B | 0 | 189 | 86979 | 662.13 | 660 | 641 | 130.4 |
| B | 0 | 219 | 66876 | 507.96 | 660 | 641 | 130.4 |
| B | 0 | 186 | 66522 | 505.25 | 660 | 641 | 130.4 |
| C | 14 | 254 | 222206 | 1458.74 | 648 | 653 | 151.9 |
| C | 12 | 2 | 78742 | 514.15 | 648 | 653 | 151.9 |
| C | 3 | 233 | 29153 | 187.65 | 648 | 653 | 151.9 |
| D | 13 | 249 | 593446 | 3674.56 | 643 | 624 | 161.3 |
| D | 1 | 52 | 370725 | 2294.04 | 643 | 624 | 161.3 |
| D | 5 | 222 | 147368 | 909.58 | 643 | 624 | 161.3 |
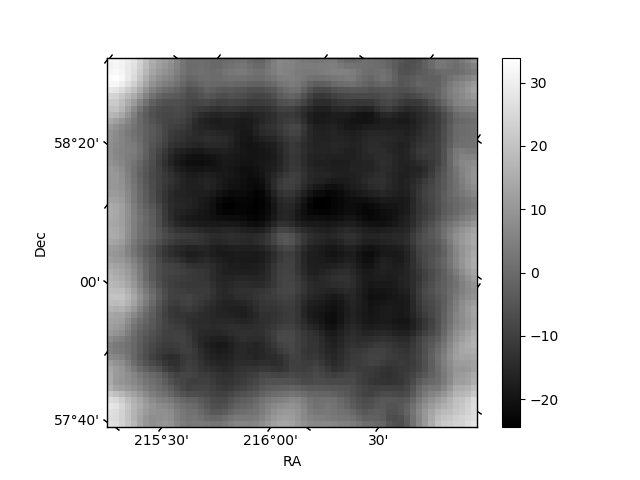
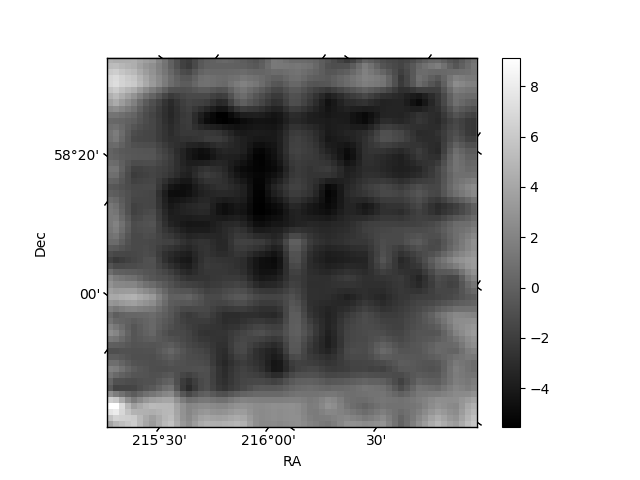
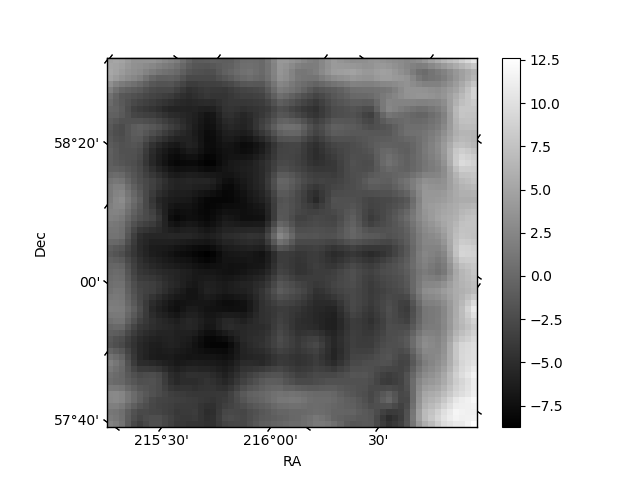
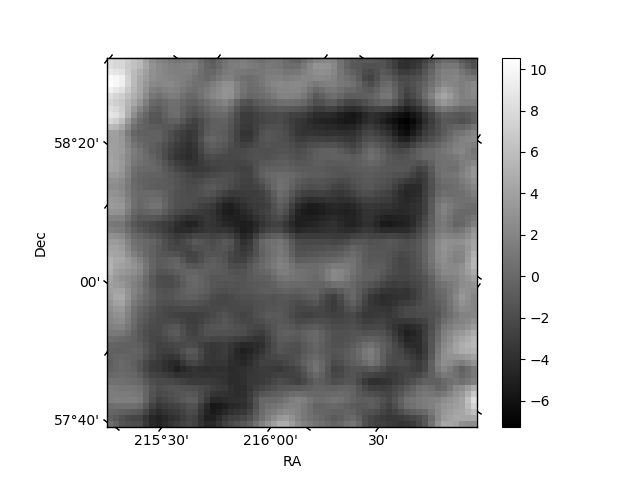
Histogram calculated using DETX and DETY for each event in the final _common_clean file
| Quadrant A | 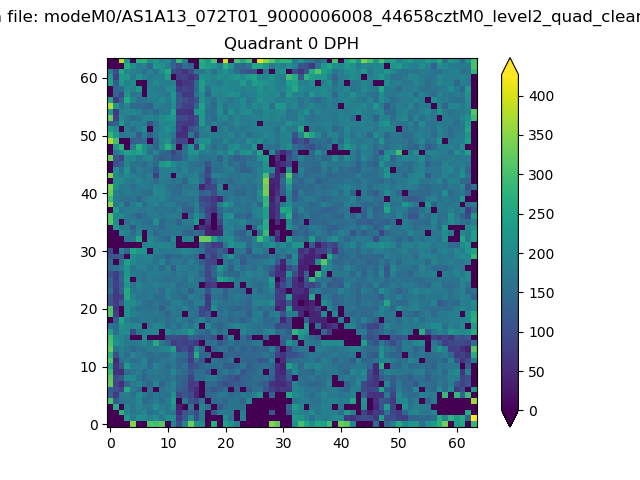 |
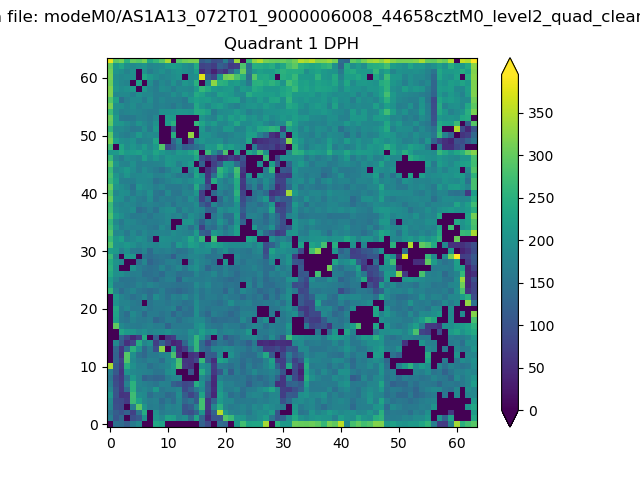 |
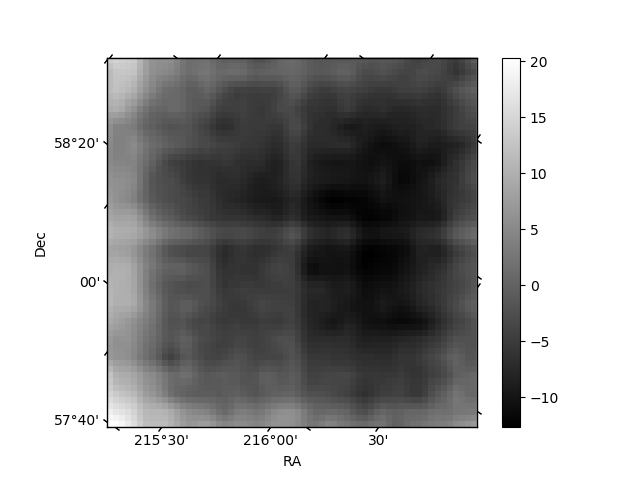
Quadrant B |
|---|---|---|---|
| Quadrant D | 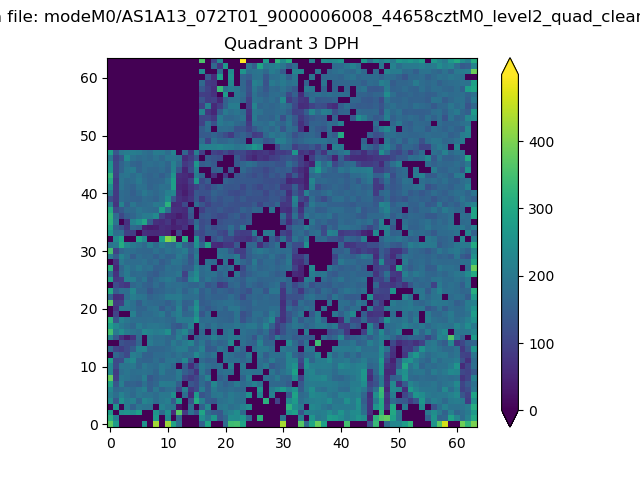 |
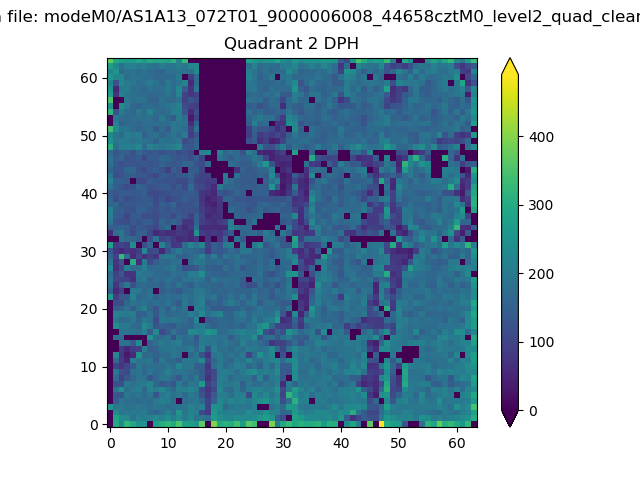 |
Quadrant C |
| Plot type | Count rate plots | Images |
|---|---|---|
| Comparison with Poisson distribution Blue bars denote a histogram of data divided into 1 sec bins. Red curve is a Poisson curve with rate = median count rate of data. |
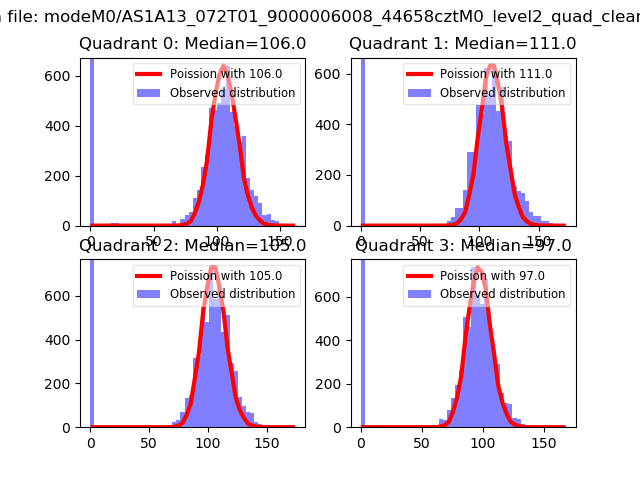 |
 |
| Quadrant-wise count rates Data is divided into 100 sec bins |
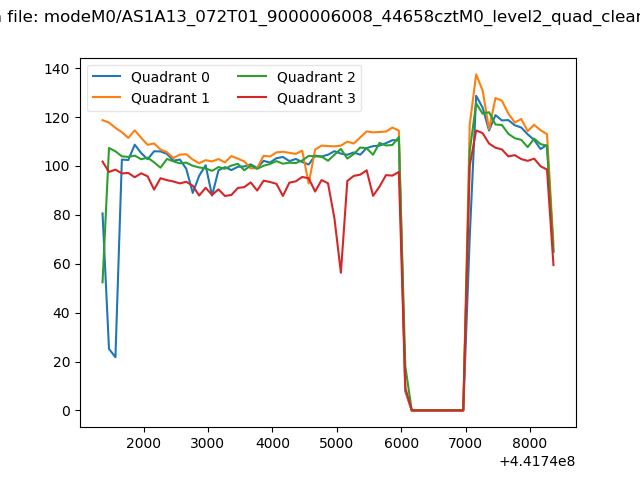 |
|
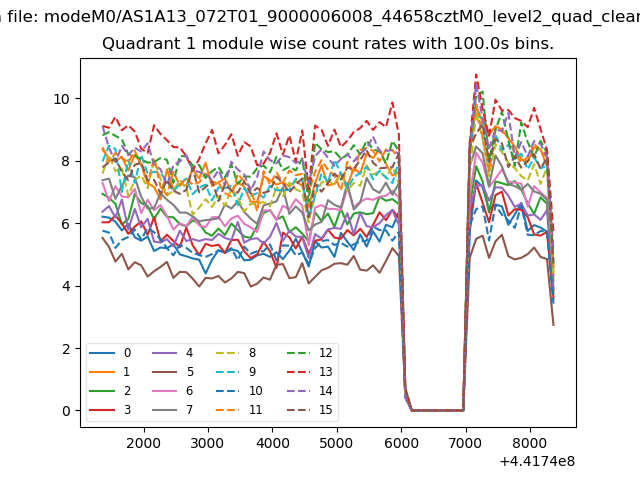
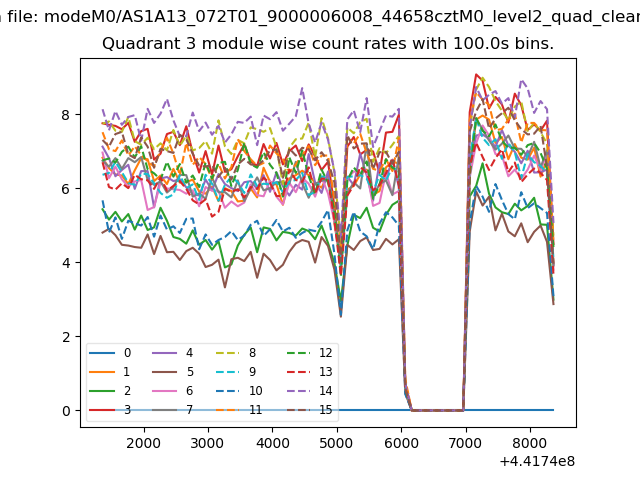
| Module-wise count rates for Quadrant A Data is divided into 100 sec bins |
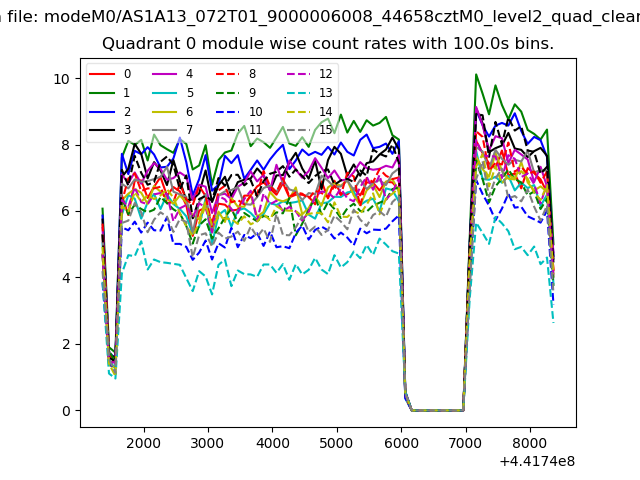 |
 |
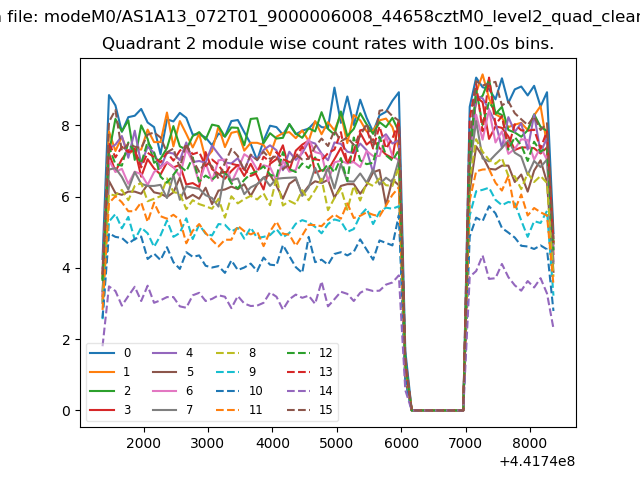
| Module-wise count rates for Quadrant B Data is divided into 100 sec bins |
 |
 |
| Module-wise count rates for Quadrant C Data is divided into 100 sec bins |
 |
 |
| Module-wise count rates for Quadrant D Data is divided into 100 sec bins |
 |
 |
| Parameter | Plot |
|---|---|
| CZT HV Monitor | 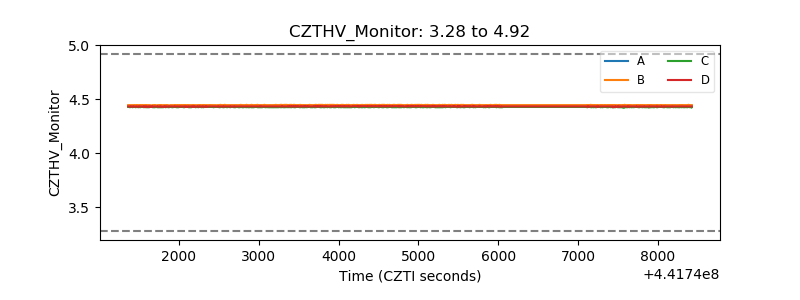 |
| D_VDD | 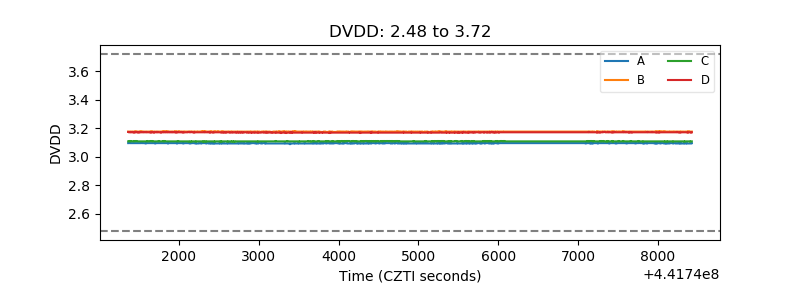 |
| Temperature 1 | 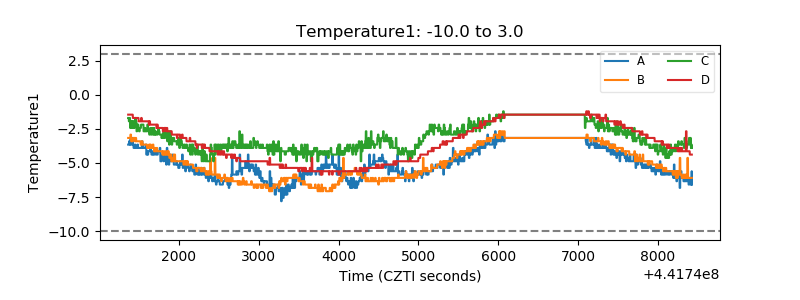 |
| Veto HV Monitor | 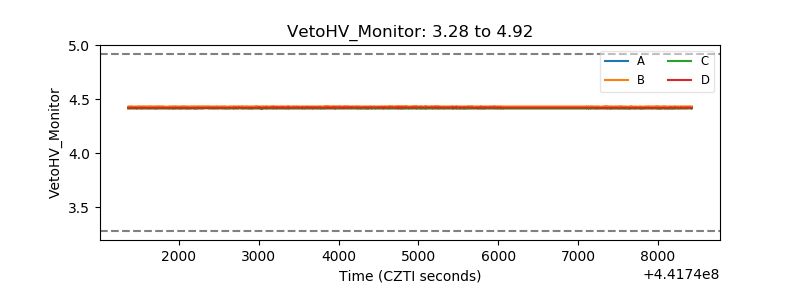 |
| Veto LLD | 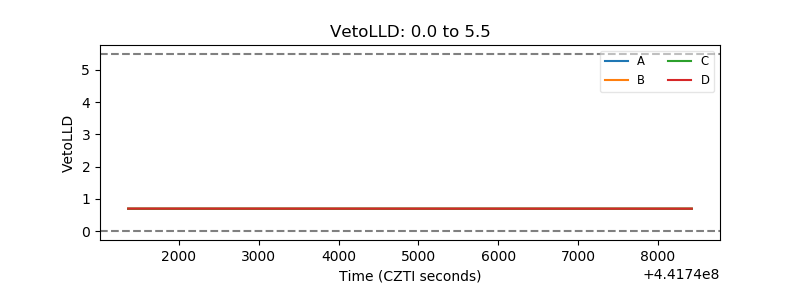 |
| Alpha Counter | 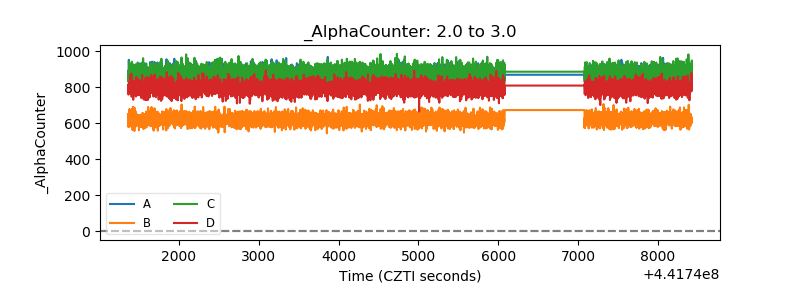 |
| _CPM_Rate | 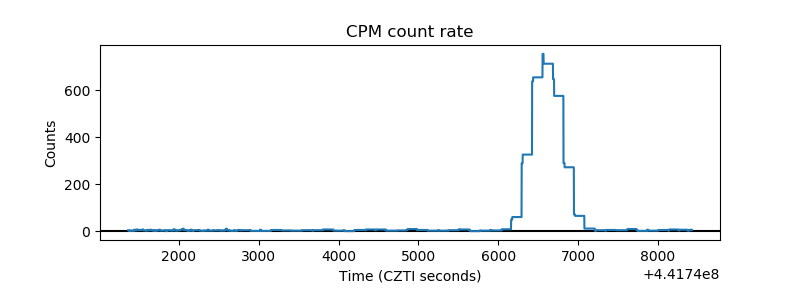 |
| CZT Counter | 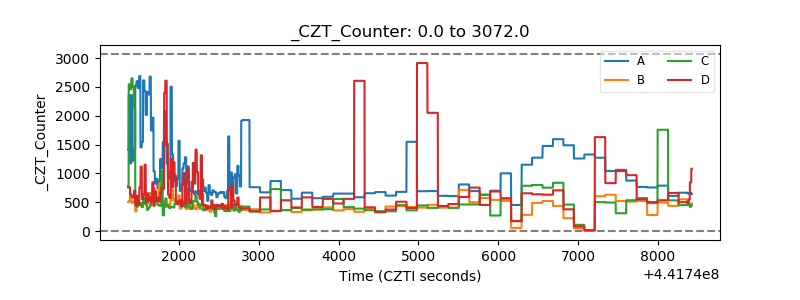 |
| +2.5 Volts monitor | 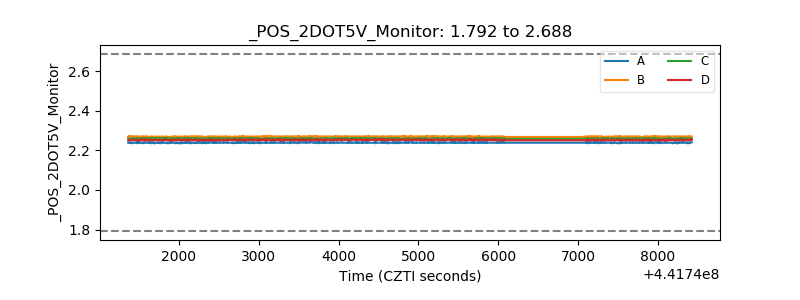 |
| +5 Volts monitor | 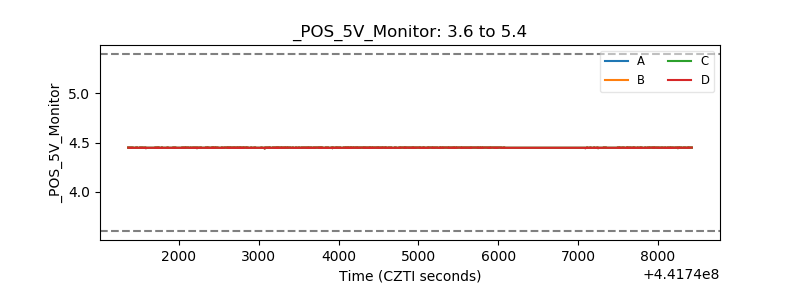 |
| _ROLL_ROT | 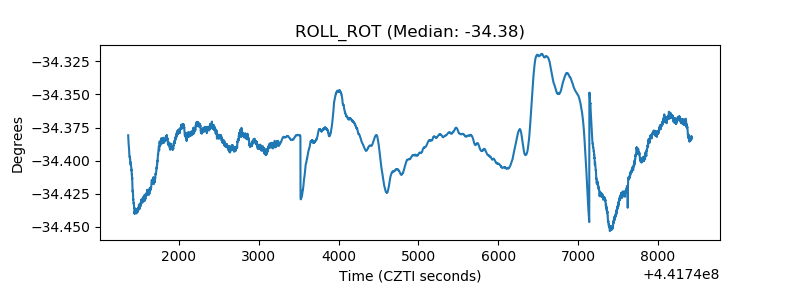 |
| _Roll_DEC | 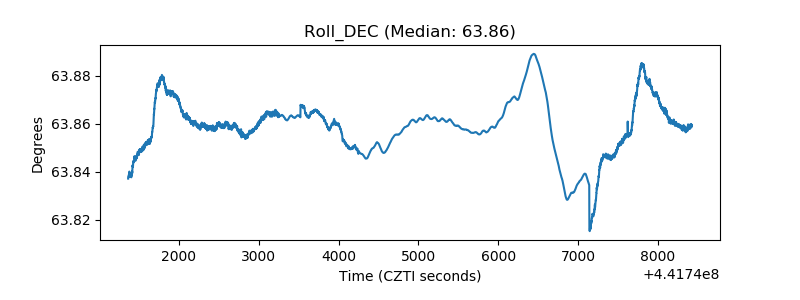 |
| _Roll_RA | 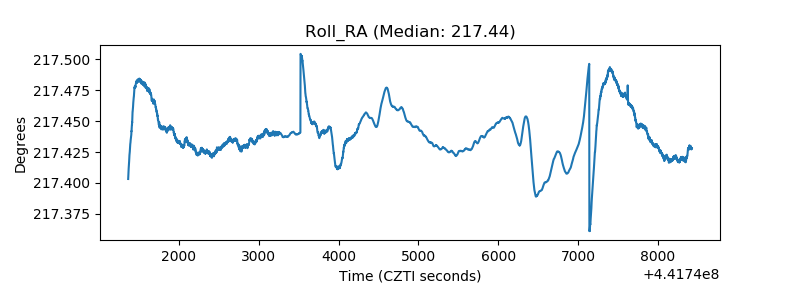 |
| Veto Counter | 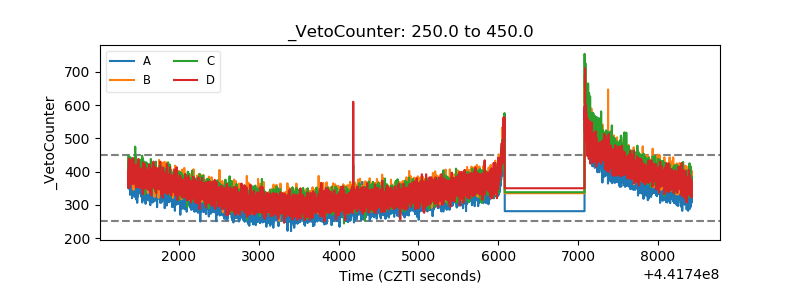 |